Role of endoplasmic reticulum stress on the insulin response in the fetoplacental vasculature from pregestational maternal obesity
227
0
0
Texto completo
(2) A mi hijo Benjamín.
(3) i.. Acknowledgements. Recuerdo que el inicio de este camino estuvo lleno de entusiasmo y motivación por enfrentarme a nuevos desafíos; sin embargo, éste no estuvo exento de incertidumbre y miedos. Este viaje, que en un comienzo parecía ser largo y difícil, terminó siendo un viaje casi fugaz que me entregó herramientas personales y académicas invaluables; y que, a pesar de ser complejo en algunos momentos, el balance final fue siempre positivo gracias al apoyo de muchas personas. Agradezco a todas ellas por haber hecho posible que llegase a esta instancia. En primer lugar, quiero agradecer a mis padres, mi hermana y su compañero de vida David, quienes fueron un gran apoyo en lo personal. Siempre estuvieron presentes y preocupados de mi bienestar. También quiero agradecer a mi pequeño hijo Benjamín, quien a su corta edad fue y seguirá siendo la mayor motivación para continuar este camino que he emprendido. Agradezco también a mis abuelos Raúl y Carmen, por recibirme cuando llegué a Santiago y por estar pendientes de mí durante estos años. Agradezco a Jose Luis, quien fue una compañía y apoyo incondicional durante los años del doctorado, y me comprendió en los momentos en los que el tiempo libre era escaso. También, a mi gran amigo Pedro Pichinao, quien me acompañó en mi venida a Santiago y luego fue un apoyo fundamental en los últimos años del doctorado. Agradezco sinceramente el entusiasmo y la confianza depositada en mí por mi tutor y mentor, el profesor Luis Sobrevia, quien supo guiarme en cada paso que di durante estos años de doctorado; y que, gracias a su constancia, supo empujarme hacia horizontes que estaban más allá de lo que yo vislumbraba. También, al Dr. Marcelo Farías, con quien inicié mi trabajo como bioquímico en Santiago. Su apoyo y consejo fueron fundamentales para tomar la decisión de iniciar mis estudios de PhD, y ha continuado siendo una guía durante este tiempo. No puedo dejar de mencionar al profesor Marcelo González, quien, allá en Concepción, fue el que me abrió las puertas hacia la investigación y el primero en motivarme para que continuara en el camino de la ciencia; quien además, ha continuado siendo mi mentor durante estos años de doctorado. Debo mencionar, sin duda, a Franciso Westermeier y Pablo Sáez, quienes fueron de gran apoyo en mi llegada a Santiago. Ambos incentivaron y fortalecieron en mí el desarrollo de un pensamiento científico crítico, y fueron fundamentales en los inicios de esta tesis. Pablo Sáez, además de gran amigo, ha sido también uno de mis mentores desde antes de iniciar mi tesis, quien aun estando fuera del país, se dedicó a aconsejar a este estudiante - a veces obstinado -, y fue fundamental en cada una de las decisiones importantes que tomé durante esta tesis. Quiero agradecer también a toda la familia CMPliana - o personas ligadas al laboratorio -, quienes más que ser compañeros de trabajo, fueron mi familia en Santiago. Agradezco a Andrea Leiva y Fabián Pardo, quienes además de amigos fueron de gran apoyo profesional y personal. También agradezco especialmente a mis compañeros de laboratorio Lorena Carvajal, Bárbara Fuenzalida, Luis Silva, Rocío Salsoso y Susana Contreras por el 1.
(4) apoyo académico que me brindaron, quienes además de ser compañeros de trabajo, fueron amigos que me acompañaron de cerca día a día, desde pelearse por la campana de cultivo o las cámaras de western blot, hasta cafecitos a media mañana, idas post laboratorio al Danoi, o carretes en algún departamento. Gracias por todos los favores sin retribución – y, obviamente, solicitados a última hora - que hicieron por mí. No puedo dejar de mencionar en este grupo a Mario Subiabre, quien además de ser mi compañero de generación y de laboratorio, fue un gran amigo con el que compartí cada paso en esta carrera. Gracias perrín por toda la ayuda en el llenado de formularios, trámites del doctorado y Conicyt. También a Eric Barros, por los consejos siempre oportunos en lo académico y personal, por todos los breaks y conversaciones fuera del laboratorio, y por toda la ayuda desinteresada en la elaboración de este escrito. A Andreína Arias e Indira Chiarello, por las conversaciones y risas fuera del laboratorio, el apoyo en los momentos difíciles, y la ayuda y preocupación que mostraron en el desarrollo de mi trabajo. A Tamara Sáez, quien siempre estuvo disponible a distancia para cada consejo que necesité. A Amparo Pacheco, por ser una excelente persona y amiga, colaborando siempre para hacer el trabajo más agradable. También a Javier Ustariz y su compañero de vida Ramiro Guerrero, por ser buenos amigos que siempre estuvieron preocupados por mi bienestar. Agradezco además a Katherinne Bugueño y Carolina Pizarro, quienes estuvieron en el laboratorio en los inicios de mis estudios y se convirtieron en grandes amigas. Gracias, además, a Gonzalo Fuentes y Carolina Oliva, quienes se integraron en este último tiempo al laboratorio, pero aun así supieron dejar una huella en mí. Todos ustedes llegaron a ser sumamente especiales para mí y atesoraré siempre los buenos momentos en mi memoria.. A todos, sinceramente, gracias.. 2.
(5) ii.. Publications. Articles and Reviews ISI Villalobos-Labra R, Westermeier F, Pizarro C, Sáez PJ, Toledo F, Pardo F, Kusanovic JP, Mardones F, Poblete JA, Sobrevia L, Farías M, Neonates from women with pregestational maternal obesity show reduced umbilical vein endothelial response to insulin, Placenta, 2019 (In Press). DOI:10.1016/j.placenta.2019.07.007 Cabalín C, Villalobos-Labra R, Toledo F, Sobrevia L. Involvement of A2B adenosine receptors as anti-inflammatory in gestational diabesity, Mol Aspects Med., 2019: 3139. DOI:10.1016/j.mam.2019.01.001 Subiabre M, Villalobos-Labra R, Silva L, Fuentes G, Toledo F, Sobrevia L. Role of insulin, adenosine, and adipokine receptors in the foetoplacental vascular dysfunction in gestational diabetes mellitus, BBA - Mol Basis Dis, 2019 (In Press). DOI:10.1016/j.bbadis.2018.12.021 Villalobos-Labra R, Subiabre M, Toledo F, Pardo F, Sobrevia L. Endoplasmic reticulum stress and development of insulin resistance in adipose, skeletal, liver, and foetoplacental tissue in diabesity, Mol Aspects Med., 2019: 49-61. DOI:10.1016/j.mam.2018.11.001 Villalobos-Labra R, Subiabre M, Silva L, Toledo F, Saez PJ, Westermeier F, Pardo F, Farias-Jofre M, Sobrevia L. Pre-pregnancy maternal obesity associates with endoplasmic reticulum stress in umbilical vein endothelium, BBA - Mol Basis Dis, 2018: 3195-3210. DOI:10.1016/j.bbadis.2018.07.007 Pardo F, Villalobos-Labra R, Sobrevia B, Toledo F, Sobrevia L. Extracellular vesicles in obesity and diabetes mellitus, Mol. Aspects Med., 2017: 81-91. DOI:10.1016/j.mam.2017.11.010 Villalobos-Labra R, Silva L, Subiabre M, Araos J, Salsoso R, Fuenzalida B, Sáez T, Toledo F, González M, Quezada CA, Pardo F, Chiarello D, Leiva A, Sobrevia L. Akt/mTOR role in human foetoplacental vascular insulin resistance in diseases of pregnancy, J Diab Res, 2017:5947859. DOI:10.1155/2017/5947859 Subiabre M, Silva L, Villalobos-Labra R, Toledo F, Paublo M, López M, Salsoso R, Pardo F, Leiva A, Sobrevia L. Maternal insulin therapy does not restore foetoplacental endothelial dysfunction in gestational diabetes mellitus, BBA - Mol Basis Dis, 2017: 2987-2998. DOI:10.1016/j.bbadis.2017.07.022 Pardo F, Villalobos-Labra R, Chiarello D, Salsoso R, Toledo F, Gutiérrez J, Leiva A, Sobrevia L. Molecular implications of adenosine in obesity, Mol Aspects Med, 2017: 90-101. DOI:10.1016/j.mam.2017.01.003 Sobrevia L, Salsoso R, Fuenzalida B, Barros E, Toledo L, Silva L, Pizarro C, Subiabre M, Villalobos R, Araos J, Toledo F, González M, Gutiérrez J, Farías M, Chiarello D, Pardo F, Leiva A. Insulin is a key modulator of fetoplacental endothelium metabolic. 3.
(6) disturbances in gestational diabetes mellitus, Front Physiol, 2016: 119. DOI:10.3389/fphys.2016.00119 Leiva A, Fuenzalida B, Barros E, Sobrevia B, Salsoso R, Sáez T, Villalobos R, Silva L, Chiarello I, Toledo F, Gutiérrez J, Sanhueza C, Pardo F, Sobrevia L. Nitric oxide is a central common metabolite in vascular dysfunction associated with diseases of human pregnancy, Curr Vasc Pharmacol, 2016: 237-259. DOI:10.2174/1570161114666160222115158 Sanhueza C, Araos J, Naranjo L, Villalobos R, Westermeier F, Salomon C, Beltrán A, Ramírez MA, Gutiérrez J, Pardo F, Leiva A, Sobrevia L. Modulation of intracellular pH in human ovarian cancer, Curr Mol Med, 2016: 23-32. DOI:10.2174/1566524016666151222143437 González M, Rojas S, Avila P, Cabrera L, Villalobos R, Palma C, Aguayo C, Peña E, Gallardo V, Guzmán-Gutiérrez E, Sáez T, Salsoso R, Sanhueza , Pardo F, Leiva A, Sobrevia L. Insulin reverses D-glucose-increased nitric oxide and reactive oxygen species generation in human umbilical vein endothelial cells, PLoS One, 2015. DOI:10.1371/journal.pone.01223983 Sáez PJ, Villalobos-Labra R, Westermeier F, Sobrevia L, Farías-Jofré M. Modulation of endothelial cell migration by ER stress and insulin resistance: A role during maternal obesity?, Front in Pharmacol, 2014. DOI:10.3389/fphar.2014.00189 Westermeier F, Sáez PJ., Villalobos-Labra R, Sobrevia L, Farías-Jofré M. Programming of fetal insulin resistance in pregnancies with maternal obesity by ER stress and inflammation, BioMed Res Internat., 2014. DOI:10.1155/2014/917672. Articles and Reviews Not ISI Pardo F, Silva L, Salsoso R, Sáez T, Farías M, Villalobos R, Leiva A, Sanhueza C, Sobrevia L. Fetoplacental endothelial dysfunction in maternal hypercholesterolemia and obesity in pregnancy. Physiology Mini-Reviews 7:60-76, 2014 Book chapters Subiabre M, Villalobos-Labra R, Silva L, Pardo F, Sobrevia L. Insulin therapy and foetoplacental endothelial dysfunction in gestational diabetes mellitus. In: Frontiers in Clinical Drug Research-Diabetes & Obesity (FCDR-DO). Eds. Atta-ur-Rahman. Ed. Bentham Science Publishers (In press).. 4.
(7) iii. Index of contents i.. Acknowledgements ....................................................................................................... 1. ii.. Publications ................................................................................................................... 3. iii.. Index of contents ........................................................................................................... 5. iv.. Index of figures ............................................................................................................. 8. v.. Index of tables ............................................................................................................. 11. vi.. Index of schemes ......................................................................................................... 12. vii.. List of abbreviations.................................................................................................... 13. viii. Resumen ...................................................................................................................... 16 ix.. Abstract ....................................................................................................................... 19. 1.. Introduction ................................................................................................................. 21 Endothelial dysfunction and vascular insulin response .......................................... 23 The endothelium ..................................................................................................... 23 Structure and function of eNOS ............................................................................. 24 Endothelial dysfunction in PGMO ......................................................................... 27 Vascular insulin resistance in PGMO .................................................................... 29 Endoplasmic Reticulum Stress ............................................................................... 31 ER stress and the unfolded protein response .......................................................... 34 Association of ER stress with insulin resistance and endothelial dysfunction ....... 37 ER stress in fetoplacental vasculature from PGMO ............................................... 41. 2.. Hypothesis ................................................................................................................... 43. 3.. Objectives.................................................................................................................... 44 General objectives .................................................................................................. 44 Specific objectives .................................................................................................. 44. 4.. Methods ....................................................................................................................... 46 Study groups ........................................................................................................... 46 Collection of umbilical cords and isolation of HUVECs ....................................... 49 Experimental conditions ......................................................................................... 50 Isolation and quantification of proteins .................................................................. 50 Western blot ........................................................................................................... 51 Umbilical vein reactivity ........................................................................................ 53 Total RNA extraction and reverse transcription..................................................... 54 5.
(8) Non-quantitative PCR ............................................................................................ 54 Quantitative PCR .................................................................................................... 54 L-Arginine transport ............................................................................................... 57 Intracellular NO determination .............................................................................. 59 L-Citrulline determination ...................................................................................... 59 Arginase activity..................................................................................................... 60 Quantification of proteins in lysates extracted with KOH ..................................... 61 Immunofluorescence and confocal microscopy ..................................................... 61 IRE1α suppression.................................................................................................. 62 Sample size estimation ........................................................................................... 63 Statistical analysis .................................................................................................. 64 5.. Results ......................................................................................................................... 65 Patients ................................................................................................................... 65 Study groups ........................................................................................................... 65 Association of GWG and birth weight with the pre-pregnancy BMI .................... 65 Endothelial dysfunction and insulin resistance ...................................................... 69 Characteristics of the umbilical vein rings ............................................................. 69 Vascular reactivity in response to insulin............................................................... 69 Vascular reactivity in response to CGRP ............................................................... 69 NO production by HUVECs in response to insulin ............................................... 76 L-Arginine transport and hCAT-1 .......................................................................... 82 Insulin signaling ..................................................................................................... 86 Activation of UPR .................................................................................................. 91 Activation of the master UPR sensors .................................................................... 91 Pharmacologic modulation of ER stress ................................................................ 91 Activity of PERK branch ..................................................................................... 105 Activity of the IRE1α branch ............................................................................... 112 Activation of ATF6 .............................................................................................. 113 ER stress, endothelial dysfunction, and insulin resistance ................................... 120 ER stress and endothelial dysfunction.................................................................. 120 ER stress and insulin response ............................................................................. 135 Pharmacological inhibition of PERK, IRE1α, and knockdown of IRE1α ........... 148 PERK and IRE1α involvement in the impairment of the insulin response .......... 159. 6.. Discussion ................................................................................................................. 169 Pregestational maternal obesity ............................................................................ 170 Insulin desensitization and endothelial dysfunction in fetoplacental vasculature 174 6.
(9) PGMO effect on umbilical vein reactivity ........................................................... 175 PGMO effect on endothelial function and insulin response in HUVECs ............ 177 PGMO effect on L-arginine transport in HUVECs .............................................. 178 PGMO effect on the insulin signaling pathway in HUVECs ............................... 180 Endoplasmic reticulum stress in HUVECs from PGMO pregnancies ................. 181 PERK signaling branch in HUVECs from PGMO pregnancies .......................... 182 IRE1α signaling branch in HUVECs from PGMO pregnancies .......................... 183 ATF6 activation in HUVECs from PGMO .......................................................... 185 PGMO-associated ER stress and endothelial dysfunction ................................... 187 PGMO-associated ER stress and NO production ................................................. 187 PGMO-associated ER stress and eNOS activation state ...................................... 188 PGMO-associated ER stress and L-arginine transport ......................................... 189 PGMO-associated ER stress and arginases activity ............................................. 190 PGMO-associated ER stress and desensitization to insulin ................................. 191 PGMO-associated ER stress and impaired insulin response ................................ 191 PERK and IRE1α involvement in the impairment of the insulin response .......... 192 Final comments .................................................................................................... 195 7.. Conclusions ............................................................................................................... 199. 8.. Appendix ................................................................................................................... 200. 9.. References ................................................................................................................. 204. 7.
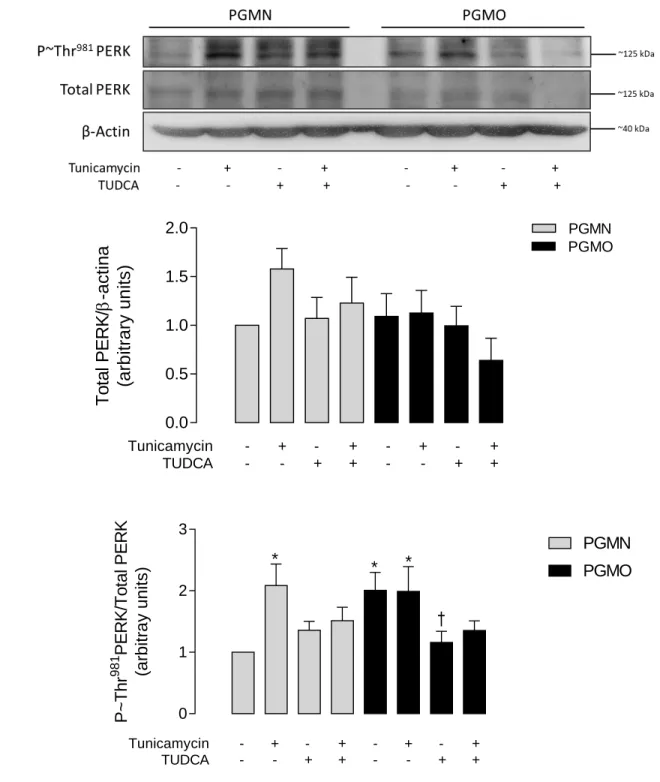
(10) iv.. Index of figures. Figure 1. Endoplasmic reticulum stress and unfolded protein response. .......................... 36. Figure 2. Relationship of the dependence of gestational weight gain and birth weight on the maternal pre-pregnancy BMI. ................................................................. 68. Figure 3. Stretching at the optimal diameter. .................................................................... 70. Figure 4. KCl-induced contraction at the optimal diameter. ............................................. 71. Figure 5. SNP-induced vasodilation. ................................................................................. 72. Figure 6. Insulin-induced relaxation in human umbilical vein rings. ................................ 73. Figure 7. CGRP-induced relaxation in human umbilical vein rings. ................................ 74. Figure 8. DAF-FM fluorescent signal in HUVECs. .......................................................... 78. Figure 9. Total and NOS-dependent NO generation in response to insulin by HUVECs . 79. Figure 10 Abundance and activation status of eNOS. ........................................................ 81 Figure 11 L-arginine transport in HUVECs. ...................................................................... 83 Figure 12 Protein abundance of hCAT-1 in HUVECs. ...................................................... 85 Figure 13 Abundance and insulin-induced activation of IR. .............................................. 88 Figure 14 Abundance and activation status of IRS1. ......................................................... 89 Figure 15 Abundance and insulin-induced activation of Akt. ............................................ 90 Figure 16 Abundance and activation status of PERK. ....................................................... 94 Figure 17 Abundance and activation state of eIF2α. .......................................................... 95 Figure 18 Abundance and activation status of IRE1α. ....................................................... 96 Figure 19 Cellular localization of ATF6. ........................................................................... 97 Figure 20 Time curve for inactivation of eIF2α in response to tunicamycin in HUVECs from PGMN pregnancies................................................................... 98 Figure 21 Time curve for inactivation of eIF2α in response to tunicamycin in HUVECs from PGMO pregnancies................................................................... 99. 8.
(11) Figure 22 Time curve for inactivation of eIF2α in response to TUDCA in HUVECs from PGMN pregnancies. ................................................................................ 100 Figure 23 Time curve for inactivation of eIF2α in response to TUDCA in HUVECs from PGMO pregnancies. ................................................................................ 101 Figure 24 eIF2α activation state in response to different concentrations of tunicamycin and TUDCA in HUVECs. ............................................................................... 103 Figure 25 Modulation of PERK phosphorylation by tunicamycin and TUDCA. ............ 107 Figure 26 Modulation of eIF2α phosphorylation by tunicamycin and TUDCA. ............. 108 Figure 27 Modulation of CHOP expression by tunicamycin and TUDCA. ..................... 109 Figure 28 Modulation of TRB3 expression by tunicamycin and TUDCA....................... 110 Figure 29 Modulation of BiP mRNA levels by tunicamycin and TUDCA...................... 111 Figure 30 Modulation of IRE1α by tunicamycin and TUDCA. ....................................... 115 Figure 31 Modulation of JNK by tunicamycin and TUDCA. .......................................... 116 Figure 32 Processing of XBP1 mRNA by Tunicamycin and TUDCA. ........................... 117 Figure 33 Effect of tunicamycin and TUDCA treatment on the cellular localization of ATF6. .......................................................................................................... 119 Figure 34 ER stress modulation of NO generation in HUVECs. ..................................... 123 Figure 35 ER stress modulation of L-citrulline content in HUVECs. .............................. 124 Figure 36 Modulation of eNOS abundance and activation state by ER stress. ................ 126 Figure 37 Modulation of Akt abundance and activation state by ER stress. .................... 127 Figure 38 ER stress effect on arginases activity. .............................................................. 130 Figure 39 ER stress effect on L-arginine transport........................................................... 132 Figure 40 Modulation of hCAT-1 expression in HUVECs by ER stress. ........................ 134 Figure 41 Involvement of ER stress in the insulin-induced relaxation in umbilical vein rings. ........................................................................................................ 137 Figure 42 ER stress modulation of NO generation in response to insulin by HUVECs. . 140. 9.
(12) Figure 43 Modulation of the abundance and activation state of eNOS in response to inulin by ER stress. .......................................................................................... 143 Figure 44 Modulation of the abundance and activation state of eNOS in response to inulin by ER stress. .......................................................................................... 145 Figure 45 Modulation of Akt abundance and activation in response to insulin by ER stress ................................................................................................................ 146 Figure 46 Modulation of Akt abundance and activation state by ER stress. .................... 147 Figure 47 Inhibition of PERK by GSK2606114. ............................................................. 150 Figure 48 PERK-induction of eIF2α activation in HUVECs. .......................................... 151 Figure 49 Inhibition of IRE1α by KIRA6. ....................................................................... 153 Figure 50 IRE1α-inhibition effect on JNK and XBP1 processing. .................................. 155 Figure 51 Knockdown of IRE1α. ..................................................................................... 156 Figure 52 Effect of IRE1α Knockdown on the activation of JNK. .................................. 157 Figure 53 Inhibition of JNK by SP600125. ...................................................................... 158 Figure 54 PERK-inhibition effect on the NOS-dependent NO production in response to insulin. ......................................................................................................... 162 Figure 55 Effect of IRE1α inhibition on the NOS-dependent NO production in response to insulin. .......................................................................................... 163 Figure 56 Effect of IRE1α inhibition on the NOS-dependent NO production in response to insulin. .......................................................................................... 164 Figure 57 Effect of IRE1α Knockdown on the activation of IRS1. ................................. 165 Figure 58 JNK-inhibition effect on the IRS1 activation state. ......................................... 166 Figure 59. IRE1α involvement in the insulin-induced eNOS activation in HUVECs from PGMO. .................................................................................................... 167. Figure 60 IRE1α involvement in the insulin-induced Akt activation in HUVECs from PGMO. .................................................................................................... 168 Figure 61 The potential involvement of pre-pregnancy maternal obesity-induced endoplasmic reticulum stress in human umbilical vein endothelial cell dysfunction and insulin desensitization. .......................................................... 198 10.
(13) v.. Index of tables. Table 1. UPR activation in metabolic tissues of patients with obesity............................... 33. Table 2 ER stress and induction of endothelial dysfunction and insulin resistance in the vasculature ................................................................................................. 39 Table 3. Selection criteria of biological samples ................................................................ 48. Table 4. Antibodies used in Western blot........................................................................... 52. Table 5. Oligonucleotide sequences for non-quantitative and quantitative PCR ............... 56. Table 6. Clinical characteristics of pregnant women and newborns .................................. 66. Table 7. Parameters for NOS-dependent relaxation to insulin and CGRP in human umbilical vein rings. ............................................................................................. 75. Table 8. Kinetic parameters for the L-arginine transport in HUVECs ............................... 84. Table 9 Tunicamycin and TUDCA concentrations and incubation times used in the treatment of cells cultures .................................................................................. 104 Table 10 Kinetic parameters for the L-arginine transport in HUVECs ............................. 133 Table 11 Parameters dose-response of NOS-dependent relaxation in response to insulin in human umbilical vein rings treated with tunicamycin or TUDCA .... 138. 11.
(14) vi.. Index of schemes. Scheme 1. L-arginine uptake and NO generation................................................................. 77 Scheme 2. Insulin signaling pathway in endothelium .......................................................... 87 Scheme 3. Key proteins of the unfolded protein response ................................................... 93 Scheme 4. ER stress and endothelial function .................................................................... 122 Scheme 5. ER stress and insulin signaling pathway ........................................................... 139 Scheme 6. PERK and IRE1α involvement in the insulin signaling pathway .................... 161. 12.
(15) vii. List of abbreviations ACOG ATF4 ATF6 BAECs BH4 BiP BMI CaM CARE CAT-1 CAT-2B Cav-1 cDNA cGMP CGRP CHOP CNX CRT DAF-FM db/db DIO DMG DMT1 DMT2 EC EC50 EDR eGWG eIF2α eNOS ER ERAD FMD GWG HAECs hCAT-1 hCAT-2B HEPES HFD HG HOMA-IR HUVECs ICAM. American College of Obstetricians and Gynecologists Activating transcription factor 4 Activating transcription factor 6 Bovine aortic endothelial cells Tetrahydrobiopterin Binding immunoglobulin protein Body mass index Calmodulin CCAAT-enhancer binding protein-activating transcription factor response elements Cationic amino acid transporter isoform 1 Cationic amino acid transporter isoform 2B Caveolin 1 Complementary DNA Cyclic guanosine monophosphate Calcitonin gene-related peptide CCAAT-enhancer-binding protein homologous protein Calnexin Calreticulin 4-Amino-5-methylamino-2',7'-difluorofluorescein diacetate Leptin receptor deficient mice Diet-induced obesity Diabetes mellitus gestational Diabetes mellitus type 1 Diabetes mellitus type 2 Endothelial cells Half maximal effective concentration Endothelium-dependent response Excessive gestational weight gain Subunit α of the eukaryotic translation initiator factor 2 Endothelial nitric oxide synthase Endoplasmic reticulum ER-associated degradation Flow-mediated dilation Gestational weight gain Human aortic endothelial cells Human cationic amino acid transporter isoform 1 Human cationic amino acid transporter isoform 2B 4-(2-hydroxyethyl)-1-piperazineethanesulfonic acid buffer High-fat diet Hyperglycemia Homeostatic model assessment for insulin resistance Human umbilical vein endothelial cells Intercellular Adhesion Molecule 1 13.
(16) IL-6 iNOS IOM IR IRE1α IRS-1 IUGR JNK Km MAECs MAPK MCEC MINSAL MRA mRNA NADPH nNOS NO NOS NOx O2 OAT OCTT PBS PCM PCR PDI PDK1 PERK PGMO PI3K PIP3 PKA PKC QUICKI Rh RIDD Rmax SAT Ser sGC Sh2 SNP Thr TNFα TRAF2 TRB3. Interleukin 6 Inducible nitric oxide synthase Institute of Medicine (US) Insulin receptor Inositol-requiring enzyme 1α Insulin receptor substrate 1 Intrauterine growth restriction c-jun N-terminal kinase 1 Michaelis-Menten constant Mouse aortic endothelial cells Mitogen-activated protein kinases Mouse coronary endothelial cells Ministerio de Salud de Chile Mesenteric resistance arteries Messenger ribonucleic acid Nicotinamide adenine dinucleotide phosphate hydrogenated Neuronal nitric oxide synthase Nitric oxide Nitric oxide synthase Nitrite/nitrate levels Molecular oxygen Omental adipose tissue Oral glucose tolerance test Phosphate-buffered saline Primary culture medium Polymerase Chain Reaction Protein disulfide isomerase A3 3-phosphoinositide-dependent protein kinase 1 Protein kinase RNA-like endoplasmic reticulum kinase Pre-gestational maternal obesity Phosphatidylinositol 3-kinase Phosphatidylinositol 3,4,5-trisphosphate Protein kinase A Protein kinase C Quantitative insulin sensitivity check index Rhesus D antigen IRE1-dependent decay Maximum relaxation Subcutaneous adipose tissue Serine residue Soluble guanylate cyclase Src homology 2 Sodium nitroprusside Threonine residue Tumor necrosis factor α Tumor necrosis factor receptor-associated factor 2 Tribbles-like protein 3 14.
(17) TUDCA Tyr UPR VAT VCAM vi Vmax Vmax/Km XBP1 XBP1s XBP1u. Tauroursodeoxycholic acid Tyrosine residue Unfolded protein response Visceral adipose tissue Vascular cell adhesion protein 1 Initial velocity Maximum velocity Maximum transport capacity X-box binding protein 1 Spliced X-box binding protein 1 Unspliced X-box binding protein 1. 15.
(18) viii. Resumen La prevalencia de mujeres con obesidad en Chile ha aumentado drásticamente en las últimas décadas, alcanzando un 38,4% de las mujeres mayores de 18 años en el año 2017. La obesidad en el embarazo es un factor de riesgo independiente tanto para la madre como para el feto, quienes presentan mayor riesgo para el desarrollo de diabetes gestacional, preeclampsia, anomalías congénitas, macrosomía y mortalidad materna o fetal. Además, se ha demostrado que los efectos adversos inducidos por la obesidad durante el embarazo sobre el feto perduran durante toda su vida. Estudios epidemiológicos muestran que la obesidad materna pre-gestacional (PGMO) es un factor de riesgo para el desarrollo de resistencia a la insulina y disfunción endothelial en neonatos y adolescentes, las cuales son condiciones fisiopatológicas consideradas como los primeros estados que conducen al desarrollo de síndrome metabólico y complicaciones cardiovasculares. En cuanto a los mecanismos involucrados, se ha mostrado que la disfunción endotelial y la resistencia a la insulina presentes en obesidad están estrechamente asociadas con estrés del retículo endoplásmico (RE). Por otro lado, estudios sugieren que PGMO induce disfunción endotelial y resistencia a la insulina en vasculatura fetoplacentaria. Sin embargo, se desconoce si el estrés de RE está presente en el endotelio fetoplacentario de embarazos PGMO y si está involucrado en la disfunción endotelial y la alterada respuesta a la insulina. Así, la hipótesis de este estudio propone que "la obesidad materna pre-gestacional genera una menor respuesta a la insulina en la vasculatura fetoplacentaria humana debido a una disfunción endotelial asociada al estrés del retículo endoplásmico". En esta tesis se desmostró que PGMO se asoció con disfunción endotelial y resistencia a la insulina en venas umbilicales, la cuales no mostraron vasodilatación en 16.
(19) respuesta a CGRP o insulina. La menor respuesta vascular se asoció con una producción reducida de óxido nítrico (NO) debido a una menor activación de la sintasa del NO endotelial (eNOS) en las células endoteliales de vena umbilical humana (HUVECs). Además, la insulina no activó la vía de señalización metabólica post-IR, eNOS y no aumentó la producción de NO en respuesta a la insulina en estas células. Los resultados muestran que el transporte de L-arginina estaba aumentado, sugiriendo un mecanismo compensatorio que parece no ser suficiente para recuperar la producción de NO. Por otro lado, PGMO se asoció con un aumento de la actividad de UPR en HUVECs. Se encontró un aumento en la actividad de las vías de señalización asociados a PERK e IRE1α, así como de la translocación de ATF6 al núcleo. La reducción del estrés de ER mediante TUDCA (100 μM) redujo la actividad de las tres vías de la UPR y generó una reducción del transporte de L-arginina, un aumento de la actividad eNOS basal e inducida por insulina, de la producción de NO, y sensibilizó la activación de la vía de señalización de insulina en respuesta a insulina. Así, el estrés del RE asociado a PGMO se asoció con la disfunción endotelial y la desensibilización a la insulina presentadas por HUVECs. Por otro lado, las alteraciones observadas en HUVECs PGMO fueron reproducidas en HUVECs de embarazos PGMN al inducir ER stress con tunicamicina (5 μ). Finalmente, el aumento de la expresión de TRB3 inducida por PERK, una pseudoquinasa que inhibe Akt, no parece estar involucrado en la menor respuesta de insulina presentada por las HUVECs de embarazos de madres con PGMO. Sin embargo, el aumento en la actividad de IRE1α y la consiguiente activación de JNK generó inhibición de IRS1, reducción de Akt, activación de eNOS y producción de NO en respuesta a la insulina. Por lo tanto, la vía IRE1α/JNK/IRS1 se propone como un probable mecanismo en el deterioro de la vía de señalización de insulina producida por el estrés de RE en las HUVEC de embarazos PGMO. Así, este estudio plantea que PGMO produce disfunción endotelial y 17.
(20) desensibilización a la insulina en el endotelio de la vena umbilical a través de la generación de estrés de RE.. 18.
(21) ix.. Abstract The prevalence of women with obesity has rapidly increased in Chile, reaching 38.4%. of women over 18 years in 2017. Obesity during pregnancy is an independent risk factor to both the mother and the fetus, who are at higher risk to develop gestational diabetes, preeclampsia, congenital anomalies, macrosomia, and maternal or fetal mortality. Moreover, the obesity-induced adverse effects during pregnancy on the fetus remain throughout the offspring lifespan. Epidemiological studies indicated that pre-gestational maternal obesity (PGMO) is a risk factor for the development of insulin resistance and endothelial dysfunction in neonates and adolescents, which are pathophysiological states considered as the first steps leading to the development of metabolic syndrome and cardiovascular complications. On the other hand, studies suggest that PGMO induces endothelial dysfunction and insulin resistance in fetoplacental vasculature. Among the mechanisms, it has been shown that in obesity the endothelial dysfunction and insulin resistance are closely associated with endoplasmic reticulum (ER) stress. However, whether ER stress is present in the fetoplacental endothelium from PGMO pregnancies and whether it is involved in endothelial dysfunction and altered insulin response is unknown. Therefore, we hypothesized that ‘Pre-gestational maternal obesity generates a lower response to insulin in the human fetoplacental vasculature due to endoplasmic reticulum stress-associated endothelial dysfunction’. In this thesis we demonstrated that PGMO was associated with endothelial dysfunction and insulin resistance in umbilical veins, which did not show vasodilation in response to calcitonin gene-related peptide or insulin. This deficient vascular response was associated with reduced nitric oxide (NO) production due to reduced activation of the endothelial nitric oxide synthase (eNOS) in human umbilical vein endothelial cells (HUVECs). Moreover,. 19.
(22) insulin did not activate the post-IR metabolic signaling pathway, eNOS and did not increase the NO production in response to insulin in these cells. The transport of L-arginine was found increased, suggesting a compensatory mechanism that seems unable to recover the NO production. On the other hand, PGMO was associated with higher UPR activity in HUVECs. The activity of the signaling pathways activated by PERK and IRE1α was increased, as well as the translocation of ATF6 to the nucleus. The amelioration of ERS by TUDCA (100 μM) reduced the activity of the three pathways of the UPR and resulted in a reduction of the Larginine transport, an increase of the basal and insulin-induced eNOS activity, the NO production, and sensitized the activation of the insulin signaling pathway in response to insulin. Thus, the PGMO-associated ERS was related to the endothelial dysfunction and the insulin desensitization seen in HUVECs. On the other hand, the impairment seen in HUVECs from PGMO was reproduced in HUVECs from PGMN pregnancies by the induction of ER stress with tunicamycin. Finally, the increased PERK-induced TRB3 expression, a pseudokinase that inhibits Akt, was not involved in the lower insulin response by HUVECs from PGMO. However, the increased IRE1α activity and the consequent activation of JNK, resulted in inhibition of IRS1, inhibition of Akt, eNOS activation and NO production in response to insulin. Thus, the IRE1α/JNK/IRS1 pathway is a likely mechanism in the deterioration of the insulin signaling pathway produced by the ER stress in the HUVECs from PGMO pregnancies. Therefore, this study shows that PGMO resulted in endothelial dysfunction and insulin desensitization in the endothelium of the umbilical vein through the generation of ER stress.. 20.
(23) 1.. Introduction Obesity is a metabolic disease whose prevalence is increasing worldwide (World Health. Organization (WHO), 2018). More than 650 million adults were obese in 2016, three times the worldwide prevalence in 1975 (WHO, 2018). According to the latest report from the Ministry of Health (MINSAL) of Chile, the prevalence of obesity is 9% higher than in 2011, reaching 34.4% of the population. The percentage among women reached 38.4% are women (MINSAL, 2017). Epidemiologic evidence shows that pre-gestational maternal obesity (PGMO) (body mass index (BMI) ≥30 kg/m2) is an independent risk factor for the development of gestational diabetes mellitus or preeclampsia (American College of Obstetricians and Gynecologists (ACOG), 2005). Furthermore, the offspring of PGMO mothers are predisposed to develop obesity, cardiovascular disease and metabolic disorders in childhood and adulthood (Gaillard et al., 2014; Godfrey et al., 2017; Mamun et al., 2009; Pirkola et al., 2010; Roberts et al., 2015; Stuebe et al., 2012, 2009). The latter support the possibility that some risk factor could be ‘transferable’ from the mothers to their children. Indeed, newborns from insulin-resistant obese mothers showed increased insulin resistance at birth (Catalano et al., 2009; Desoye, 2018). The possibility that harmful factors would be transferred from obese mothers to children has been addressed in the literature (Penfold and Ozanne, 2015); however the mechanism(s) involved are not fully understood. The transference of risk factors occur during pregnancy (Longtine and Nelson, 2011; Sobrevia et al., 2014), in a phenomenon referred to as “fetal programming” (Barker, 1998; Gluckman et al., 2008). This is supported by findings showing that after weight loss following bariatric surgery, children born to these mothers presented lower incidence of obesity and insulin resistance compared to their siblings born before the intervention 21.
(24) (Guenard et al., 2013; Kral et al., 2006; Smith et al., 2009). Fetoplacental tissues play a vital role in this phenomenon since they are the structural and functional connection of the fetus with the mother (Griffiths and Campbell, 2015). The placenta is an organ specialized in vital processes including gas exchange, transport of ions, nutrients, and waste products between the maternal and fetal plasma. Maternal substances are transferred from the maternal blood through the chorionic villous into the fetal capillaries. Blood flows through chorionic veins and reaches the umbilical vein returning the freshly oxygenated blood to the fetal circulation (Griffiths and Campbell, 2015; Villalobos-Labra et al., 2018b). Even when the fetoplacental tissues are a transient organ, altered function of this tissue is crucial in the fetal outcome with lifetime lasting consequences (Howell and Powell, 2017; Longtine and Nelson, 2011; Sobrevia et al., 2014). Obesity in adults associated with endothelial dysfunction and vascular insulin resistance, both of which are critical conditions in the early stages of the development of cardiovascular disease (Janus et al., 2016; Prieto et al., 2014; Versari et al., 2009). Reports available in the literature showed that, among the alterations associated to obesity, there is a strong correlation with abnormal endoplasmic reticulum (ER) homeostasis resulting in accumulation of misfolded proteins, a condition referred to as ‘ER stress’ (Battson et al., 2017; Cnop et al., 2012; Lenna et al., 2014). Obesity during pregnancy associates with endothelial dysfunction in human umbilical vein endothelial cells (HUVECs), umbilical veins (Pardo et al., 2015; Schneider et al., 2015), chorionic arteries (Schneider et al., 2015), and vascular (Pardo et al., 2015) and systemic (Catalano et al., 2009; Desoye, 2018) insulin desensitization in the fetus. Indeed, fetoplacental tissues from mothers with obesity showed high plasma level of inflammatory and oxidative markers (Bar et al., 2012; Ferretti et al.,. 22.
(25) 2014; Saben et al., 2014), which are in close association with ER stress (Flamment et al., 2012). Thus, the occurrence of ER stress appears to be a direct factor in the development of endothelial dysfunction and insulin resistance in fetoplacental tissues from PGMO mothers. Endothelial dysfunction and vascular insulin response The endothelium The endothelium is a continuous monolayer of cells covering the inner side of the blood vessels. This tissue not only acts as a barrier of separation and exchange between intra and extravascular spaces, but it is also a major player in the control of the vascular tone, blood fluidity, platelet aggregation, regulation of immunity, inflammation, angiogenesis, and is considered to act as an endocrine organ (Félétou, 2011). Thus, the endothelium participates in the signaling to and from the vascular lumen by directly interacting with blood cells (such as leukocytes, platelets or erythrocytes) and with other cells from the vascular wall (smooth muscle cells, fibroblasts, immune cells). Alterations of these endothelial functions result in a condition known as ‘endothelial dysfunction’. The endothelial dysfunction is defined as ‘the shift of the properties of the endothelium toward a phenotype characterized by impaired vasodilation and a proinflammatory and prothrombic status’ (Soriano et al., 2017). It is characterized by ‘an imbalance between vasodilating and vasoconstricting substances produced by (or acting on) endothelium’ (Deanfield et al., 2005). This condition is considered one of the main and first factors leading to the initiation, development and perpetuation of cardiovascular pathologies (Sandoo et al., 2015). The endothelial dysfunction appears even decades before a clinical outcome associated with a cardiovascular disease (Davignon and Ganz, 2004). Therefore, studying endothelial dysfunction is crucial to understand the cellular and molecular mechanisms underlying the development of cardiovascular disease.. 23.
(26) Endothelial dysfunction associates with abnormal generation of nitric oxide (NO), one of the main vasodilators released by the endothelium and critical in the regulation of vasomotor tone (Gimbrone and García-Cardeña, 2016). Once NO is produced, it diffuses from the endothelium reaching the underlying layer of smooth muscle cells. At this site, NO activates the soluble guanylyl cyclase (sGC) leading to the relaxation of smooth muscle cells (Gimbrone and García-Cardeña, 2016). Moreover, the deficiency of NO generation has been associated with peripheric vasoconstriction, which is a typical characteristic of metabolic syndrome (Mendizábal et al., 2013). Therefore, understanding the mechanisms leading to abnormal NO synthesis in pathological conditions turns out to be crucial to study the contribution of endothelial dysfunction in the development of cardiovascular disease. Structure and function of eNOS NO is synthesized from L-arginine via the nitric oxide synthases (NOS), releasing Lcitrulline as a byproduct. There are three mammalian isoforms of NOS: inducible (iNOS), neuronal (nNOS) and endothelial (eNOS). The eNOS is the dominant isoform expressed in the vasculature, being the main enzyme synthesizing the endothelium-derived NO in physiological conditions. It is constitutively expressed but its abundance can be up- or downregulated at a transcriptional and post-transcriptional level. Its activity is modulated at a post-translational level by Ca2+/calmodulin (CaM) binding, L-arginine uptake, availability of cofactors and activating and inhibiting phosphorylations (Balligand et al., 2009; Fleming, 2010; Förstermann and Sessa, 2012; Mas, 2009; Rafikov et al., 2011). eNOS is mainly located in the caveolae and the peri-area of the Golgi apparatus. It is an enzyme with two domains that functions as a dimer. Each subunit is formed by an N-terminal oxygenase domain that binds to heme, L-arginine, tetrahydrobiopterin (BH4) and 24.
(27) Ca2+/calmodulin (CaM), and a C-terminal reductase domain that binds to nicotinamide adenine dinucleotide phosphate (NADPH), flavin mononucleotide (FMN), and flavin adenine dinucleotide (FAD). In its inactive state, eNOS is coupled to caveolin-1 (Cav-1) decreasing its activity by preventing the binding of CaM (Michel et al., 1997). Besides, eNOS is constitutively phosphorylated in Thr 495 by PKC, which also prevents the binding to CaM. Its activation occurs by an increase in the intracellular calcium level resulting in dissociation of eNOS from Cav-1 and formation of a multi-protein complex with CaM, the chaperone heat shock protein 90 (HSP-90), and the recruiting of Akt and protein kinase A (PKA). These kinases enhance the NO production by phosphorylating the enzyme in serine 1177 (Balligand et al., 2009; Fleming, 2010; Gimbrone and García-Cardeña, 2016). The mechanism of NO synthesis starts by the delivery of electrons from NADPH to the flavins in the reductase domain of one subunit, which are then transferred to the heme in the oxygenase domain of the other subunit. Finally, the heme iron binds oxygen (O2) and catalyzes the NO synthesis from L-arginine. The CaM-binding is crucial for the eNOS activation, since it dimerizes the enzyme and enables the electron transference from the reductase to the oxygenase domain (Balligand et al., 2009; Fleming, 2010; Hellermann and Solomonson, 1997; Mas, 2009). Moreover, the calcium level is crucial to activate the enzyme, but it is only necessary to maintain the basal NO production. The maximal capacity of NO production does not depend on the calcium level, but on post-translational modifications. Several eNOS activity-modulatory phosphorylations have been reported, but the phosphorylation in threonine 495 and serine 1177 are considered the central modulators (Fleming, 2010). The phosphorylation in threonine 495 disrupts the binding of CaM to the reductase domain, blocking the enzyme activation and reducing the basal eNOS activity by. 25.
(28) about 10-20 times. On the other hand, phosphorylation in serine 1177 enhances the electron flux at the reductase domain increasing the efficiency of NO production by about 2-3 times over the basal (Fleming, 2010). It is reported that extracellular L-arginine availability is also crucial to eNOS activity in endothelial cells (Casanello et al., 2007; Hardy and May, 2002; Mann et al., 2003; Toral et al., 2018). However, while the extracellular L-arginine level is around 50-200 μM, the intracellular level in endothelial cells can reach 800 μM or higher. Moreover, the affinity of purified eNOS for L-arginine is lower than the intracellular level (Km = 2.9 μM) (Hardy and May, 2002), suggesting that the enzyme is operating under a saturated level of its substrate. Despite this, the NO production by endothelium is highly dependent on the extracellular Larginine, as reported in animal models (Cooke et al., 1992), humans (Clarkson et al., 1996; Cooke and Dzau, 1997; Drexler et al., 1991; Mirmiran et al., 2016), and in human endothelial cell cultures (Toral et al., 2018; Wyatt et al., 2002). The dependence of eNOS activity on the extracellular level of L-arginine, even when its intracellular level is higher, is described as the ‘L-arginine paradox’ (Hardy and May, 2002; Kurz and Harrison, 1997). This apparent controversy could be explained by ‘L-arginine compartmentalization’ (Casanello et al., 2007; Closs et al., 2004; Cynober, 2002), where the L-arginine contained in caveolae, which is used by eNOS for the synthesis of NO, is dependent on the amino acid transport from the extracellular medium and independent on other intracellular pools (Casanello et al., 2007). L-Arginine is taken up from the extracellular space via several plasma membrane transport systems, including the system y+ (Mann et al., 2003). System y+ is a family of proteins referred to as human cationic amino acids transporters (hCATs). hCATs members include hCAT-1, hCAT-2A, hCAT-2B, hCAT-3, and hCAT-4 (Mann et al., 2003). The 26.
(29) transport of L-arginine in HUVECs is mainly mediated by hCAT1 and hCAT-2B (Rajapakse et al., 2016; Vásquez et al., 2004), whose affinities for L-arginine are 100-200 μM and 200400 μM, respectively (Casanello et al., 2007). The NO synthesized by eNOS requires the expression and activity of CAT-1, since CAT-1 co-localizes with eNOS in caveolae (GarcíaCardeña et al., 1996; Mcdonald et al., 1997). Indeed, a direct interaction of eNOS with CAT1, which reduces the affinity of eNOS for cav-1 and stimulates its activation, has been reported (Li et al., 2005). Moreover, the transport activity of CAT-2B is required for iNOS activation in other cell types (Cynober, 2002). Thus, a structural and functional association of eNOS with CAT-1 more than CAT-2B is suggested (Casanello et al., 2007). Endothelial dysfunction in PGMO Endothelial dysfunction is described in the vasculature of pregnant women with PGMO (Stewart et al., 2007). The occurrence of endothelial dysfunction in fetoplacental tissues from PGMO women has also been reported. Chorionic arteries from mothers with exceeded weight (overweight and obesity) during pregnancy show impaired vasodilation in response to calcitonin gene-related peptide (CGRP) (Schneider et al., 2015), an endothelial-dependent vasodilator (Brain, 2004; Dong et al., 2004). In addition, umbilical veins from mothers with normal pre-pregnancy weight ending the pregnancy with obesity presented lower NOSdependent vasodilation. An increased threonine 495 phosphorylation but reduced serine 1177 phosphorylation, eNOS expression and L-citrulline production was found in HUVECs from that condition (Pardo et al., 2015). These findings suggest a deficient activity of eNOS giving a mechanistic explanation for the impaired endothelium-dependent vasodilation seen in these vessels (Pardo et al., 2015). Likewise, the umbilical arteries from PGMO mothers present higher resistance to blood flow, a finding that may relate to the occurrence of endothelial. 27.
(30) dysfunction in these vessels (Sarno et al., 2015). Altogether, the described results suggest the occurrence of endothelial dysfunction in fetoplacental vessels from PGMO mothers and raise NO deficiency as one of the potential causes of the altered endothelial function. The altered transport of L-arginine in the fetoplacental endothelium has been seen in several metabolic pregnancy complications associated with obesity. Among these are preeclampsia, intrauterine growth restriction (IUGR) or in gestational diabetes mellitus (GDM). HUVECs from GDM showed increased hCAT-1 expression and L-arginine transport, which correlated with higher NO production (Vásquez et al., 2004). Meanwhile, HUVECs from mothers with preeclampsia showed higher hCAT-1 expression and L-arginine transport but lower NO synthesis (Salsoso et al., 2015). Conversely, HUVECs from IUGR show reduced hCAT-1 expression, L-arginine transport, and NO synthesis (Casanello et al., 2009). However, there is no information addressing whether L-arginine and hCAT-1 expression are altered in the fetal endothelium from PGMO pregnancies. Interestingly, increased L-arginine level and reduced L-citrulline and nitrite/nitrate levels (NOx, an index of NO bioavailability) is reported in the serum from subjects with obesity (Giam et al., 2016; Gruber et al., 2008). It is also reported that after weight reduction by bariatric surgery there is a decrease in the plasma level of L-arginine and increase in the NOx level, suggesting that overweight reduced the transport of L-arginine and NO production (Sledzinski et al., 2010). On the other hand, obese mice show reduced CAT-1 expression, and the overexpression of CAT-1 in the endothelium resulted in preventing obesity-reduced NOx (Rajapakse et al., 2014). The obesity-induced hypertension was also reduced in these mice (Rajapakse et al., 2015, 2014). Therefore, the endothelial dysfunction in the fetoplacental vasculature of PGMO may involve altered CAT-1 expression and L-arginine transport.. 28.
(31) Vascular insulin resistance in PGMO Obesity also associates with systemic insulin resistance, a condition related to endothelial dysfunction and chronic cardiometabolic disorders (Flamment et al., 2012; Georgescu et al., 2011; Mather et al., 2013; Muniyappa and Sowers, 2013). Insulin resistance characterizes by low sensitivity and responsiveness to insulin in target tissues, including the vasculature (Kim et al., 2006; M. Breen and Giacca, 2011; Savage et al., 2005). Insulin resistance becomes more important in the vasculature since the endothelial insulin resistance contributes to induce endothelial dysfunction (Duncan et al., 2008). One of the most relevant effects of insulin in the control of vascular tone is the stimulation of NO synthesis by the endothelium (Muniyappa et al., 2007; Zeng and Quon, 1996). The biological effects of insulin in the vasculature starts with the activation of the insulin receptor (IR) in the endothelium. The activation of this tyrosine kinase type receptor results in a parallel and balanced activation of two major signaling pathways: the phosphoinositide 3kinase (PI3K)/Akt pathway, known as the metabolic branch and has been described to induce vasodilation; and the Ras/mitogen-activated protein kinases (MAPK) pathway, known as the mitogenic branch and has been described to induce vasoconstriction. The activation of both branches promotes cardiovascular and endothelial growth, cell metabolism, and a healthy vascular function (D’Oria et al., 2017; Muniyappa and Sowers, 2013). The state of insulin resistance is characterized by impaired metabolic branch resulting in excessive activation of the mitogenic branch, leading to impaired insulin-induced vasodilation, thus, contributing to the endothelial dysfunction (Clark et al., 2003; D’Oria et al., 2017; Mather et al., 2013). The activation of the metabolic branch results in vasodilation via increased NO production (Muniyappa et al., 2007). The activation of this pathway begins with the IR 29.
(32) activation and subsequent activation of the isoform 1 of the insulin receptor substrate 1 (IRS1) through phosphorylation of tyrosine residues. The phosphorylation of IRS1 exposes Src homology 2 (Sh2) domain-binding motifs that bind to Sh2-containing proteins such as PI3K. The docking of PI3K to IRS1 activates the protein which produces phosphatidylinositol 3,4,5-trisphosphate (PIP3) inducing the phosphorylation and activation of phosphoinositide-dependent kinase-1 (PDK1). Subsequently, PDK1 phosphorylates the serine residue 473 of Akt which, after being recruited by dimerized eNOS, phosphorylates the enzyme in serine 1177 and leads to the increased production of NO (Manrique et al., 2014; Muniyappa et al., 2007). In this context, the insulin resistance occurs by the phosphorylation of IRS1 in serine residues, thus reducing the affinity of the protein for the IR and the scaffolding proteins and leading to the inhibition of insulin signaling (Muniyappa et al., 2007). Patients with obesity show vascular insulin resistance, which is evidenced by lower insulin-induced vasodilation (Farb et al., 2016; Georgescu et al., 2011). Insulin resistance impaired the metabolic branch, in several tissues in obese patients, such as adipose tissue, liver, or skeletal muscle. Therefore, we speculate that the reduced insulin-induced vasodilation in the vasculature from obese patients is due to its associated blunted metabolic branch (Huang, 2009; Huang et al., 2018; Mather et al., 2013). There is evidence supporting this idea from studies in animal models showing that the vasculature from obese mice show lower insulin-induced activation of IRS1, Akt, and eNOS (Naruse et al., 2006; Symons et al., 2009). It is also reported that newborns (Catalano et al., 2009), children and adults (Mingrone et al., 2008; O’Reilly and Reynolds, 2013; Tan et al., 2015) born to mothers with PGMO also 30.
(33) showed systemic insulin resistance. In a study of the transcriptome of trophoblast cells from the first trimester of pregnancy in mothers with PGMO, the insulin-induced gene expression was lower compared with cells from normal pregnancies (Lassance et al., 2015). These findings suggest lower insulin sensitivity in these cells from obese mothers. In another set of studies the fetoplacental vasculature from mothers with obesity also shows signs of insulin resistance since a genetic profile associated to insulin resistance in umbilical cords from PGMO mothers was found (Thakali et al., 2014). Additionally, a null response to insulin was reported by umbilical veins from mother that started pregnancy with normal weight and ended with obesity (Pardo et al., 2015). Thus, although there are no reports directly addressing it, the occurrence of insulin resistance in the fetoplacental vasculature from PGMO mothers is strongly suggested. Endoplasmic Reticulum Stress Several factors in obesity contribute to the dysfunction of metabolic organs, including the vasculature, such as systemic proinflammatory state, increased concentration of circulating free fatty acids in blood, or hyperlipidemia (Hardy et al., 2012; Noakes, 2018). Interestingly, all these factors are involved in the induction of ER stress (Alhusaini et al., 2010; Boden et al., 2014; Esser et al., 2014; Mandal et al., 2017; Villalobos-Labra et al., 2018b) and obesity associated-metabolic dysfunction (Table 1) (Villalobos-Labra et al., 2018b; Yilmaz, 2017). Indeed, ER stress shows a strong relationship with insulin resistance and endothelial dysfunction in obesity (Table 2), and with other metabolic syndromeassociated diseases (Battson et al., 2017; Cnop et al., 2012; Flamment et al., 2012). Thus, ER stress is proposed as a key factor in the mechanism of obesity-induced insulin resistance and endothelial dysfunction (Cnop et al., 2012; Flamment et al., 2012; Yilmaz, 2017). However,. 31.
(34) the cellular mechanisms linking ER stress with endothelial dysfunction and vascular insulin resistance in PGMO are not described. Hence, this thesis focused on the understanding of the effect of ER stress on endothelial dysfunction and insulin resistance in the fetoplacental vasculature from PGMO mothers.. 32.
(35) Table 1. UPR activation in metabolic tissues of patients with obesity Protein abundance. mRNA level. Reference. Increased. PDI CRT CNX P~JNK1. XBP1s. Boden et al., 2008. Antecubital vein EC. Increased. PGMO. OAT. Increased. PERK IRE1α ATF6 IRE1α BiP. Obesity. Adipose tissue. Increased. Obesity. Abdominal SAT. Obesity. Pathology. Tissue/cell. Effect. Obesity. SAT. Obesity. Kaplon et al., 2013. XBP1s. Liong and Lappas, 2015. P~eIF2. XBP1s ATF6. Sharma et al., 2008. Increased. P~eIF2 BiP P~JNK1. XBP1s. Gregor et al., 2009. Abdominal SAT. Increased. IRE1α BiP. ATF6. Alhusaini et al., 2010. Obesity. SAT. Increased. CHOP P~JNK1. –. Díaz-Ruiz et al., 2015. PGMO. Skeletal muscle. Increased. IRE1α BiP. XBP1s. Liong and Lappas, 2016. PGMO. Placenta. Increased. P~eIF2. XBP1s. Yung et al., 2016. Severe obesity a. VAT, SAT. Increased. BiP. XBP1s. Vendrell et al., 2010. EC, endothelial cells; SAT, subcutaneous adipose tissue; OAT, omental adipose tissue; VAT, visceral adipose tissue; P~PERK, phosphorylated protein kinase RNA-like endoplasmic reticulum kinase; TRB3, tribbles-like protein 3; PDI, protein disulfide isomerase A3; CRT, calreticulin; CNX, calnexin; P~JNK1, phosphorylated c-jun N-terminal kinase 1; XBP1s, spliced X-box binding protein 1 mRNA; IRE1α, inositol-requiring enzyme 1α; BiP, binding immunoglobulin protein; P~eIF2, phosphorylated eukaryotic translation initiator factor 2; ATF6, activating transcription factor 6; CHOP, CCAAT-enhancer-binding protein homologous protein. –, not reported. a Severe obesity refers to BMI ≥ 40 kg/m2.. 33.
(36) ER stress and the unfolded protein response ER is an organelle responsible for the synthesis and processing of secretory and membrane proteins, Ca2+ storage and lipid biosynthesis (Cnop et al., 2012; Flamment et al., 2012). The ER homeostasis is maintained by a variety of modulatory mechanisms to ensure cell survival, proliferation, and growth, among others. A disturbance of this state results in the accumulation of misfolded proteins that leads to ER stress and the unfolded protein response (UPR). The latter is intended to restore the homeostasis of the endoplasmic reticulum and results in the alteration of the cellular metabolism. UPR is the starting point for activation of three canonical ER stress transducers at the ER membrane, i.e. the protein kinase RNA-like endoplasmic reticulum kinase (PERK), inositol-requiring enzyme 1-alpha (IRE1α), and activating transcription factor 6 (ATF6) (Ghemrawi et al., 2018; Hetz et al., 2015; Mukherjee et al., 2015) (Figure 1). One major modulator described to UPR activation after ER stress is the ER chaperone binding immunoglobulin protein (BiP) (Flamment et al., 2012). During unstressed conditions, PERK, IRE1α and ATF6 are inactivated by binding to BiP at the lumen side of the ER. Under ER stress, BiP is displaced from the transducers to bind with misfolded luminal proteins, which releases PERK, IRE1α and ATF6 and leads to their activation (Cnop et al., 2012; Flamment et al., 2012). PERK is a tyrosine kinase-like protein which is activated by phosphorylation in threonine 981. This kinase phosphorylates the alpha subunits of the eukaryotic initiation factor 2 (eIF2α) in serine 51, leading to its inactivation and thus to a rapid decrease of cap-dependent translation, causing the attenuation of the global protein synthesis. However, that alteration results in the selective translation of specific proteins that are translated by other mechanisms. One of them is cap-independent, which do not require the eIF2-protein complex because they. 34.
(37) have internal ribosome entry sites (IRESs) (Komar and Hatzoglou, 2011). Other mechanism is for proteins containing more than one upstream open reading frame in their mRNA sequence (Chambers and Marciniak, 2014; Kilberg et al., 2009), as for the activating transcriptor factor 4 (ATF4). ATF4 is a key transcription factor for PERK-modulated gene expression, which triggers the transcription by binding to CCAAT-enhancer binding proteinactivating transcription factor response elements (CARE). IRE1α is activated by trans-autophosphorylation and shows kinase and endoribonuclease activity catalyzing the processing of X-box binding protein 1 (XBP1) mRNA cleaving a 26nucleotide intron and shifting the reading frame to translate the processed form of the transcription factor XBP1 (XBP1s). Additionally, IRE1α degrades other RNA targets by a process known as regulated IRE1-dependent decay (RIDD). The cytosolic domain of IRE1α binds to tumor necrosis factor receptor-associated factor 2 (TRAF2), activating the c-jun Nterminal kinase (JNK) pathway through IRE1α kinase domain. Meanwhile, ATF6 translocates to the Golgi where is cleaved. The cleaved-off cytoplasmic domain acts as a transcription factor leading to the suppression and expression of several genes. Through phenomena such as expression of chaperones, foldases, and proteins involved in ERassociated degradation (ERAD) machinery, redox metabolism, autophagy, and apoptosis (e.g. CCAAT-enhancer-binding protein homologous protein (CHOP)), among others, the UPR reduces the unfolded protein load and increases the size and the folding capacity of ER to restore its homeostasis (Cnop et al., 2012; Dufey et al., 2014; Ghemrawi et al., 2018).. 35.
(38) Figure 1. Endoplasmic reticulum stress and unfolded protein response. Endoplasmic reticulum (ER) stress leads to the activation of the unfolded protein response through the activation of protein kinase RNA-like endoplasmic reticulum kinase (PERK), inositolrequiring enzyme 1-alpha (IRE1α) and activating transcription factor 6 (ATF6). PERK phosphorylates the α subunit of eukaryotic translation initiator factor 2 (eIF2), attenuating the general translation and enhancing the expression of activating transcription factor 4 (ATF4), CCAAT-enhancer-binding protein homologous protein (CHOP) and ultimately tribbles-like protein 3 (TRB3), which alters insulin signaling by inhibiting Akt. IRE1α activates c-jun N-terminal kinase (JNK) by phosphorylation, which reduces insulin signaling by phosphorylating insulin receptor substrate 1 (IRS1) in serine residues. IRE1α also produces an unconventional splicing of the unspliced X-box binding protein 1 (uXBP1) mRNA, shifting the reading frame to translate a more stable protein known as spliced XBP1 (sXBP1). Besides, IRE1α contributes to the attenuation of the general translation by the regulated IRE1-dependent decay (RIDD) of mRNA. ATF6 migrates to the Golgi where is cleaved, releasing a fraction that works as transcription factor. ATF4, sXBP1 and the cleaved fraction of ATF6 work as transcription factors addressed to modulate genes involved in ER metabolism, ER-associated degradation (ERAD), redox metabolism, autophagy and apoptosis, among others, leading to restore the ER homeostasis or, ultimately, cell death.. 36.
(39) Association of ER stress with insulin resistance and endothelial dysfunction Several mechanisms linking ER stress with insulin resistance are described in obesity. The most studied are the IRE1α-dependent activation of JNK and the activation of PERK/eIF2/ATF4 signaling (Figure 1). JNK phosphorylates IRS1 in serine residues, inhibiting the enzyme and contributing to the obesity associated-systemic insulin resistance (Flamment et al., 2012; Hirosumi et al., 2002; Ozcan et al., 2004). It is also reported that JNK is involved in reducing the vasodilation in response to insulin of visceral arterioles from obese subjects (Farb et al., 2016). The activation of PERK/eIF2/ATF4 signaling results from ATF4 inducing the expression of CHOP, a transcription factor that together with ATF4 leads to the expression of tribbles-like protein 3 (TRB3) (Ohoka et al., 2005). TRB3 is a pseudokinase that inhibits Akt activity promoting insulin resistance (Du et al., 2003; Flamment et al., 2012; Koh et al., 2013; Marinho et al., 2015; Ozcan et al., 2013). TRB3 expression is increased in the blood (Nourbakhsh et al., 2017) and skeletal muscle (Koh et al., 2013) from obese subjects, as well as in other metabolic tissues affected by obesity in mice (Du et al., 2003; Lima et al., 2009; Liu et al., 2010; Ozcan et al., 2013). Thus, JNK and TRB3 are factors involved in the obesity-induced insulin resistance and both are potential candidates in the development of insulin resistance in the fetoplacental vasculature from PGMO. ER stress is also related to the development of endothelial dysfunction (Battson et al., 2017) (Table 2). The treatment of mouse coronary artery endothelial cells with tunicamycin, which induces ER stress by the inhibition of N-glycosylation of proteins (Mahoney and Duksin, 1980), reduced the levels of mRNA, protein, serine 1177 phosphorylation of eNOS and nitrite. Co-incubation of these cells with tauroursodeoxycholic acid (TUDCA), a bile. 37.
(40) acid that acts as a chaperone reducing ER stress (Kraskiewicz and Fitzgerald, 2012), blocked tunicamycin-induced ER stress (Galán et al., 2014). Furthermore, HUVECs treated with tunicamycin showed reduced serine 1177 phosphorylation of eNOS and null production of NO in response to a calcium ionophore (Murugan et al., 2015), as described in mouse aortic endothelial cells (Cheang et al., 2014). Thus, ER stress has been linked with lower eNOS activity in endothelial cells. On the other hand, ER stress is proposed to affect endothelial function by affecting the L-arginine transport. CAT-1 expression is shown to increase following the activation of the PERK/eIF2/ATF4 signaling pathway (Kilberg et al., 2009). CAT-1 expression is increased after eIF2α phosphorylation (Fernandez et al., 2002b) since its gene contains an IRES region (Fernandez et al., 2002a). Moreover, the sequence of hCAT-1 has a CARE region whose expression is regulated by ATF4 (Kilberg et al., 2009; Lopez et al., 2007; Majumder et al., 2009). Thus, the expression of CAT-1 depends on the levels of phosphorylated eIF2α and ATF4 (Huang et al., 2010; Lopez et al., 2007) suggesting a key role of the PERK/eIF2/ATF4 signaling as an inductor of L-arginine transport. Since the structural interaction (Li et al., 2005) and the L-arginine transport by CAT-1 is crucial to eNOS activity, and because the ER stress reduced the expression and activity of eNOS, it is likely that the ER stress in the endothelium results in endothelial dysfunction. Therefore, the occurrence of endothelial dysfunction could be due to ER stress in the fetoplacental vasculature from PGMO mothers.. 38.
Figure


+7


Documento similar
To evaluate quantitatively, the cytotoxicity of graphene oxide and reduced graphene oxide in a dose-dependent manner in control and hypertrophic cardiac cells.. To synthesize
Expression Pattern of Nitric Oxide Synthase during Development of the Marine Gastropod Mollusc, Crepidula fornicata.. Marta Truchado-Garcia 1,2 , Filomena Caccavale 3 , Cristina
(E) Active catalytic domain of PKD1 (aa 557–918), presenting phosphorylated Ser 916 in its PDZ-ligand (ERVpSIL), or two shorter C-terminal fragments containing the
To reinforce the role of SKF in nuclear accumulation of Nrf2 in response to APAP, we treated wild-type hepatocytes with the Figure 3 Effect of PTP1B deficiency in stress and
SCs are not depleted in the bulges of TR-deficient mice The skin phenotype of mice with defective thyroid hormone signal- ing (reduced response to proliferative stimuli, retarded
This study analyzes whether the release of nitric oxide (NO) and thromboxane A 2 (TXA 2 ) depends on the time lapsed since gonadal function is lost, and their correlation with
This study supports the relationship between 25(OH)D serum levels and the response of AK to MAL-PDT: VD deficient levels were found to be significantly associated to a lack of
Even though the 1920s offered new employment opportunities in industries previously closed to women, often the women who took these jobs found themselves exploited.. No matter
