Performance of the ATLAS muon trigger in pp collisions at root s=8 TeV
33
0
0
Texto completo
(2) Eur. Phys. J. C manuscript No. (will be inserted by the editor). Performance of the ATLAS muon trigger in pp collisions √ at s = 8 TeV The ATLAS Collaboration 1 Address(es). of author(s) should be given. the date of receipt and acceptance should be inserted later. Abstract The performance of the ATLAS muon trigger system is evaluated with proton–proton collision data collected in 2012 at the Large Hadron Collider at a centre-of-mass energy of 8 TeV. It is primarily evaluated using events containing a pair of muons from the decay of Z bosons. The efficiency of the single-muon trigger is measured for muons with transverse momentum 25 < pT < 100 GeV, with a statistical uncertainty of less than 0.01 % and a systematic uncertainty of 0.6 %. The pT range for efficiency determination is extended by using muons from decays of J/ψ mesons, W bosons, and top quarks. The muon trigger shows highly uniform and stable performance. The performance is compared to the prediction of a detailed simulation.. 1 Introduction The presence of prompt muons in the final state is a distinctive signature for many physics processes studied in collisions of high energy protons at the LHC. These studies, which led to the discovery of the Higgs boson [1, 2], include measurements of its properties, searches for new phenomena, as well as measurements of Standard Model processes, such as the production of electroweak bosons and top quarks. Therefore, a high-performance muon trigger is essential. In parallel, a good simulation of trigger performance is necessary. There are many challenges in designing and implementing triggers which select pp interactions with muons in the final state with high efficiency and low transverse momentum, pT , thresholds in the presence of high background conditions. The ATLAS design deploys a three-level, multi-pronged strategy with, 1. custom trigger electronics at Level-1,. 2. dedicated fast algorithms to reconstruct muons and estimate their parameters at Level-2, 3. novel techniques to retain high efficiency at the eventfilter while utilising offline tracking algorithms. The Level-2 and event-filter together are called the High Level Trigger. In order to address a wide variety of physics topics, ATLAS has developed a suite of triggers designed to select muons. The single-muon trigger with pT threshold of 24 GeV is used in many physics analyses. In addition, muon triggers in combination with electrons, jets and missing transverse momentum, as well as moderate-pT multi-muon triggers, increase sensitivity for various physics topics which benefit from a lower pT threshold. For the B-physics program, various low-pT multi-muon triggers are used with a special configuration that allows a high efficiency also for nonprompt muons 1 . The ATLAS experiment collected pp collision data in 2012 at a centre-of-mass energy of 8 TeV with a maximum instantaneous luminosity of 7.7 × 1033 cm−2 s−1 . The number of interactions occurring in the same bunch crossing (called pile-up interactions) was about 25 on average. In this paper, the performance of the ATLAS muon trigger is evaluated, primarily using samples containing muon pairs from Z-boson decays. The performance of the low-pT muon trigger is evaluated with samples containing a pair of muons from the decay of J/ψ mesons. The performance for high-pT muons is evaluated using events containing top-quarks2 or W bosons, where a W boson decays into a muon and neutrino. 1 Non-prompt. muons are muons which originate from the decay of a secondary particle rather than coming directly from the primary pp interaction. 2 Unless otherwise stated CP conjugate states are always implied..
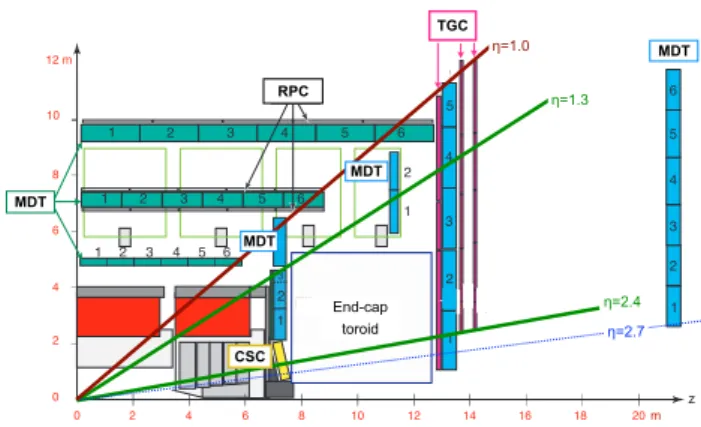
(3) 2. 2 Muon trigger 2.1 ATLAS detector The ATLAS detector is a multi-purpose particle physics apparatus with a forward-backward symmetric cylindrical geometry and near 4π coverage in solid angle.3 The detector consists of four major sub-systems: the inner detector, electromagnetic calorimeter, hadronic calorimeter and muon spectrometer. A detailed description of the ATLAS detector can be found in Ref. [3]. The inner detector measures tracks up to |η| = 2.5 in an axial magnetic field of 2 T using three types of subdetectors: a silicon pixel detector closest to the interaction point, a semiconductor tracker surrounding the pixel detector, and a transition radiation straw tube tracker covering |η| < 2.0 as the outermost part of the inner detector. The calorimeter system covers the pseudorapidity range |η| < 4.9 and encloses the inner detector. The high-granularity liquid-argon electromagnetic sampling calorimeter is divided into one barrel (|η| < 1.475) and two endcap components (1.375 < |η| < 3.2). The hadronic calorimeter is placed directly outside the electromagnetic calorimeter. A steel/scintillator-tile calorimeter provides hadronic coverage in the range |η| < 1.7. The endcap and forward regions, spanning 1.5 < |η| < 4.9, are instrumented with liquid-argon calorimeters. The calorimeters are then surrounded by the muon spectrometer.. TGCsectors Large (odd numbered) y. 12 m. η=1.0. EML. RPC RPCs 1. 2. 3. 4. 5. 6 EEL MDT. 8. MDTBML. 1. 2. 3. 4. 6. 1. BIL. 2. 3. 4. 5. 6. 5. 6. η=1.3. 5. 10. BOL. EOL MDT. 6. 5 4. 2 1. 4 3. 3. EIL4 MDT 3. 4. 2 1. 2. CSC. 2. 2 EIL. η=2.4. TGCs. End-cap End-cap magnet toroid. CSC. 0. z 0. 2. 4. 6. 8. 10. 12. 14. 16. 18. 20 m. Fig. 1 A schematic picture showing a quarter-section of the. muon system in a plane containing the beam axis, with monitored drift tube (MDT) and cathode strip (CSC) chambers for momentum determination and resistive plate (RPC) and thin gap (TGC) chambers for triggering. In the region 2.0 < |η| < 2.7, two layers of MDT chambers in combination with one layer of cathode strip chambers (CSCs) are used. Muons are independently measured in the inner detector and in the muon spectrometer. Three layers of resistive plate chambers (RPCs) in the barrel region (|η| < 1.05), and three layers of thin gap chambers (TGCs) in the endcap regions (1.05 < |η| < 2.4) provide the Level-1 muon trigger.. 2.2 Muon spectrometer The muon spectrometer is based on three large air-core superconducting toroidal magnet systems (two endcaps and one barrel) providing an average magnetic field of approximately 0.5 T. Figure 1 shows a quarter-section of the muon system in a plane containing the beam axis. In the central region, the detectors comprise a barrel that is arranged in three concentric cylindrical shells around the beam axis. In the endcap region, muon chambers form large wheels, perpendicular to the z-axis. Several detector technologies are utilised to provide both precision tracking and triggering. The deflection of the muon trajectory in the magnetic field is detected using hits in three layers of precision monitored drift tube (MDT) chambers for |η| < 2. 3 ATLAS. uses a right-handed coordinate system with its origin at the nominal interaction point (IP) in the centre of the detector and the z -axis along the beam pipe. The x-axis points from the IP to the centre of the LHC ring, and the y -axis points upward. Cylindrical coordinates (r, φ) are used in the transverse plane, φ being the azimuthal angle around the beam pipe. The pseudorapidity is defined in terms of the polar angle θ as η = − ln tan(θ/2).. 1. η=2.7. 1. 2.3 Level-1 muon trigger Muons are identified at Level-1 by the spatial and temporal coincidence of hits either in the RPCs or TGCs pointing to the beam interaction region [3,4]. The Level1 triggers generated by hits in the RPC require a coincidence of hits in the three layers for the highest three pT thresholds, and a coincidence of hits in two of the three layers for the rest of thresholds. The Level-1 triggers generated by hits in the TGC require a coincidence of hits in the three layers, except for limited areas in the lowest threshold. The degree of deviation from the hit pattern expected for a muon with infinite momentum is used to estimate the pT of the muon with six possible thresholds. The number of muon candidates passing each threshold is used in the conditions for the global Level-1 trigger. Following a global trigger, the pT thresholds and the corresponding detector regions, region of interest (RoIs), are then sent to the Level-2 and event-filter for further consideration [3, 4]. The typical dimensions of.
(4) 3. the RoIs are 0.1 × 0.1 (0.03 × 0.03) in ∆η × ∆φ in the RPCs (TGCs) [3]. The geometric coverage of the Level-1 trigger is about 99 % in the endcap regions and about 80 % in the barrel region. The limited geometric coverage in the barrel region is due to gaps at around η = 0 (to provide space for services of the inner detector and calorimeters), the feet and rib support structures of the ATLAS detector and two small elevator shafts in the bottom part of the spectrometer.. muon candidate after subtracting the pT of the muon itself (Σ∆R<∆Rcut ptrk T ). The full-scan procedure is used in the event-filter to find additional muons that are not found by the RoI-based method. In the full-scan, muon candidates are first sought in the whole of the muon detectors, and then inner detector tracks are reconstructed in the whole of the inner detectors. Combined pairs of these inner detector and muon detector tracks form muon candidates called event-filter full-scan-muons.. 2.4 Level-2 muon trigger 2.6 Trigger selection criteria The RoI provided by Level-1 enables Level-2 to select the region of the muon detector in which the interesting features reside, therefore reducing the amount of data to be transferred and processed [4]. At Level-2, a track is constructed by adding the data from the MDT chambers to get a more precise estimate of the track parameters, leading to the Level-2 stand-alone-muon [5]. To achieve the needed resolution in sufficiently short time, the pT of the Level-2 stand-alone-muon is reconstructed with simple parameterised functions. Then, the Level2 stand-alone-muon is combined with a track found in the inner detector [5]. The closest inner detector track in the η and φ planes is selected as the best matching track. The pT value is refined by taking the weighted average between that of the Level-2 stand-alone-muon and of the inner detector track, leading to the so called Level-2 combined-muon.. 2.5 Event-filter muon trigger Muons in the event-filter are found by two different procedures. The first focuses on RoIs defined by the Level-1 and Level-2 steps described above and is referred to as the RoI-based method. The second procedure searches the full detector without using the information from the previous levels and is referred to as the full-scan method. In the RoI-based method, muon candidates are first formed by using the muon detectors (called event-filter stand-alone-muons), and are subsequently combined with inner detector tracks leading to event-filter combinedmuons. If no combined-muon is formed, muon candidates are searched for by extrapolating inner detector tracks to the muon detectors. If there are corresponding track segments, combined-muons are formed. Additionally, the degree of isolation for the combinedmuon is quantified by summing the pT of inner detector tracks with ptrk > 1 GeV found in a cone of T p ∆R = (∆φ)2 + (∆η)2 < ∆Rcut , centred around the. The trigger system is configured to use a large set of selection criteria for each event. Each criterion consists of sequential selections at Level-1, Level-2 and the eventfilter, and is referred to as trigger in this paper for simplicity. An event has to satisfy at least one of the triggers in order to be recorded. Table 1 shows the Level-1 thresholds and the muon triggers discussed in this paper. For all trigger levels, the naming scheme typically follows a convention whereby the number that follows ”mu” denotes the transverse momentum threshold and the letters, or combination of letters, characterize the muon type (isolated (i), stand alone (SA), found by full scan (FS)) and/or its origin. The Level-1 thresholds were optimised to give an efficiency at the designated threshold that is typically 95 % of the maximum efficiency achieved well above the threshold. The triggers described in Table 1 were designed to be as inclusive as possible. The mu24i trigger is designed to collect isolated muons with pT > 25 GeV with a loose isolation criterion of Σ∆R<0.2 ptrk T /pT < 0.12. The isolation criterion was chosen to retain nearly 100% efficiency for well isolated muons from the decays of Z-bosons while rejecting slightly over half of the muons from heavy flavor, pion and kaon decays. The mu36 trigger is designed to collect muons with large pT without making an isolation requirement. The mu40 SA barrel trigger is designed to recover possible inefficiency due to muon spectrometer and inner detector combination at large pT , and the decision is based only on muon spectrometer reconstruction. It was active only in the barrel region due to its high rate in the endcaps. The mu24i, mu36 and mu40 SA barrel triggers were used without prescale4 for the 2012 data taking. 4 The. term prescale means that only one in N events passing the trigger is accepted at that trigger level, where N is an integer definite number called the prescale factor. At Level-.
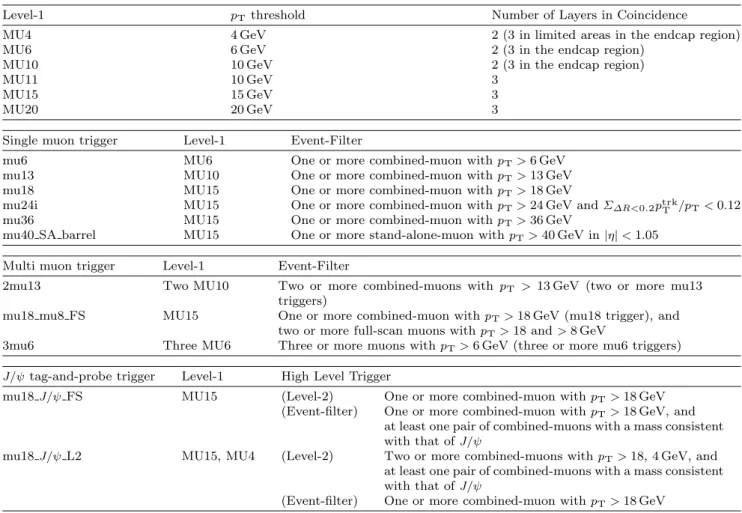
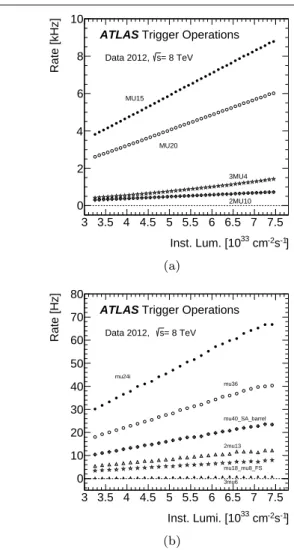
(5) 4 Table 1 Level-1 pT thresholds and muon triggers. The sequence shows the requirements at Level-1, in the event-filter or. at higher level trigger which then includes Level-2. The requirements at Level-2 are omitted for the single- and multi-muon triggers, as they are looser than those in the event-filter. The applied pT and isolation requirements are also shown. Level-1. pT threshold. Number of Layers in Coincidence. MU4 MU6 MU10 MU11 MU15 MU20. 4 GeV 6 GeV 10 GeV 10 GeV 15 GeV 20 GeV. 2 (3 in limited areas in the endcap region) 2 (3 in the endcap region) 2 (3 in the endcap region) 3 3 3. Single muon trigger. Level-1. Event-Filter. mu6 mu13 mu18 mu24i mu36 mu40 SA barrel. MU6 MU10 MU15 MU15 MU15 MU15. One One One One One One. or or or or or or. more more more more more more. combined-muon with pT > 6 GeV combined-muon with pT > 13 GeV combined-muon with pT > 18 GeV combined-muon with pT > 24 GeV and Σ∆R<0.2 ptrk T /pT < 0.12 combined-muon with pT > 36 GeV stand-alone-muon with pT > 40 GeV in |η| < 1.05. Multi muon trigger. Level-1. Event-Filter. 2mu13. Two MU10. mu18 mu8 FS. MU15. 3mu6. Three MU6. Two or more combined-muons with pT > 13 GeV (two or more mu13 triggers) One or more combined-muon with pT > 18 GeV (mu18 trigger), and two or more full-scan muons with pT > 18 and > 8 GeV Three or more muons with pT > 6 GeV (three or more mu6 triggers). J/ψ tag-and-probe trigger. Level-1. High Level Trigger. mu18 J/ψ FS. MU15. (Level-2) (Event-filter). mu18 J/ψ L2. MU15, MU4. (Level-2). (Event-filter). The 2mu13 trigger requires two or more muon candidates, each of which passes the single-muon trigger mu13. The mu18 mu8 FS trigger requires at least one muon candidate which passes the single-muon trigger mu18, and subsequently employs the full-scan algorithm at the event-filter to find two or more muon candidates with pT > 18 and pT > 8 GeV for leading and subleading muons, respectively. The full-scan trigger processes the entire detector and utilises more computing resources than the triggers which process only data in one RoI. Computing resources, not bandwidth, is the limiting factor for these triggers. The leading muon was required to have a pT of at least 18 GeV in the fullscan dimuon triggers for this reason. The 3mu6 trigger requires three or more muon candidates, each of which passes the single-muon trigger mu6. The 2mu13, mu18 mu8 FS and 3mu6 triggers were used without 1 every Nth event is accepted. At the high level trigger a random number generator is utilised such that one out of every N events is accepted.. One or more combined-muon with pT > 18 GeV One or more combined-muon with pT > 18 GeV, and at least one pair of combined-muons with a mass consistent with that of J/ψ Two or more combined-muons with pT > 18, 4 GeV, and at least one pair of combined-muons with a mass consistent with that of J/ψ One or more combined-muon with pT > 18 GeV. prescale for the 2012 data taking. The dimuon triggers used to select J/ψ decays will be discussed in more detail in section 7.. 2.7 Operation in the 2012 data taking The typical maximum Level-1 rate was 70 kHz. The event acceptance was reduced at the event-filter which had an output rate of 700 Hz on average (with peaks of about 1 kHz). Of these rates, the single isolated muon trigger mu24i was fired at about 8.5 kHz at Level-1 and at about 65 Hz at the event-filter for an instantaneous luminosity of 7×1033 cm−2 s−1 . Figure 2 shows the rates of the single- and multi-muon triggers as a function of the instantaneous luminosity, separately for the Level1 and for the event-filter. They are well described by a linear fit with an approximately zero intercept. This indicates a negligible contribution from effects not related to pp collisions. Typically the trigger rates were reduced.
(6) Rate [kHz]. 5. 3 Data samples and event selection. 10 ATLAS Trigger Operations 8 6. Several methods are used to measure the muon trigger performance. This section describes the selection requirements used to define the samples needed for the various methods.. Data 2012, s= 8 TeV. MU15. 4 MU20. 3.1 Methods to measure trigger performance. 2. 3MU4. 2MU10. 0 3 3.5 4 4.5 5 5.5 6 6.5 7 7.5 Inst. Lum. [1033 cm-2s-1]. Rate [Hz]. (a) 80 70 60. ATLAS Trigger Operations Data 2012,. s= 8 TeV. 50 mu24i mu36. 40 30. mu40_SA_barrel. 20 2mu13. 10 mu18_mu8_FS. 0. 3mu6. 3 3.5 4 4.5 5 5.5 6 6.5 7 7.5 Inst. Lumi. [1033 cm-2s-1]. (b) Fig. 2 Trigger rates as a function of instantaneous luminosity. (a) for selected muon triggers at Level-1 and (b) for selected single- and multi-muon triggers at the event-filter as denoted in the legend (see Table 1 for details).. by one to two orders of magnitude at Level-2 and by a factor of a few at the event-filter for the single and dimuon triggers. For example the rates were reduced by a factor of 28 at Level-2 (with respect to Level-1) and by a factor of 4.6 at the event-filter (with respect to Level-2) for the mu24i trigger. For the 2mu13 trigger, the rates were reduced by a factor of 71 at Level-2 and by a factor of 1.2 at the event-filter. During data taking, the performance of the muon trigger was monitored in two stages. For quick online checks during data taking, the coverage in η–φ space and the distributions of some kinematic variables were produced by the high level trigger algorithms. A more detailed analysis was performed by calculating efficiencies of triggers during the reconstruction stage of the data processing.. The tag-and-probe method relies on a pair of muons. If one muon has caused the trigger to record the event (called the tag-muon), the other muon serves as a probe (called the probe-muon) to measure the trigger performance without any bias. This method was applied to dimuon decays of Z-boson and J/ψ meson candidates. Alternatively, muons contained in events that were recorded by triggers other than the muon trigger can be used as an unbiased sample to evaluate the efficiency of triggering on muons. This method was applied to events with muons from W -boson decays, either from top-quark or W + jets production. A trigger based on the missing transverse momentum, as measured with the calorimeter, was used to collect such samples. Among these four samples, the tag-and-probe method using Z decays provides the most precise determination of the efficiency over a wide range of muon pT (10 . pT . 100 GeV). The tag-and-probe method using J/ψ decays provides a coverage for lower pT of the muon (pT . 10 GeV). Muons from Z decays are not frequently found to have pT & 100 GeV. Events with muons from top-quark and W + jets production provide supplemental coverage at very high pT (pT & 100 GeV). The muons from top-quark decays tend to have a slightly larger pT than those from the Z decays due to the larger mass of the top-quark. In the W + jet events, the W may recoil off of one or more high pT jets. These higher pT W -bosons can then decay into muons with very high pT . In addition, top-quark events and W +jet events offer important cross-checks in the overlapping pT region that is also covered by the tagand-probe method using Z decays.. 3.2 Data and Monte Carlo samples Data were considered if recorded under stable beam conditions and with all relevant sub-detector systems fully operational. The trigger performance observed in the data is compared with the ATLAS Monte Carlo (MC) simulation, which is the same as used for physics analysis. The generated samples were then processed through a simulation of the ATLAS detector based on Geant4 [6,.
(7) 6. 7]. The environmental backgrounds due to radiation were not simulated. The simulated events are overlaid with additional minimum-bias events generated with Pythia 8 [8] to account for the effect of pile-up interactions. A sample of Z-boson production was generated using Powheg-box [9] interfaced to Pythia 8 [10]. A sample of the production of J/ψ mesons decaying to muon pairs was generated using Pythia 8, requiring at least two muons in the final state having pT > 15 and 2.5 GeV. Similarly to the Z-boson production sample, a sample of top and antitop quark pair (tt̄) events was generated using Powheg-box interfaced to Pythia 8. Samples of single top-quark events were generated using AcerMC [11] interfaced to Pythia 8 for the tchannel production, and using Powheg-box interfaced to Pythia 8 for the s- and W t-channel production. Samples of W boson production were generated using Alpgen [12] interfaced to Pythia 8. Samples of dijet events are used for background estimation, and were generated using Pythia 8.. 3.3 Offline reconstruction The offline reconstructed muons are obtained by matching tracks found in the muon spectrometer with those in the inner detector [13]. Muons are required to pass various cuts to ensure a high quality inner detector track and to be in a fiducial region of |η| < 2.5. The muon momentum is calibrated by comparing the dimuon mass of Z boson candidates measured in data and MC [13]. The identification and reconstruction of the electrons, jets, jets containing B-hadrons (called b-jets), miss and missing transverse momentum (ET ) are necessary for the efficiency measurement with top-quark and W -boson candidates. Electron candidates [14, 15] are required to satisfy el ET > 25 GeV and |η el | < 2.47 excluding 1.37 < |η el | < el 1.52, where ET is the transverse energy, and η el is the pseudorapidity of the electromagnetic cluster of energy deposits in the calorimeter. Candidates are required to be isolated by means of calorimeter- and track-based isolation parameters [16]. Jets are reconstructed using the anti-kt jet clustering [17] algorithm with a radius parameter R = 0.4, running on three-dimensional clusters of cells with significant calorimeter response [18]. Their energies have object-based corrections applied as well as corrections for upstream material, non-instrumented material, and sampling fraction. Jets are required to satisfy pjet T > jet jet 25 GeV and |η | < 2.5, where pT is the transverse momentum, and η jet is the pseudo-rapidity of the jet.. Duplication between electron and jet objects is avoided by removing the jet closest to an electron if their separation is ∆R < 0.2. The b-jets are identified among the reconstructed jets with an artificial neural network using variables that exploit the impact parameter, the secondary vertex and the topology of b- and c-hadron weak decays [19]. An identification criterion with 70 % efficiency is chosen, as evaluated on jets in a simulated tt̄ sample with pT > 20 GeV and |η| < 2.5. Hadronically decaying taus are reconstructed using clusters in the electromagnetic and hadronic calorimeter [3]. A Boosted Decision Tree tau identification method is used to select candiates with a 55-60 % efficiency. Tau candidates are required to have a charge ±1 and only one or three tracks in a cone of radius ∆R < 0.2. Photons are identified by electromagnetic cluster of energy deposits in the calorimeter similar to electron identification [20]. In the case of photons, isolated electromagnetic clusters without matching tracks are classified as unconverted photon candiates. Clusters matched to a pair of tracks that are consistent with the hypothesis of a γ → e+ e− conversion process are classified as converted photon candiates. miss The ET is calculated using the reconstructed jets, electrons, muons, τ leptons, photons, as well as calorimeter energy clusters not associated with these physics objects [21]. In this paper, reconstructed objects (using algorithms applied after the event is recorded) are distinguished from trigger objects (formed either at Level-1, Level-2, or the event-filter during the fast online reconstruction of the event). 3.4 Event selection for the Z-boson sample For the selection of the Z-boson sample, events are required to pass either the isolated single-muon trigger mu24i or the single-muon trigger mu36. A pair of oppositely charged muons with invariant mass, mµµ , consistent with the mass of the Z boson, |mZ − mµµ | < 10 GeV, is required. The two muons are required to originate from the same interaction vertex. If one of the two muons has pT > 25 GeV and is isolated, Σ∆R<0.2 ptrk T /pT < 0.1, it is a candidate for the tag-muon, and the other muon is a candidate for the corresponding probe-muon. From a pair of muons, two candidate tag- and probe-muons are allowed. Furthermore, the tag-muon candidate must have an angular distance of ∆R < 0.1 to an event-filter combined-muon that passes either the mu24i or mu36 trigger. In addition, the probe-muon candidate has to be isolated, Σ∆R<0.2 ptrk T /pT < 0.1..
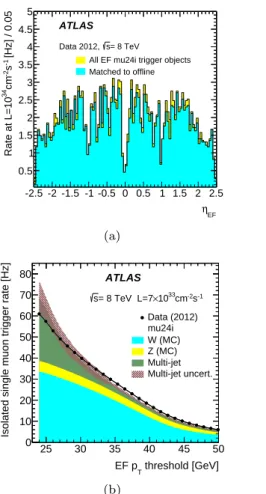
(8) 7. The probe-muon is matched to a trigger object if it lies within a distance ∆R < 0.1 from an event-filter combined-muon and ∆R < 0.5 from a Level-1 trigger object. The trigger efficiency is defined as the fraction of probe-muons that are associated with at least one trigger muon-object after applying the above criteria.. 3.5 Event selection for the J/ψ meson sample Due to rate restrictions, samples of J/ψ candidates were selected using the two dedicated triggers as in Table 1. One trigger requires a pair of muons found by the eventfilter full-scan with a mass consistent with that of the J/ψ, with at least one muon with pT > 18 GeV. It is used to determine the efficiency at Level-1 and Level2. The other trigger requires a pair of muons found by Level-1 and Level-2 with the same requirements as above. It is used to determine the efficiency at the event level with respect to the Level-1 and Level-2. Then the total efficiency can be obtained by multiplying these two partial efficiencies. All combinations of oppositely charged offline muons are considered as J/ψ candidates if each of the muon tracks satisfies |d0 | < 0.2 mm, where d0 is the distance of closest approach between the inner detector track and the proton-proton interaction in the plane transverse to the beam. The two inner detector tracks that are associated with the two muon tracks are refitted under the assumption that they originate from the same vertex. The invariant mass constructed from the refitted tracks, mµµ , is required to be consistent with the J/ψ mass, |mJ/ψ − mµµ | < 0.3 GeV. To enhance the fraction of muons originating from a J/ψ decay a further requirement is made on Lxy , the signed twodimensional decay length of the J/ψ. The variable Lxy J/ψ J/ψ is defined as Lxy ≡ L · pT /pT with L being the vector originating from the proton-proton interaction vertex. A requirement of Lxy < 1 mm is made on the muons. The requirements on d0 and Lxy are used to suppress non-prompt muons, such as those from the decays of B-hadrons [22]. The fact that these two dedicated triggers were used to select J/ψ candidates implies that the J/ψ mesons are boosted and therefore the spacial distance between the two muons from the decays is small. To ensure correct one-to-one matching between trigger and offline muons, the distance between them is gauged by the separation of the impact points of the tracks at the locations of the RPC and TGC detectors after extrapolation based on the refitted inner detector track parameters. If one of the two muons has pT > 18 GeV and its distance from an event-filter combined-muon. that passes the mu18 trigger is within ∆R < 0.08, as evaluated by using the extrapolated positions, it is considered as a tag-muon. If the other muon is beyond the distance of ∆R > 0.2 from the tag-muon, at the extrapolated positions, it is regarded as a probe-muon. The ∆R cut value is sufficiently large compared to the typical dimensions of the Level-1 trigger segmentation, as described in Sect. 2.3. A probe-muon is matched to trigger objects, if it is within ∆R < 0.12 from a Level-1 muon object and an event-filter combined-muon. 3.6 Selection of top quark and W + jets candidate events The top quark and W + jets candidate events have miss to pass a trigger that requires ET (calo) > 80 GeV, miss where ET (calo) is the magnitude of the missing transverse momentum as measured using only the calorimeter information. Several additional cuts are then imposed to remove events with noise bursts in the calorimeters and those with cosmic-ray showers. The muon candidate is required to have pT > 40 GeV and |z0 | < 2 mm, where z0 is the track impact parameter in the z-direction with respect to the proton-proton interaction vertex. The probe-muon is required to be isolated from neighbouring jets and energy depositions in the calorimeter. Probe-muons are required to satisfy Σ∆R<0.3 ptrk T /pT < 0.05 and ∆Rmin (jet, muon) > 0.4, where ∆Rmin (jet, muon) is the minimum distance between the muon and any jet. In addition, no other muon with pT > 25 GeV is allowed. miss Events are further required to have ET > 20 GeV W miss W and mT + ET > 60 GeV, where mT is the transverse mass5 of the W candidate. The W is reconstructed with miss four-vectors of the ET and the muon. For the top quark sample, there must be at least three jets with at least one b-jet. For the W sample, there must be one or two jets with no b-jets. Events with an electron are rejected.. 4 Trigger purity The trigger purity is defined as the fraction of muon triggers that can be associated to an offline muon. The ∆R distance between the trigger object and the offline muon was used to define this matching. The η distribution of the Level-1 MU15 object that seeds the mu24i event-filter is shown in Fig. 3(a) for all triggers and for those associated with a reconstructed 5 Transverse mass is defined as m2 = m2 + p2 + p2 and has x y T the useful propriety that it is invariant under Lorentz boosts along the beam direction..
(9) Rate at L=1034cm-2s-1 [Hz] / 0.05. offline muon. No explicit cut on offline muon pT was ap-. 500 450. ATLAS. 400. Data 2012, s= 8 TeV. 350 300. All L1 MU15 trigger objects. 250. Matched to offline. Rate at L=1034cm-2s-1 [Hz] / 0.05. 8. 200. 50. (a) Rate [Hz]. Data 2012, s= 8 TeV All EF mu24i trigger objects Matched to offline. 3.5 3 2.5 2 1.5 1. MU15 MU15 fake Linear Fit. 6000 4000 2000. ATLAS Data 2012, s = 8 TeV 30. 40. 50. 60 70 32 Inst. Lum. [10 cm-2s-1]. (b). (a) Isolated single muon trigger rate [Hz]. 0 -2.5 -2 -1.5 -1 -0.5 0 0.5 1 1.5 2 2.5 ηL1. 0 20. 4. -2.5 -2 -1.5 -1 -0.5 0 0.5 1 1.5 2 2.5 ηEF. 100. 8000. ATLAS. 0.5. 150. 10000. 5 4.5. 80. ATLAS. 70. s= 8 TeV L=7×1033cm-2s-1. 60. Data (2012) mu24i W (MC) Z (MC) Multi-jet Multi-jet uncert.. 50 40 30 20 10 0. 25. 30. 35. 40. 45. 50. EF p threshold [GeV] T. (b) Fig. 3 Trigger rate of the Level-1 MU15 as a function of (a) pseudorapidity ηL1 of all the trigger objects (light his-. togram) and of the ones associated with offline reconstructed muons (dark histogram) and (b) instantaneous luminosity, for all triggers (dots) and for the fake ones not-associated with offline-reconstructed muons (triangles) with the lines representing the results of the corresponding linear fits.. plied in the association between trigger and offline objects. Figure 3 shows that the Level-1 rate is dominated by triggers without associated offline muons (called fake triggers). The overall trigger purity (fraction of Level-1 rate from true muons ) is 40 %. Most of the Level-1 fakes originates in the end-cap. The cause of these fakes in the endcap region was extensively investigated [23], and is understood as mainly due to charged particles, for instance protons, produced in large amounts of dense material such as the toroid coils and shields. Figure 3(b) shows the MU15 trigger rate as a function of the instantaneous luminosity. Also shown is the rate due to fake triggers. The error bars show statistical uncertainties only. Both the total rate and the fake rate at Level-1 scale linearly with the instantaneous luminosity. Figure 4(a) shows the η distribution of the trigger objects recorded with the isolated single-muon trigger at the event-filter. The fake triggers, not associated to an offline reconstructed muon, are rejected by the sub-. Fig. 4 Rate of the isolated single-muon trigger, mu24i, at the event-filter (a) as a function of pseudorapidity ηEF for. all combined-muons (light histogram) and for the ones associated with offline reconstructed muons (dark histogram); (b) as a function of the transverse momentum pT threshold at the event-filter (EF) at an instantaneous luminosity of 7×1033 cm−2 s−1 , for combined-muons in the data (dots) compared to the expectations from W - and Z - bosons production and from the data-driven estimate for multi-jet production, as described in the legend.. sequent High-Level-Trigger decisions, and a purity of about 90 % is achieved. The physics origin of muons at the event-filter is illustrated in Fig. 4(b), which shows the expected composition of the trigger rate of the isolated single-muon as a function of the lower threshold value on the muon pT . The vertical scale gives the trigger rate as a function of pT at an instantaneous luminosity of 7×1033 cm−2 s−1 . The expectations for W and Z production were evaluated by using MC simulations with their predicted cross sections. Multi-jet production, where one or more jets produce a muon from the decay of a heavy quark or from a pion or kaon decay in flight, also contribute to this rate. The multi-jet contribution was evaluated in a data-driven approach as described below..
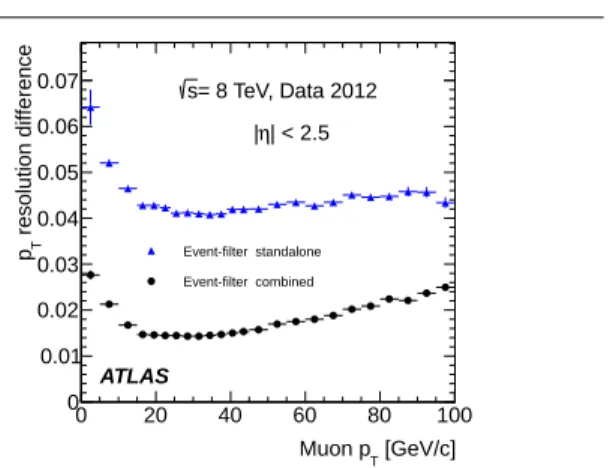
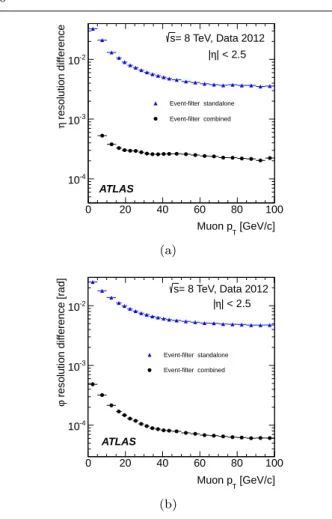
(10) A multi-jet enriched control-region is obtained by using events that are triggered by a single-muon trigger with the same pT threshold but without isolation requirement.6 The control-region is defined by inverting the trigger isolation criteria, by requiring at least one jet in an event, and by requiring matching to an offline muon to remove the fake contribution. The multi-jet contribution in the signal region is estimated by the following procedure. The fraction of multi-jet events in the signal region is taken from dijet MC simulation. The total normalization for the multi-jet contribution is then evaluated in the control-region. The contribution to the signal region is then taken as the total estimated multi-jet contribution weighed by the signal fraction from simulation. The uncertainty of this estimation is dominated by the statistical uncertainty in the controlregion/signal-region transfer factors from MC simulation, and is shown in Fig. 4(b). The rate was evaluated as a function of the pT threshold on the event-filter combined-muon. As shown in Fig. 4(b), at pT = 24 GeV about 60 % of the events triggered by mu24i are due to muons from W and Z production.. 5 Resolution The tag-and-probe method applied to Z-boson candidates was used to evaluate the quality of the pT , η and φ determination at the event-filter, compared to the offline reconstruction. The online algorithms are nearly identical to the offline versions but have some simplifications in the pattern recognition because of timing constraints. Additionally, the offline reconstruction uses updated calibration and alignment corrections not available at the time the data was recorded. Therefore, finite difference can be expected even when the event-filter combined muon is compared with the offline muon that is also reconstructed by combining the inner detector and muon detectors. The offline momentum resolution is < 3.5 % up to transverse momenta pT of 200 GeV and < 10% up to 1 TeV [24]. The residual of the trigger-reconstructed pT with respect to the offline value is defined as δpT = 1/ptrigger −1/pT T , 1/pT. where ptrigger is the transverse momenT tum reconstructed by the trigger, and the pT is that of the offline muon. The resolution difference between the trigger and offline reconstruction was defined as the standard deviation of a Gaussian function fitted to the δpT distribution. Figure 5 shows the pT resolution differences, as a function of the offline muon pT , of the eventfilter stand-alone and event-filter combined muons in the barrel and endcap regions. The pT resolution dif6 This. trigger was active but with a prescale factor of 10.. pT resolution difference. 9. 0.07. s= 8 TeV, Data 2012. 0.06. |η| < 2.5. 0.05 0.04 Event-filter standalone. 0.03. Event-filter combined. 0.02 0.01 ATLAS 0 0. 20. 40. 60. 80. 100. Muon pT [GeV/c]. Fig. 5 Resolution difference in transverse momentum pT determination in the offline and in the event-filter reconstruction, as a function of pT of the offline muon.. ference is about 2 % and 5 % for event-filter combined and event-filter stand-alone muon, respectively. The resolution differences of the η and φ determination were examined similarly by defining the residual as the absolute value of the difference between the trigger and offline reconstructed values. Figure 6 shows the η and φ resolution differences of the event-filter muons. It shows that the trigger–offline matching criterion used in the efficiency measurements, for instance ∆R < 0.1 for the tag-and-probe method using Z bosons (see Sect. 3.4), is sufficiently loose. 6 Efficiency measurements with Z boson candidates In the next several sections, measurements of the efficiency of the muon trigger in different kinematic regions are presented, preceeded by a discussion of systematic uncertainties. The efficiency is primarily measured as a function of muon pT . In addition, the efficiency is measured in two-dimensions, for instance in η and φ bins, and compared to the simulated one. To more accurately model data, all ATLAS physics analysis which use events selected with the muon trigger are provided with the ratios of measured to simulated efficiencies to make small corrections to the simulated samples. 6.1 Systematic uncertainty In the following, sources of systematic uncertainty are discussed and the quoted uncertainty values are presented for the efficiency measured in the region of 25 < pT < 100 GeV. – Dependence on pile-up interactions: the efficiency was measured as a function of the.
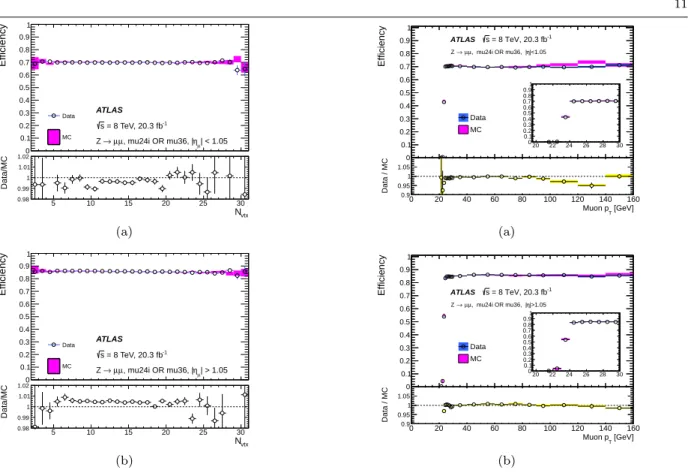
(11) η resolution difference. 10 s= 8 TeV, Data 2012 |η| < 2.5. 10-2. Event-filter standalone. 10-3. 10-4 0. Event-filter combined. ATLAS 20. – 40. 60. 80. 100. Muon pT [GeV/c]. (a) ϕ resolution difference [rad]. – s= 8 TeV, Data 2012 |η| < 2.5. 10-2. Event-filter standalone. 10-3. Event-filter combined. –. 10-4 ATLAS 0. 20. 40. 60. 80. 100. –. Muon pT [GeV/c]. (b) Fig. 6 Resolution difference in the (a) pseudorapidity η and (b) azimuthal angle φ determination in the offline and in the event-filter reconstruction, as a function of pT of the offline. –. muon.. number of reconstructed vertices, Nvtx, separately for data and MC simulation, as shown in Fig. 7. The efficiency is largely independent of the number of pile-up interactions. Separate linear fits to the data and MC simulation were performed in the range from Nvtx=5 to Nvtx=30 and extrapolated out to Nvtx=50. The dependence on the fit range was observed to be negligible. The largest difference observed between the fits in data and MC simulation were observed to be 0.1 (0.5) % in the barrel (endcap). This difference is taken as an estimate of the systematic uncertainty due to the presence of pile-up interactions. – Correlation between tag- and probe-muons from Z decays: for medium pT , tag- and probe-muons tend to be back-to-back in φ. Since the barrel and endcap have 16-fold and 12-fold symmetries, respectively, this can potentially lead to some bias; a tag-muon from a Z -boson decay inside a highly efficient region of. –. –. the detector tends to be accompanied by a probemuon in a region of high efficiency. This effect is evaluated by adding a requirement to the tag and probe pairs to prevent them from being back-toback, ∆φ(tag, probe) < π− 0.1, where ∆φ(tag, probe) denotes the azimuthal angle between the tag- and probe-muons. The resulting uncertainty in the efficiency determination is 0.3% (0.2%) in the barrel (endcap) region. Matching between probe-muon and trigger muon: this effect was estimated by changing the ∆R thresholds of the matching criteria. The change in the efficiency determination was found to be negligible. Probe-muon momentum scale and resolution: this effect was estimated by changing the momentum scale and momentum resolution for the probemuon by their respective uncertainties, as determined from the calibration using Z-bosons. The resulting change in efficiency was negligible. Probe-muon selection criteria: this effect was estimated by changing, typically by 10 %, the cuts in various selection criteria, leading to negligible changes in the efficiency determination. Background contribution: the amount of background was estimated by using the dijet, tt̄, and W MC simulations and the effect on the efficiency determination was found to be negligible [25]. Also, varying the Z mass window cut gave negligible effect. MC modelling: the sensitivity of the efficiency determination to the MC modelling was tested by comparing samples generated with a different MC generator, namely by adding Sherpa [26]. Again, the change in efficiency was found to be negligible [25]. Dependence on pT : after correcting the MC efficiency in η and φ so as to reproduce the one observed in the data , any residual deviations between data and MC in the pT dependence are taken as systematic uncertainty. This resulted in a 0.4 % effect. Probe-muon charge dependence: it was estimated by comparing the efficiencies measured with positively charged and negatively charged probe-muons. The estimated uncertainty is 0.2 % in the endcap region.. The individual systematic uncertainties are added in quadrature to obtain the total systematic uncertainty, resulting in 0.6 % for the efficiency measured in the region of 25 < pT < 100 GeV..
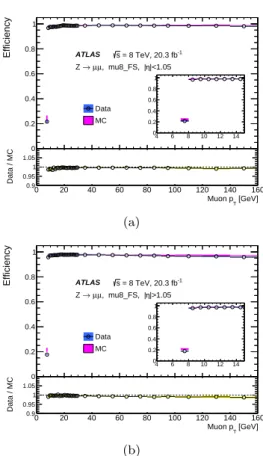
(12) Efficiency. Efficiency. 11 1 0.9 0.8 0.7 0.6. Z → µµ, mu24i OR mu36, |η|<1.05. 0.7 1 0.9 0.8 0.7 0.6 0.5 0.4 0.3 0.2 0.1 0 20. 0.5. 0.4 0.3. 0.4. ATLAS. Data. s = 8 TeV, 20.3 fb-1. 0.2 MC. 0.1. Z → µ µ , mu24i OR mu36, |ηµ| < 1.05. 0. 1.02. 1.01 1 0.99. 5. 10. 15. 20. 25. 0.3. Data. 0.2. MC. 0.1. Data / MC. Data/MC. s = 8 TeV, 20.3 fb-1. ATLAS. 0.8. 0.6. 0.5. 0.98. 1 0.9. 1.050 1 0.95 0.9. 0. 30. 22. 60. 80. 100. 120. 0.8 0.7 0.6. 20. 40. 60. 80. 100. 120 140 160 Muon p [GeV]. T. ATLAS. 0.7. 0.3. s = 8 TeV, 20.3 fb-1. 0.2. Z → µ µ , mu24i OR mu36, |ηµ| > 1.05. 0.1. Data / MC. 1.02. 1.01 1 0.99. 5. 10. 15. 20. 25. 30. s = 8 TeV, 20.3 fb-1. Z → µµ, mu24i OR mu36, |η|>1.05 1 0.9 0.8 0.7 0.6 0.5 Data 0.4 0.3 MC 0.2 0.1 0 20 22. 0.4. ATLAS. 0. Data/MC. 0.8. 0.5. 0.4. 0.98. 1 0.9. 0.6. 0.5. MC. 140 160 Muon p [GeV]. T. Efficiency. Efficiency. 1. 0.1. 30. (a). 0.9. Data. 28. 40. (a). 0.2. 26. 20. Nvtx. 0.3. 24. 0. 24. 26. 28. 30. 0 1.050 1 0.95 0.9. 0. 20. 40. 60. 80. 100. 120. 140 160 Muon p [GeV]. 20. 40. 60. 80. 100. 120 140 160 Muon p [GeV]. T. Nvtx. T. (b). (b). Fig. 7 Efficiency to pass either mu24i or mu36 triggers, as a function of the number of reconstructed vertices in an event, Nvtx in (a) the barrel region, and in (b) the endcap region, for data (dots) and MC simulation (bands). The lower panels show the ratio of the efficiencies in data and in MC simulation. The error bars reflect statistical uncertainties only.. Fig. 8 Efficiency of passing either the mu24i or mu36 trigger as a function of the probe-muon transverse momentum pT ,. 6.2 Single-muon triggers: mu24i, mu36 Requiring events to pass either the mu24i or the mu36 trigger serves as a general-purpose single-muon triggers for many physics analyses. Figure 8 shows the efficiency to pass either the mu24i or the mu36 trigger as determined in the barrel and endcap regions. The efficiency was measured as a function of the pT of the reconstructed probe-muon for both data and simulation. The efficiency in the simulation is seen to match that of the data over a wide pT range. The slight excess in simulation in the pT bin centred at 130 GeV was studied in detail. High pT muons from Z-boson decays tend to be slightly more forward where there is the largest difference in trigger efficiency between data and simulation.. for (a) the barrel region and (b) the endcap region, for data (dots) and MC simulation (bands). The lower panels show the ratio of the data and MC efficiencies. The error bars include both statistical and systematic uncertainties.. a fit was made using a Fermi function f (pT ).7 From the fit, the low edge of the efficiency plateau region was defined as the value of pT for which the efficiency decreases by 1 % from the plateau value. Table 2 shows these evaluated plateau values as well as the location of the low edges of the plateaus. The single-muon trigger that requires either the mu24i or mu36 trigger exhibits a plateau efficiency for physics analysis with muon pT > 25 GeV. The efficiency plateau is smooth at pT = 36 GeV indicating that there is no inefficiency due to the isolation requirement in this sample. Figure 9 shows the efficiency of requiring to pass either mu24i or mu36 triggers, as measured separately for the three trigger levels, Level-1, Level-2 and event-filter. The trigger selection becomes tighter and the efficiency turn-on becomes sharper as the trigger level increases. The plateau efficiency is mostly determined by Level-1.. The efficiency curve turns on sharply around the threshold, reaching a plateau already around pT ∼ 25 GeV. 7 The functional form is a , where a indicates 1+exp {b(c−pT )} In order to quantitatively evaluate the turn-on behaviour the plateau value, b the steepness of the turn-on slope, and c the threshold value. and the agreement between data and MC simulation,.
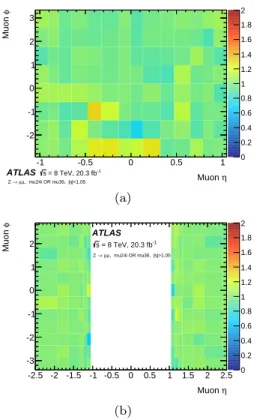
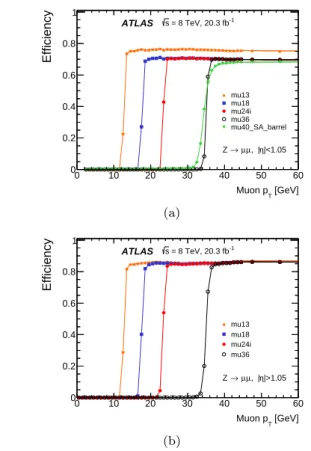
(13) 12 Table 2 Result of fitting a Fermi function to the efficiency turn-on curve as a function of transverse momentum pT for the single-muon trigger, for data and MC simulation. The location in pT of the low edge of the plateau region is defined such that the efficiency decreases by 1 % from the plateau value.. Data Trigger. Low edge. Plateau value. Low edge. 70.1 % 85.6 %. 24.3 GeV 24.8 GeV. 70.3 % 85.3 %. 24.0 GeV 24.7 GeV. Barrel Endcap. 1. Muon φ. Efficiency. Either mu24i or mu36. MC. Plateau value. 0.8. 2. 3. 1.8 1.6. 2. 1.4. 1. 1.2. 0.6 ATLAS 0.4. 0.8. s = 8 TeV, 20.3 fb-1. -1. Level 1 (MU15) Level 2 Event Filter. 0.2. 10. 20. 30. 40. 50. 60. 70. 80. 0.6 0.4. -2. Z → µ µ , mu24i OR mu36, |η|<1.05. 0 0. 1. 0. 90 100. 0.2. -1 ATLAS. -0.5. 0. 0.5. s = 8 TeV, 20.3 fb-1. (a). T. Muon φ. Efficiency. (a) 1. 2. ATLAS 2. 1.8. -1. s = 8 TeV, 20.3 fb. 1.6. Z → µµ, mu24i OR mu36, |η|>1.05. 1. 0.8. 0. Muon η. Z → µµ, mu24i OR mu36, |η|<1.05. Muon p [GeV]. 1. 1.4 1.2. 0. 1. 0.6. 0.8. -1. ATLAS 0.4. 0.6. s = 8 TeV, 20.3 fb-1. -2. Level 1 (MU15) Level 2 Event Filter. 0.2. 0.4 0.2. -3 -2.5 -2 -1.5 -1 -0.5. 0. 0.5. Z → µ µ , mu24i OR mu36, |η|>1.05. 0 0. 10. 20. 30. 40. 50. 60. 70. 80. 90 100. Muon p [GeV]. 1. 1.5. 2. 2.5. 0. Muon η. (b). T. (b) Fig. 9 Efficiency of passing either the mu24i or mu36 trigger as functions of the probe-muon transverse momentum pT , for. Fig. 10 Ratio of the data and MC efficiencies to pass either the mu24i or the mu36 trigger, in bins of the probe-muon η and φ in (a) the barrel region and (b) the endcap region.. the three trigger levels, Level-1, Level-2 and event-filter, in the data for (a) the barrel region and (b) the endcap region. The error bars show the statistical uncertainties only.. 6.3 Other single-muon triggers. The high level trigger efficiency with respect to Level-1 is about 98 – 99 %. Figure 10 shows the ratio of the data and MC efficiencies to pass either the mu24i or the mu36 trigger, as determined in bins of η and φ of the probe-muon, for the barrel and endcap regions. The measurement was performed for muons with pT > 25 GeV. The bins in η and φ are fine enough to reflect the hardware segmentation of the Level-1 detectors but coarse enough to have sufficient statistics in each bin. The typical size of the statistical uncertainty is less than 1 %, except for a few specific areas where the uncertainty is about 3 %.. Figure 11 shows the efficiencies of the mu36 trigger and of the mu40 SA barrel trigger, together with that of mu24i trigger, as measured in data. The turn-on behaviour of mu24i and mu36 are sharp, while it is slower at threshold for mu40 SA barrel. The latter relies only on the information from the muon detectors, and thus the pT resolution is coarser (see Sect. 5). On the other hand, the requirement to pass either mu36 or mu40 SA barrel results in about 2 % higher efficiency in the barrel region than achieved when requiring mu36 only, because mu40 SA barrel does not require an inner detector track match. Therefore, requiring that either the mu36 or mu40 SA barrel triggers are passed serves.
(14) Efficiency. 13 1 ATLAS. 6.4 Full-scan-muon trigger. s = 8 TeV, 20.3 fb-1. 0.8 0.6 mu13 mu18 mu24i mu36 mu40_SA_barrel. 0.4 0.2. Z → µ µ , |η|<1.05. 0 0. 10. 20. 30. 40. 50. 60. As described in Sect. 2.6, the mu18 mu8 FS trigger is split into the RoI-based single-muon trigger, mu18, and the full-scan triggers of mu18 FS and mu8 FS. The fullscan trigger efficiencies were evaluated using the same method and sources of systematic uncertainties as for the single-muon trigger (see Sect. 6.1). Only two sources of systematic uncertainties resulted in visible changes in the efficiency, while all others lead to negligible changes.. Muon p [GeV] T. Efficiency. (a) 1 ATLAS. s = 8 TeV, 20.3 fb-1. 0.8 0.6 mu13 mu18 mu24i mu36. 0.4 0.2. Z → µ µ , |η|>1.05. 0 0. 10. 20. 30. 40. 50. 60. Muon p [GeV] T. (b) Fig. 11 Efficiency of single-muon triggers, mu13, mu18, mu24i, mu36 and mu40 SA barrel, measured in data as a function of the probe-muon transverse momentum pT , for (a) the barrel region and (b) the endcap region. The error bars indicate statistical uncertainties only.. as a primary single-muon trigger for any processes that include muons with pT & 50 GeV. Figure 11 also shows the efficiencies of the mediumpT , single-muon triggers, mu13 and mu18. The plateau efficiency of mu13 is about 6 % higher in the barrel region than that of mu18 and other higher- pT triggers like mu24i. This is because mu13 is seeded from Level-1 MU10, which requires a two-station coincidence, while mu18 and the others are seeded from Level-1 MU15 which requires a three-station coincidence (see Sect. 2.3). A fit using a Fermi function was performed to quantify the turn-on behaviour of these medium-pT singlemuon triggers. Table 3 shows the evaluated plateau and low edge pT values for mu13 and mu18. It is seen that the offline cut of muon pT > 15(20) GeV is sufficient to ensure the mu13 (mu18) trigger efficiency is described by the plateau value. These middle-pT triggers are used in various triggers, such as dimuon triggers 2mu13 and mu18 mu8 FS. The efficiencies of the single-muon triggers, mu13 and mu18, are necessary ingredients to calculate the dimuon trigger efficiencies.. – Dependence on pT : the uncertainty was estimated by comparing data and MC efficiencies as a function of pT after correcting MC to reproduce data efficiency in η and φ. This resulted in a 0.2 % effect in the barrel and a 0.5 % effect in the endcap region. – Dependence on pile-up interactions: as shown in Fig. 12, the efficiency has a small dependence on the number of pileup events in the end cap region, with about 1.0% efficiency loss per 20 vertices. The MC simulation reproduces the effect well. This is accounted for by changing the distribution of the average number of pile-up interactions, resulting in a 0.1 % uncertainty. The resulting uncertainties were added in quadrature to form the total systematic uncertainty. Figure 13 shows the data and MC efficiencies for the mu8 FS trigger for the barrel and endcap regions. The efficiency plateaus for the barrel and endcap regions are 98.7 % and 97.6 %, respectively. This results in a higher efficiency for the dimuon trigger than achieved by requiring two RoI-based single-muon triggers. The ratio of the efficiencies in data and MC is shown as a function of η and φ in Figure 14 for the probemuons with pT 10 GeV. It is consistent with unity to within 2 % except in two bins where the difference is as large as 5 %.. 7 Efficiency measurements at low pT 7.1 Efficiency measurements with J/ψ For the kinematic region of pT . 10 GeV, the efficiency was measured with the tag-and-probe method using J/ψ meson decays. A MC study shows that the efficiency is slightly dependent on the measured d0 . Therefore, the efficiencies of prompt and non-prompt muons can be different due to different d0 distribution. This effect is mostly removed by the cuts on d0 and Lxy described in Sect. 3.5. The residual effect is then suppressed by reweighting.
(15) 14 Table 3 Result of Fermi function fit to the efficiency turn-on curve for the middle-pT single-muon triggers. The location in pT of the low edge of the plateau region is defined such that the efficiency decreases by 1 % from the plateau value.. Data Trigger mu13. Low edge. Plateau value. Low edge. 75.8 % 86.4 % 70.1 % 85.7 %. 13.7 GeV 13.6 GeV 18.2 GeV 18.7 GeV. 75.0 % 86.1 % 70.4 % 85.4 %. 12.8 GeV 13.4 GeV 18.1 GeV 18.4 GeV. Barrel Endcap Barrel Endcap. Efficiency. Efficiency. mu18. MC. Plateau value. 1 0.98. 1 0.8. ATLAS. 0.96. s = 8 TeV, 20.3 fb-1. Z → µµ, mu8_FS, |η|<1.05. 0.6. 1. ATLAS. 0.8. s = 8 TeV, 20.3 fb-1. 0.94 0.92. 0.4. 0.6. Data. Data. 0.4. MC. MC. 0.2. 0.2. 0 4. 0.9 1.0050. 5. 10. 15. 20. 25. 1. 30 Nvtx. 0.995 0.99. 0. 5. 10. 15. 20. 25. Data / MC. Data / MC. Z → µµ, mu8_FS, |η|<1.05 1.050 1 0.95 0.9. 0. 30 Nvtx. 20. 40. 60. 80. 20. 40. 60. 0.8. ATLAS. 1. 0.4. 0.6. Data. 0.4. MC. 0.2. 0.2. 20. 25. 30 Nvtx. 10. 15. 20. 25. 30 Nvtx. Data / MC. Data / MC. 0 4. 1. 5. 120 140 160 Muon p [GeV]. s = 8 TeV, 20.3 fb-1. MC. 0.995. 0. 140 160 Muon p [GeV]. 0.8. 0.9. 0.99. 100. Data. 15. 120. Z → µµ, mu8_FS, |η|>1.05. 0.6. s = 8 TeV, 20.3 fb-1. 10. 14. 1. ATLAS. 5. 100. 80. Z → µµ, mu8_FS, |η|>1.05 1.0050. 12. T. Efficiency. Efficiency. 0.98. 0.92. 10. (a). 1. 0.94. 8. T. (a). 0.96. 6. 0. 6. 8. 10. 12. 14. 0 1.050 1 0.95 0.9. 0. 20. 40. 60. 80. 100. 120. 140 160 Muon p [GeV] T. 20. 40. 60. 80. 100. 120 140 160 Muon p [GeV] T. (b). (b). Fig. 12 Efficiency of the mu8 FS trigger measured as a function of the reconstructed number of vertices in an event, Nvtx in (a) the barrel region and (b) the endcap region, in the data (dots) and in the MC simulation (bands) The lower panels show the ratio of efficiencies of data and MC simulation. The error bars represent statistical uncertainties only.. Fig. 13 Efficiency of the event-filter full-scan mu8 FS as a function of the probe-muon transverse momentum pT , sepa-. the d0 distribution to that of the prompt muons, which is obtained from the events with Lxy < 0. Owing to a very high purity of the offline muon identification, the background also consists of muons, where the latter do not originate from the decay of a J/ψ meson. The background fraction in the J/ψ mass window is about 16 %, ranging between 13 % to 20 % depending on the muon pT . The efficiency was measured by correcting the background effect using the side-bands of the invariant mass distribution.. rately in (a) the barrel region and (b) the endcap region.. 7.2 Systematic uncertainty The following sources of systematic uncertainty were evaluated. The uncertainty numbers quoted in the following are for the efficiency measured as a function of the probe-muon pT in the region of 4 < pT < 10 GeV. – Matching between probe-muon and trigger muon: the effect was estimated by relaxing the ∆R criterion from 0.12 to 0.15, and also by relaxing the ∆R distance cut between the two muons from 0.2 to 0.25. The estimated uncertainty is up to 3 % (2 %) at pT = 4 GeV in the barrel (endcap) region, decreasing to 1 % at pT & 6 GeV..
(16) 1.05. 3. 1.04 1.03. 2. 1.02. 1. Efficiency. Muon φ. 15 1. 0.8. ATLAS J/ ψ → µ µ. |η|<1.05. s=8 TeV, 19.2 fb-1. 1.01. 0.6. 1. 0. mu4(Data) mu6(Data) mu8(Data) mu4(MC) mu6(MC) mu8(MC). 0.99. -1. 0.4. 0.98 0.97. -2. 0.2 0.96. -0.5. 0. 0.5. s = 8 TeV, 20.3 fb-1. 1 Muon η. Z → µµ, mu8_FS, |η|<1.05. (a). 2 1.5 1 0.5 0 0. Muon p [GeV] T. mu4 mu6 mu8. 2. 4. 6. 8. 1.05. ATLAS 2. 10. (a). 1.03. 1. 14. T. 1.04. s = 8 TeV, 20.3 fb-1 Z → µµ, mu8_FS, |η|>1.05. 12. Muon p [GeV]. 1.02 1.01. 0. 1 0.99. -1. Efficiency. Muon φ. 0. Data/MC. -1 ATLAS. 0.95. 1. 0.8. ATLAS J/ ψ → µ µ. |η|>1.05. s=8 TeV, 19.2 fb-1. 0.98. -2. 0.97. 0.6. 0.96. -3 -2.5 -2 -1.5 -1 -0.5. 0. 0.5. 1. 1.5. 2. 2.5. 0.95. mu4(Data) mu6(Data) mu8(Data) mu4(MC) mu6(MC) mu8(MC). 0.4. Muon η 0.2. (b) Fig. 14 Ratio of the data and MC efficiencies for the mu8 FS trigger in bins of the probe-muon pseudorapidity η and azimuthal angle φ), in (a) the barrel region and (b) the endcap. Data/MC. 0. 2 1.5 1 0.5 0 0. Muon p [GeV] T. mu4 mu6 mu8. 2. 4. 6. 8. 10. 12. 14. Muon p [GeV]. region.. T. (b). – Reweighting of the d0 distribution: the effect was estimated by comparing the efficiency with that obtained by not applying the d0 reweighting. The estimated uncertainty is 1 % at pT ∼ 4 GeV, decreasing to a negligible level at pT & 6 GeV. – Probe-muon charge dependence: the effect was estimated by comparing the efficiencies measured with positively charged and with negatively charged probe-muons. The estimated uncertainty is 1 % at low pT ∼ 4 GeV, decreasing to 0.5 % at pT & 6 GeV. – Background contribution: the effect was estimated by not doing the background correction, resulting in a uncertainty of 0.1 %. – Probe-muon selection criteria: the effect was estimated by changing typically by 10 % the thresholds of various selection criteria, leading to negligible effects. – Dependence on pile-up interactions: Separate linear fits to the efficiency dependence on Nvtx in the data and MC simulation were performed in the range from Nvtx=5 to Nvtx=30 and extrapolated out to Nvtx=50. The dependence on the fit range was observed to be negligible. The largest dif-. Fig. 15 Efficiency of low transverse momentun pT single-. muon triggers, mu4, mu6 and mu8, as a function of the probemuon transverse momentum pT in (a) the barrel region and (b) the endcap region, in the data (symbols) and in the MC (bands). The error bars for MC indicate the statistical uncertainties only, while those for data indicate both the statistical and systematic uncertainties.. ference between the fit results in data and MC simulation were observed to be 0.2 (0.4) % in the barrel (endcap). This difference is taken as the estimate of the resulting systematic uncertainty. The total systematic uncertainties are obtained by adding the individual ones in quadrature. 7.3 Low-pT single-muon triggers Figure 15 shows the efficiency of the lowest-pT singlemuon triggers, mu4, mu6 and mu8 as a function of the pT of the probe-muon. The efficiency of mu4 is about 40 % at the nominal threshold of 4 GeV. The mu4 turnon curve rises slowly until pT ∼ 8 GeV. The plateau efficiency of mu4 is higher by about 3 % in the endcap region, compared to those of mu6 and mu8..
(17) 14. 2. 13. 1.8. 12. 1.6. 11. 1.4. 10. 1.2. T. Muon p [GeV]. 16. 9. 1. 8. 0.8. 7. 0.6. 6. 0.4. 5. 0.2. 4. ATLAS. J/ ψ → µµ,. -2. -1.5. -1. -0.5. s=8 TeV, 19.2 fb-1. 0. 0.5. 1. 1.5. 2. 0. Muon Qη. Fig. 16 Ratio of the data and MC efficiencies of the mu4 trigger in bins of the probe-muon pseudorapidity η multiplied by its charge, Qη, and the transverse momentum pT .. The ratio of data and MC efficiencies of the mu4 trigger determined in bins of pT and Qη, where Q stands for the charge of the probe-muon is shown in Fig. 16. The ratio is significantly lower than unity at Qη ∼ −1.1 for pT values up to ∼ 12 GeV. In the muon spectrometer toroid magnetic field, the muons with Qη > 0 (< 0) bend toward the large (small) |η| direction in the r–z plane. The muons with Qη ∼ −1.1 are thus likely to pass through only one layer of the RPC (see Fig. 1) and hence are not triggered. Figure 16 shows that this is not well modelled in the MC simulation.. 8 Efficiency measurements at very high pT 8.1 Efficiency measurements with top quarks and W associated with jets For the kinematic region of pT & 100 GeV, the efficiency was measured using muons from top quark and W + jet candidate events. Because they are statistically independent of each other and also correspond to background-enriched samples of each other, the efficiencies using muons in top quark and W + jet events can be obtained by solving the following two equations. 8.2 Systematic uncertainty In the following, sources of systematic uncertainty are discussed and the quoted uncertainty values are presented for the efficiency measured using the W + jets sample as a function of pT , in the region of 100 < pT < 400 GeV. – Muon isolation: to estimate this effect, the efficiency was measured by varying the isolation cut, both by loosening and by tightening the criteria, as well as by changing the ∆R cone size. The estimated uncertainty is typically 0.2 %; – Muon–jet separation: the requirement on muon–jet separation serves also as an isolation cut. This effect was estimated by changing the ∆R criterion in the matching from 0.4 to 0.3 and 0.5. The estimated uncertainty is typically 0.1 % and 0.3 % at maximum, miss – ET reconstruction: the effect was estimated by changing the threshold from 20 GeV to 50 GeV, and also by introducing miss another tight cut of ET (calo) > 120 GeV. The estimated uncertainty is 0.5 % at maximum. – Identification of b-jets: the effect was estimated by repeating the measurements with a different b-jet identification criterion, namely with 60 % efficiency and 80 % efficiency. The estimated uncertainty is typically less than 0.1 %. – Cut on pjet T : the effect was estimated by raising the pjet T threshold to 35 GeV. The estimated uncertainty is typically less than 0.1 %. – Background contribution: the number of background events was estimated by using the dijet and Z MC simulations and was found to be negligible at pT > 100 GeV. All the contributions were added in quadrature to obtain the total systematic uncertainties. 8.3 Single-muon trigger efficiency at pT & 100 GeV. Figure 17 shows the efficiencies measured using top quark and W with jets events for the single isolatedW,data W,data muon trigger, mu24i, in the barrel and endcap regions ǫW,data = fW ǫW + (1 − fW )ǫt , as a function of the pT of the probe-muon, up to pT ∼ where ǫt(W ) is the efficiency in pure top quark (W + 400 GeV. The data and MC simulation agree well up to jets) events, and ǫt(W ),data is the measured efficiency in the very high pT values. the top quark (W + jets) sample. The factors ftt,data Also shown in Fig. 17 are the ratios of the efficienW,data denote the fraction of true top quark (W +jets) cies in the data and MC simulation for the three samand fW events in the top quark (W with jets) sample, as deterples used for the efficiency determination. The three mined by using MC simulation. measurements are in good agreement with each other ǫt,data = ftt,data ǫt + (1 − ftt,data )ǫW ,.
(18) Efficiency. 17 0.74 ATLAS. 0.73. -1. s= 8 TeV, 18.1 fb. 0.72 0.71 0.7 0.69 mu24i, |η|<1.05. 0.68. W → µν Data. t → Wb → µνb Data. 0.67. MC. MC. Data / MC. 0.66 1.06 50. 100. 150. 200. 250 300 400 t → Wb → µνb350 Muon p [GeV] T W → µν Z → µµ (p ≤ 200 GeV). 1.04 1.02. T. 1 0.98 0.96 50. 100. 150. 200. 250. 300. 350. While the offline algorithm looks for large energy deposits in the calorimeter which arise from bremsstrahlung, the event-filter algorithm always uses a paramterised energy loss for a minimum ionising particle. Without correction, this can cause a mismatch in the momentum estimate in the inner detector and muon spectrometer causing the combination to fail. This occurs in the end cap where kinematically, for fixed pT , the energy of muons is much higher and thus high energy bremsstrahlung is more likely to occur. However, the effect is small, only occurs in the highest few pT bins and accounts for a 4 % efficiency loss with a 2 % uncertainty.. 400. Muon p [GeV] T. 9 Conclusions. Efficiency. (a) 0.89 ATLAS. 0.88. s= 8 TeV, 18.1 fb-1. 0.87. mu24i, |η|>1.05. 0.86 0.85 0.84 0.83 t → Wb → µ νb. 0.82. W → µν Data. Data MC. 0.81. Data / MC. 1.04. 50. 100. MC. 150. 200. 250 300 400 t → Wb → µνb350 Muon p [GeV] T W → µν Z → µµ (p ≤ 200 GeV). 1.02. T. 1 0.98 0.96 50. 100. 150. 200. 250. 300. 350. 400. Muon p [GeV] T. (b) Fig. 17 Efficiency of the mu24i trigger as a function of the probe-muon transverse momentum pT , as measured with the top quark and W +jet candidate events in the (a) barrel and. (b) endcap regions. The lower panels show the ratio of the efficiencies in the data and MC simulation. Also shown is the efficiency as measured with the Z decays using the tag-andprobe method. The error bars for MC simulation indicate the statistical uncertainties only while the error bars for data include both statistical and systematic uncertainties.. throughout a large pT range, providing a consistency check of the efficiency measurement in different physics processes with different experimental techniques and in the presence of different backgrounds. The efficiency in the end cap is seen to drop off slightly at the highest pT which is not observed in the barrel. This was further investigated and it was found that for the highest energy muons (≈ 1000 GeV) there is a slight loss of efficiency at the event-filter when combining the muon spectrometer and inner detector track.. The ATLAS muon trigger has been successfully adapted to the challenging environment at the LHC such that stable and highly efficient data taking was achieved in the year 2012. The transverse momentum threshold for the single-muon trigger was kept at 24 GeV, with a well-controlled trigger rate of typically about 8.5 kHz at the Level-1 and 65 Hz at the event-filter. The processing times of the Level-2 and event-filter muon trigger algorithms were sufficiently short to fit within the computing resource limitations. The purity of the trigger is about 90 % at the event-filter, and more than half of the triggers originate from electroweak bosons production. The efficiencies are measured extensively with the proton–proton collision data at a centre-ofmass energy of 8 TeV. The systematic uncertainty in the measured efficiency for the single-muon trigger is evaluated to be about 0.6 % in a kinematic region of 25 < pT < 100 GeV. The efficiency was measured over a wide pT range (few GeV to several hundred GeV) by using muons from J/ψ mesons, Z- and W -bosons, and top quark decays showing highly uniform and stable performance. Acknowledgements We thank CERN for the very success-. ful operation of the LHC, as well as the support staff from our institutions without whom ATLAS could not be operated efficiently. We acknowledge the support of ANPCyT, Argentina; YerPhI, Armenia; ARC, Australia; BMWFW and FWF, Austria; ANAS, Azerbaijan; SSTC, Belarus; CNPq and FAPESP, Brazil; NSERC, NRC and CFI, Canada; CERN; CONICYT, Chile; CAS, MOST and NSFC, China; COLCIENCIAS, Colombia; MSMT CR, MPO CR and VSC CR, Czech Republic; DNRF, DNSRC and Lundbeck Foundation, Denmark; EPLANET, ERC and NSRF, European Union; IN2P3-CNRS, CEA-DSM/IRFU, France; GNSF, Georgia; BMBF, DFG, HGF, MPG and AvH Foundation, Germany; GSRT and NSRF, Greece; ISF, MINERVA, GIF, I-CORE and Benoziyo Center, Israel; INFN, Italy; MEXT and JSPS, Japan; CNRST, Morocco; FOM and NWO, Netherlands; BRF and RCN, Norway; MNiSW and.
(19) 18 NCN, Poland; GRICES and FCT, Portugal; MNE/IFA, Romania; MES of Russia and ROSATOM, Russian Federation; JINR; MSTD, Serbia; MSSR, Slovakia; ARRS and MIZŠ, Slovenia; DST/NRF, South Africa; MINECO, Spain; SRC and Wallenberg Foundation, Sweden; SER, SNSF and Cantons of Bern and Geneva, Switzerland; NSC, Taiwan; TAEK, Turkey; STFC, the Royal Society and Leverhulme Trust, United Kingdom; DOE and NSF, United States of America. The crucial computing support from all WLCG partners is acknowledged gratefully, in particular from CERN and the ATLAS Tier-1 facilities at TRIUMF (Canada), NDGF (Denmark, Norway, Sweden), CC-IN2P3 (France), KIT/GridKA (Germany), INFN-CNAF (Italy), NL-T1 (Netherlands), PIC (Spain), ASGC (Taiwan), RAL (UK) and BNL (USA) and in the Tier-2 facilities worldwide.. References 1. ATLAS Collaboration, Observation of a new particle in the search for the Standard Model Higgs boson with the ATLAS detector at the LHC, Phys. Lett. B 716 (2012) 1, arXiv:1207.7214 [hep-ex]. 2. CMS Collaboration, Observation of a new boson at a mass of 125 GeV with the CMS Detector at the LHC , Phys. Lett. B 716 (2012) 30, arXiv:1207.7235 [hep-ex]. 3. ATLAS Collaboration, The ATLAS Experiment at the CERN Large Hadron Collider, JINST 3, S08003 (2008). 1. 4. ATLAS Collaboration, Performance of the ATLAS Trigger System in 2010, Eur. Phys. J. C 72 (2012) 1849, arXiv:1110.1530 [hep-ex]. 5. ATLAS Collaboration, Expected Performance of the ATLAS Experiment - Detector, Trigger and Physics, arXiv:0901.0512 [hep-ex]. 6. GEANT4 Collaboration, S. Agostinelli et.al., GEANT4: a simulation toolkit., Nucl. Instrum. Meth. A 506 (2003) 250. 7. ATLAS Collaboration, The ATLAS simulation infrastructure., Eur. Phys. J. C 70 (2010) 823, arXiv:1005.4568 [hep-ex]. 8. T. Sjostrand, S. Mrenna, P.Z. Skands, A Brief Introduction to PYTHIA 8.1, Comput. Phys. Commun. 178 (2008) 852, arXiv:0710.3820 [hep-ph] . 9. S. Frixione, P. Nason, C. Oleari, Matching NLO QCD computations with Parton Shower simulations: the POWHEG method, J. High Energy Phys. 11 (2007) 070, arXiv:0709.2092 [hep-ph]. 10. T. Sjostrand, S. Mrenna, and P.Z. Skands, PYTHIA 6.4 Physics and Manual, J. High Energy Phys 05 (2006) 026, arXiv:0603175 [hep-ph] .. 11. B.P. Kersevan and E. Richter-Was Comput. Phys. Commun. 149 (2004) 142, arXiv:0405247 [hep-ph]. 12. M. L. Mangano, M. Moretti, F. Piccinini, R. Pittau, and A. D. Polosa, ALPGEN, a generator for hard multiparton processes in hadronic collisions, J. High Energy Phys. 0307 (2003) 001, arXiv:0206293 [hep-ph] . 13. ATLAS Collaboration, Measurement of the muon reconstruction performance of the ATLAS detector using 2011 and 2012 LHC protonproton collision data, submitted to EPJC, arXiv:1407.3935 [hep-ex] . 14. ATLAS Collaboration, Electron performance measurements with the ATLAS detector using the 2010 LHC proton-proton collision data, Eur. Phys. J. C 72 (2012) 1909, arXiv:1110.3174 [hep-ph].. 15. ATLAS Collaboration, Electron reconstruction and. 16.. 17.. 18. 19.. identification efficiency measurements with the ATLAS detector using the 2011 LHC proton-proton collision data, European Physical Journal C 74 (2014) 2940, arXiv:74:2941 [hep-ex]. ATLAS Collaboration, Measurement of the inclusive isolated prompt photon cross section in pp collisions at sqrt(s) = 7 TeV with the ATLAS detector, Phys. Rev. D 83 (2011) 052005, arXiv:1012.4389 [hep-ex]. M. Cacciari, G. Salam, G. Soyez, The anti-kT jet clustering algorithm, J. High Energy Phys. 04 (2008) 063, arXiv:0802.1190 [hep-ph]. ATLAS Collaboration, Calorimeter clustering algorithms: description and performance, ATL-LARG-PUB-2008-002. ATLAS Collaboration, Calibration of b-tagging using dileptonic top pair events in a combinatorial likelihood approach with the ATLAS experiment,. ATLAS-CONF-2014-004. 20. ATLAS Collaboration, Expected photon performance in the ATLAS experiment, Report No. ATLAS-CONF-PUB-2011-07 (2011). 21. ATLAS Collaboration, Performance of missing transverse momentum reconstruction in proton-proton collisions at 7 TeV with ATLAS, Eur. Phys. J. C 72 (2012) 1844, arXiv:1108.5602 [hep-ex] . 22. ATLAS Collaboration, Differential cross-sections of inclusive, prompt and non-prompt J/Ψ production, Nucl. Phys. B 850 (2011) 387, arXiv:1104.3038 [hep-ex]. 23. ATLAS Collaboration, New Small Wheel Technical Design Report, CERN-LHCC-2013-006;. ATLAS-TDR-020. 24. ATLAS Collaboration, Muon Reconstruction Efficiency and Momentum Resolution of the ATLAS Experiment in √ Proton-Proton Collisions at s = 7 TeV in 2010,. submitted to The European Physical Journal C, arXiv:1404.4562 [hep-ex] . 25. ATLAS Collaboration, Performance of the ATLAS muon trigger in 2011, ATLAS-CONF-2012-099. 26. T. Gleisberg, Event generation with Sherpa 1.1, J. High Energy Phys 02 (2009) 007, arXiv:0811.4622 [hep-ph] ..
Figure
+7
Documento similar