Payroll taxes and the labor market : a computable general equilibrium analysis
26
0
0
Texto completo
(2) 100. LATIN AMERICAN JOURNAL OF ECONOMICS | Vol. 49 No. 1 (May, 2012), 99–123. reduce business costs and encourage the hiring of a larger number of people. However, given that these taxes are the largest source of financing for the SENA4 and the ICBF5, a new source of resources has to be found for these government entities. Some have proposed increasing other kinds of taxes, particularly the value-added tax (VAT)6, to maintain a fiscal balance. The analysis has concentrated on the use of econometric models that are based on partial equilibrium models or on estimating structural models7, to determine the relationships between the labor market and non-wage costs. This entails overlooking the correlations that appear in general equilibrium, as in the case of partial equilibrium models, and the second-order effects on the economy, as in the case of the structural models. In a partial equilibrium model, a reduction in payroll taxes clearly leads to an increase in employment, but does not consider the impact on the fiscal deficit, which will probably increase due to lower tax collection. Now, if this fiscal imbalance is financed by an increase in another type of tax (for example, VAT), this implies a reduction in consumption which would af fect the economy’s GDP, probably by reducing it, and would of fset the positive ef fect on the labor market, that is an increase in employment, and therefore cause a loss of jobs in the short or long term. As can be seen, although the policy action aims at increasing employment, the dif ferent relationships in the economy may lead to an undesired ef fect that cannot be considered in a partial equilibrium model. On the other hand, in the scope of computable general equilibrium (CGE) models, it is possible to evaluate dif ferent scenarios for a policy and answer questions such as: Who are the winners and losers as a result of this policy (the elimination of payroll taxes)? What happens to the fiscal deficit? How can an increase in the fiscal deficit be financed? Given the existing production technology, does this create a possible increase in employment? For these reasons, and others not mentioned here, CGE models will be used to analyze the tax impact. These models provide an economic structure that is easy to interpret when 4. The SENA is a government agency that invests funding from parafiscal taxes in workers’. social and technical development by of fering programs to incorporate people into productive activities (http://www.sena.edu.co/). 5. The ICBF is part of the Ministry of Social Protection and was created to provide comprehensive protection for the family, particularly children (https://www.icbf.gov.co/). 6. See Sánchez, Duque and Ruiz (2009). 7. These may be derived from general equilibrium models..
(3) Gustavo Hernández | PAYROLL TAXES AND THE LABOR MARKET. 101. studying policy simulations that af fect all markets in the economy, based on a solid microeconomic foundation. In addition, they take into consideration income generation and expenditures by economic agents simultaneously, making it possible to explain the ef fects of ef ficiency and distribution of dif ferent policy changes. These models have been widely used in Colombia since the beginning of the 1980s8, for a great number of policy analyses: trade liberalization, free trade agreements, fiscal impact, the ef fects of policy on poverty, and others. Traditionally, CGE models consider markets under perfect competition, that is, in which market failures are not involved. In this case, because the goal is to evaluate the generation of jobs under the elimination of payroll taxes, a competitive employment market is not the best alternative. This is because there are no changes in unemployment, that is, the entry and exit of people to and from the labor market, but rather what occurs is a sectoral shift of the factors of production. To correct this problem, the incorporation of a non-competitive labor market is considered, implying changes in the level of unemployment within the model. In this paper, the competitive labor market is replaced by a wage curve, following Hutton and Ruocco (1994). The wage curve shows the empirical relationship between the unemployment rate and the wage level, which together with job demand enables determination of the involuntary unemployment level9. Within the labor market, there are two types of labor: formal and informal work. This is because in Colombia the labor informality rate exceeded 60% between 2000 and 200510. To characterize the movement from formal to informal employment and vice versa, this study follows the Harris-Todaro approach, where an individual observes the expected wage as a signal to migrate from one sector to another. It should be noted that in this case it is assume that the labor market in the formal sector will behave in a non-competitive fashion (unemployment generated by a wage curve) and the informal labor market in a competitive way. The MEGATAX11, model was used for the simulations, based on the social accounting matrix for 200512. With MEGATAX we carry out the 8. See Cepeda, Lopez and Ripoll (1994). 9. See Böhringer et al. (2003). 10. See Cardenas and Mejía (2007). 11. See Light and Rutherford (2002). 12. See Pardo and Corredor (2008)..
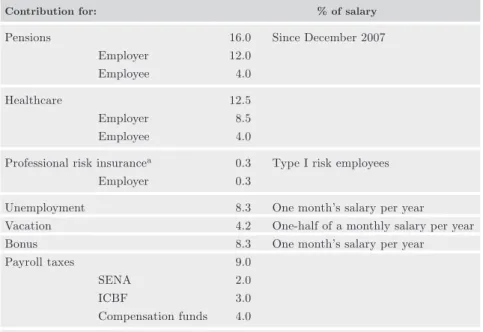
(4) 102. LATIN AMERICAN JOURNAL OF ECONOMICS | Vol. 49 No. 1 (May, 2012), 99–123. simulation of the elimination of payroll taxes and financing of the fiscal imbalance through an increase in tax rates as a way to finance the SENA and the ICBF. There is a reduction in the unemployment rate, close to one percentage point, without any type of financing. But once financing of the fiscal imbalance is introduced, the effect is zero, due to increased distortions to the economy. Therefore, the partial equilibrium considerations that find an increase in employment of up to two percentage points may be an overestimation. This effect is canceled out if financing through taxes as proposed by several authors is considered. The rest of the paper is divided into the following sections: Section 2 provides a brief overview of the ef fects of payroll contributions on employment as well as their composition, and Section 3 presents an explanation of the structure of the computable general equilibrium model used, emphasizing the characteristics associated with the labor market. Subsequently, Section 4 presents the social accounting matrix that is the dataset of the model, Section 5 shows the results of the policy simulations and Section 6 contains some final comments.. 2.. The ef fect of parafiscal taxes on the labor market. In Colombia, non-wage costs are the payments that an employer incurs when hiring a person. These costs are set forth in the country’s Substantive Labor Code but are not part of basic remuneration. Currently, non-wage costs for which the employer is responsible total 50.7% of the worker’s salary. Of this, 41.1% corresponds to worker insurance (healthcare, pension and professional risks), 41.1% to payments for unemployment, bonuses and holidays, and the remaining 17.8% consists of fiscal contributions (Table 1). From a theoretical point of view, in a competitive partial equilibrium model an increase in payroll taxes paid by businesses would be expected to increase labor costs. There is a process of setting wages and employment that compensates for these higher costs, thus reducing employment. On the other hand, if the worker pays the tax, this implies a decline in worker wages, which workers compensate for by reducing the labor supply. As can be seen, in both cases employment falls, so that employers and workers share the losses of the tax burden. Now all of this depends on the elasticities of both labor demand and supply, since given the case in which demand is completely elastic and supply is inelastic, the cost is assumed in its entirety by workers. In the long.
(5) 103. Gustavo Hernández | PAYROLL TAXES AND THE LABOR MARKET. Table 1. Non-salary costs in 2007 Contribution for:. % of salary. Pensions. 16.0 Employer. 12.0. Employee. 4.0. Healthcare. Professional risk. Since December 2007. 12.5 Employer. 8.5. Employee. 4.0. insurancea. 0.3. Employer. 0.3. Type I risk employees. Unemployment. 8.3. One month’s salary per year. Vacation. 4.2. One-half of a monthly salary per year. Bonus. 8.3. One month’s salary per year. Payroll taxes. 9.0 SENA. 2.0. ICBF. 3.0. Compensation funds. 4.0. Source: Decree 1,772 of 1994, Law 1,122 of 2007 and Decree 4,982 of 2007. a. Payment varies with job-related risk. Risks range from type I, which requires a payment of 0.348% of the monthly salary, to type V, which requires a payment of 8.7% of the monthly wage.. run, this produces an adjustment in the labor market such that the ef fect on employment disappears (Farne, 2010). In Colombia, this type of adjustment takes a long time, as a large component of the labor supply consists of informal workers who earn the minimum wage. In the first case, a high rate of informality—around 60.0% of all employment—implies that the labor supply will almost immediately respond to changes in wages. Therefore, the supply is not inelastic. On average, 55.0% of workers earn minimum wage, which implies that there will be downward rigidity. Since the beginning of the 1990s, a large number of econometric exercises have been carried out to study the effect of non-wage costs on employment, as well as to evaluate the impact that reducing payroll taxes would have on formalization of the economy13. First, these exercises have found that salary and non-salary costs present the expected sign; in other words, an increase in these costs reduces employment and employment 13. Here only empirical evidence produced since 2000 is presented..
(6) 104. LATIN AMERICAN JOURNAL OF ECONOMICS | Vol. 49 No. 1 (May, 2012), 99–123. formalization. Therefore, overall, an increase in non-salary costs would provoke an average reduction in employment of 1.5% (Table 2). In particular, Cárdenas and Bernal (2003) find that employment elasticities with respect to the real wage and costs imply that elimination of payroll contributions would boost employment by 1.3% in urban areas (from a long-term or dynamic approach), while the “static” ef fect of the same policy would generate a 5.0% increase in labor demand. Recently, Sánchez, Duque, and Ruiz (2009) have found that a 5.0% reduction in labor costs, as a percentage of salary, generate a reduction of 1.2% in the unemployment rate. Kugler and Kugler (2009), using a panel of firms representing the industrial sector, show that a 10.0% increase in payroll contributions causes a drop in formal employment that ranges from 4.0% to 5.0%.. 3.. Computable general equilibrium model. This section presents the principal characteristics of MEGATAX. In the first instance, the principal characteristics of the model are shown, and later the functioning of the labor market is described in greater detail. To do this, a wage curve (Blanchflower and Oswald, 1994) is introduced in order to incorporate unemployment into the model. In addition, the Harris-Todaro approach is used to show how the worker’s decision to work in the formal or informal sector is endogenous to wages.. 3.1 Characteristics of the model A standard CGE model is used, that is, the technology assumes constant returns to scale and preferences are assumed to be homothetic. Optimizing behavior is assumed on the part of households and firms, and excess demand functions are homogeneous of degree zero and satisfy Walras’ law. In addition, factor and product markets are assumed to be competitive; in this case, an exception is made for the labor market14, and relative prices are suf ficiently flexible to clear factor and product markets. In a more detailed form, we have that in production (Yi) goods are produced in accordance with the Leontief-CES nested technology15. 14. This will be described later in greater detail.. 15. In this case, the elasticity of substitution q is equal to zero, and is therefore a Leontief function..
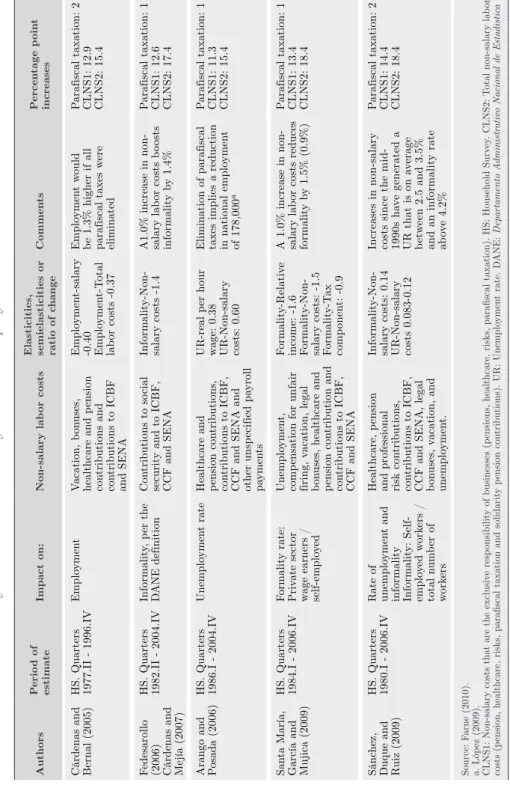
(7) Formality rate: Private sector wage earners / self-employed. Rate of unemployment and informality Informality: Selfemployed workers / total number of workers. Santa María, HS. Quarters García and 1984.I - 2006.IV Mujica (2009). Sánchez, Duque and Ruiz (2009). Healthcare, pension and professional risk contributions, contributions to ICBF, CCF and SENA, legal bonuses, vacation, and unemployment.. Unemployment, compensation for unfair firing, vacation, legal bonuses, healthcare and pension contribution and contributions to ICBF, CCF and SENA. Healthcare and pension contributions, contributions to ICBF, CCF and SENA and other unspecified payroll payments. Contributions to social security and to ICBF, CCF and SENA. Vacation, bonuses, healthcare and pension contributions and contributions to ICBF and SENA. Non-salary labor costs. Informality-Nonsalary costs: 0.14 UR-Non-salary costs 0.083-0.12. Formality-Relative income: -1.6 Formality-Nonsalary costs: -1.5 Formality-Tax component: -0.9. UR-real per hour wage: 0.38 UR-Non-salary costs: 0.60. Informality-Nonsalary costs -1.4. Employment-salary -0.40 Employment-Total labor costs -0.37. Elasticities, semielasticities or ratio of change. Increases in non-salary costs since the mid1990s have generated a UR that is on average between 2.5 and 3.5% and an informality rate above 4.2%. A 1.0% increase in nonsalary labor costs reduces formality by 1.5% (0.9%). Elimination of parafiscal taxes implies a reduction in national employment of 178,000a. A1.0% increase in nonsalary labor costs boosts informality by 1.4%. Employment would be 1.3% higher if all parafiscal taxes were eliminated. Comments. Parafiscal taxation: 2 CLNS1: 14.4 CLNS2: 18.4. Parafiscal taxation: 1 CLNS1: 13.4 CLNS2: 18.4. Parafiscal taxation: 1 CLNS1: 11.3 CLNS2: 15.4. Parafiscal taxation: 1 CLNS1: 12.6 CLNS2: 17.4. Parafiscal taxation: 2 CLNS1: 12.9 CLNS2: 15.4. Percentage point increases. Source: Farne (2010). a. López (2009). CLNS1: Non-salary costs that are the exclusive responsibility of businesses (pensions, healthcare, risks, parafiscal taxation). HS: Household Survey. CLNS2: Total non-salary labor costs (pension, healthcare, risks, parafiscal taxation and solidarity pension contributions). UR: Unemployment rate. DANE: Departamento Administrativo Nacional de Estadistica. HS. Quarters 1980.I - 2006.IV. Unemployment rate. HS. Quarters Informality, per the 1982.II - 2004.IV DANE definition. Fedesarollo (2006) Cárdenas and Mejía (2007). Arango and HS. Quarters Posada (2006) 1986.I - 2004.IV. HS. Quarters Employment 1977.II - 1996.IV. Cárdenas and Bernal (2005). Impact on:. Period of estimate. Ef fect of salary costs and non-salary costs on employment in Colombia. Authors. Table 2. Gustavo Hernández | PAYROLL TAXES AND THE LABOR MARKET. 105.
(8) 106. LATIN AMERICAN JOURNAL OF ECONOMICS | Vol. 49 No. 1 (May, 2012), 99–123. In the first level, the value added (vi ) and intermediate inputs (bi,j) are entered into the calculation:. (. θ Yi = λviθ + (1 − λ)bi,j. ⎡ min x i,j bi,j = ⎢⎢ j ⎢⎣. 1/θ. ). (1). ⎤ ⎥ ⎥ ⎥⎦. (2). The value added is represented by a Cobb-Douglas function whose arguments are capital Ki and labor (in our case, two types: formal labor, Lfor,i, and informal labor Linf,i ). There is a constant-elasticity-of transformation function for the supply of formal and informal labor, which implies segmentation in the labor market. When the elasticity of transformation is zero, both types of labor have a fixed supply. Constant returns to scale are assumed, which implies that factors are remunerated according to their marginal productivity, that is, real wages and the rental price of capital. γ. α. β. i vai = ∏ Ki i Lfor Li ,i inf ,i. where γi + αi + βi = 1. (3). Production Yi of the dif ferent sectors is destined to two types of markets: domestic, Di, or exported, Ei. These two types of goods are assumed to be imperfect substitutes and have a constant elasticity of transformation (h). The functional form is the following:. (. ). Yi = ⎡⎢ ψiDDi1+η + 1 − ψiD Ei1+η ⎤⎥ ⎦ ⎣. (4). where yiD is the share in the (accounting) basis of total domestic sales of the product for sector i. On the other hand, imports adopt the Armington representation of demand for imports, Ai, where A is the Armington good produced as a result of the combination of domestic goods, Di, with imported goods, Mi, in the same sector. An Armington elasticity of substitution, s, is used. ((σi −1)/σi ). Ai = [ ωi Di. ((σi −1)/σi ) (σi /(σi −1)). + (1 − ωi )M i. ]. σ. (5).
(9) Gustavo Hernández | PAYROLL TAXES AND THE LABOR MARKET. 107. The real exchange rate (r) is determined by the supply of exports and demand for imports, which is defined in units of foreign currency. The parameter B denotes the current account balance. According to the assumption of a small economy, prices of imports and exports are taken as given (pEi; pMi). ∑ piE Ei + B = ∑ piM M i i. i. (6). For the structure of the model, a flexible exchange rate is used such that the trade balance is fixed. Then, any change in the exchange rate reflects the recomposition of imports and exports to maintain the trade balance. In the case of aggregate final consumption, there is a representative agent who is endowed with capital and labor. Preferences are represented by the utility function, whose arguments are the domestic good Di and the imported good Mi, that is, the composite good Ai. In this case, the functional form of the utility function is Cobb-Douglas, which will weight all imported and domestic goods in the economy. U(Ai ) = ∏ Aiαi i. ∑ αi = 1 i. (7). The government spends its funds on services and investment. Revenue comes from taxes, capital rents and transfers from abroad. The main taxes in the model are: value-added tax, customs duties, direct taxes on capital, direct taxes on labor (payroll taxes) and indirect taxes, all of which will be the instruments of tax policy.. 3.2 Labor market The negative relationship between the unemployment rate and wages can be explained by non-competitive theories for the labor market. In general, there are three types of models used to explain this phenomenon: labor bargaining models, ef ficiency wage and contract models. Colombia has presented evidence that in the labor market, employers continue to conduct ef ficiency wage (Iregui, et al. 2010), since in periods of low economic growth they avoid reducing wages to prevent the loss of more productive workers with greater experience. Furthermore, workers who earn high wages prefer to lose.
(10) 108. LATIN AMERICAN JOURNAL OF ECONOMICS | Vol. 49 No. 1 (May, 2012), 99–123. their jobs rather than see their earnings reduced, that is, there is an adjustment in quantities. In the model, as there are two types of labor—formal and informal—so formal workers, given that they enjoy greater stability due to labor contracts, can be modeled with a wage curve. On the other hand, because informal jobs are not stable, that market is adjusted through wages, and is therefore seen as behaving like a competitive market. To incorporate this negative relationship between wages and the unemployment rate into the CGE model, a wage equation is used: w = g(ur) P. (8). where P is the consumer price index and ur is the unemployment rate, which was 11.7% in 2005 in Colombia. The functional form for the wage equation, g(ur), is very basic. The elasticity parameter ε is used for this: −1/ g(ur ) = ur 1 . if < ∞ if = ∞. When e®¥, the real wage curve tends to be horizontal, following the neoclassical approximation. Empirical evidence for Colombia shows that the value of the elasticity between wages and unemployment (e) ranges from -0.13 for Sánchez and Núñez (1998) to -0.07 for Ramos, Duque and Surinach (2009) and between -0.08 and -0.15 for Arango, Obando and Posada (2010). These results are close to the -0.10 found by Blanchflower and Oswald (1994) for dif ferent countries.. 3.3 Migration between formal and informal labor Informality can be viewed in terms of opposing aspects: as an escape from the formal sector or from an exclusion approach. The escape approach lies within the framework of implicit cost-benefit analysis for taking the decision to work in the formal or informal sector. In the case of exclusion, a person works in the informal sector because: there is significant segmentation in the labor market, which implies not being able to obtain access to certain benefits provided by the.
(11) Gustavo Hernández | PAYROLL TAXES AND THE LABOR MARKET. 109. economy and the state. The law does not allow movement between formal and informal labor, since given the tax regulations workers earn more in the informal sector than in the formal one. Then, one way to model the labor market to show that there is an escape approach16 is to follow Todaro (1969), who relates the labor migration rate, in this specific case, with an informal worker’s decision to enter the formal labor market17, through the dif ferential in the real wage and the unemployment rate. The migration occurs when the expected real wage for formal labor is high in relation to informal work. According to this argument, workers migrate to the formal sector until the informal sector wage is equal to the expected formal wage. winf ,i = (1 − ur)w for,i. (9). The expected wage in the informal sector is defined by the formal wage, wfor,i multiplied by the employment rate (1–ur). When there is a high rate of unemployment, ur increases, and the gap between the formal wage and the informal wage grows. This implies that very few informal workers move into the formal labor market. The labor supply for the formal and informal sectors is determined by the migration rate and the unemployment rate. First, the formal labor supply is equal to the fraction of employed workers who choose to migrate to the formal sector: Lfor,i = L0for,i. 1 − ur m 1 − ur 0 m 0. (10). where m is the migration rate, measured as the proportion of informal workers in the total labor supply in both the formal and informal sectors, ur0 is the initial unemployment rate, and L0for,i is the initial supply of formal labor. The migration rate depends on the unemployment rate and the expected wage, and therefore, the supply of informal labor is equal to those workers who decided not to migrate: Linf,i = L0inf,i. 1−m 1 − m0. (11). 16. In order to model the exclusion approach, a labor market that is totally segmented. between formal and informal labor would be proposed. 17. Which is too low for Colombia (Bernal, 2009, and Mondragon, Peña and Wills, 2010)..
(12) 110. LATIN AMERICAN JOURNAL OF ECONOMICS | Vol. 49 No. 1 (May, 2012), 99–123. 3.4 Equilibrium conditions The solution algorithm of this CGE model is based on a mixed complementarity problem (Mathiesen, 1985), which is solved in the GAMS/MPSGE software (Rutherford, 1999). The conditions of the model that define an Arrow–Debreu equilibrium are the following: Zero Benefits Condition:. Costi ³ Ingi . where Cost is the producer cost and Ing is the producers’ income. Market clearing: Di + Mi ³ Sj bij + Ei + RAi + GOVi where RA is the private consumption of the representative agent, GOV is government consumption and p are prices. – – – Budget Balance: Si pi Ai ³ wL + pk K + pr R + trn-I – – – where L , K , and R . are respectively the supply of labor, capital and natural resources, trn are transfers, and I is investment. Zero Benefits Condition: This restriction requires that at equilibrium, no producer receives any “excess” benefits; in other words, the value of inputs per unit of activity, Costt , must be equal to or greater than the product revenue, Ingt. The corresponding complementary variable for a zero benefits condition is the product (Yi ). Maintaining everything constant, if the price of the product of good i increases, production increases until the cost equals marginal revenue. Market clearing condition: The second class of equilibrium condition is that at the prices and levels of activity, the aggregate supply of a good i cannot be less than producers’ and consumers’ aggregate demand for that good. The corresponding complementary (dual) variable for the market clearing condition is the price ( pi, pk, pR, w in each case). Budget Balance Condition: The third condition is that at equilibrium, the value of each agent’s income (left side of the equation) is equal to the total value of their respective expenditures (right side of the equation). The model always works with utility functions that satisfy non-satiation and therefore Walras’ Law is fulfilled.. 4.. Characteristics of the 2005 social accounting matrix. A social accounting matrix (SAM) is an accounting framework that illustrates the flows of an economy’s income and expenses. It is also.
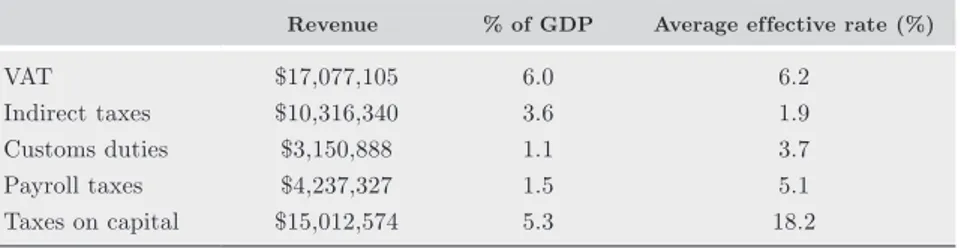
(13) Gustavo Hernández | PAYROLL TAXES AND THE LABOR MARKET. 111. a tool for describing the economy in a particular year and is useful as an input for developing simulations through multiplier analysis or CGE models. The 2005 SAM developed by Pardo and Corredor (2008)18 is used as the reference, with some modifications according to the characteristics of the model used. Table 3 presents a summary of the SAM developed for 2005. For that year, GDP is $285,380,153 million Colombian pesos, total consumption is 80.1% of GDP, investment equals 20.8% of GDP and there is a negative trade balance (exports less imports) on the order of 0.9% of GDP. Investment is financed in large part by private savings equal to 17.4% of GDP, government savings equal to 2.3% of GDP and there is a current account deficit equivalent to 1.1% of GDP. Furthermore, within the value added, payments on capital are on the order of 34.2% of GDP, while wages of formal sector workers are 33.2% of GDP and those of informal sector workers are 21.9% of GDP. On the other hand, we find that the tax burden is equivalent to 17.4% of GDP, with the VAT bringing in the largest amount (Table 4). It is important to clarify that ef fective rates rather than nominal rates are used for taxes; in other words, the rates found in national accounts are the ef fective collection rate that each of the taxes generates. For example, in the case of VAT, its nominal rate is around 16.0%, while the ef fective rate in national accounts is 10 points lower. This is because it includes all kinds of exemptions under the tax code, and also reflects the problem of evasion19. The same occurs with payroll contributions: the collection rate is 9.0%, but given the exemptions combined with tax evasion, the ef fective rate is 5.1% (Table 4). Before continuing, it is important to describe what is included in indirect taxes, as this explains some of the results. There are two categories of indirect taxes: Other taxes on products (excluding VAT and taxes on imports and exports) and taxes on products. According to the definition of national accounts, other taxes on products (excluding VAT and taxes on imports and exports) are taxes on goods and services that are imposed on the production, sale, transfer, rental or delivery of goods and services, or their use for self-consumption or for capital formation on one’s own behalf. Examples of this are specific taxes that are often levied on alcoholic 18. The methodology they follow is found in Hernández, Pardo and Corredor (2007), in which first they build a basic SAM based on the national accounts system, and then incorporate into it some characteristics of the labor market. 19. Steiner and Soto (1999) calculate a VAT evasion rate of 32.0%..
(14) $254,835,820. $52,732,637. Source: Author’s calculations.. $181,029,310. $165,800,717. $22,188,305. $228,518,845. Institutional sectors. $472,666,872. $472,651,716. $15,930,895. $165,098,414. Primary and secondary income assignation account. TOTAL. $562,689,567. $52,732,637. Taxes and subsidies. $56,159,006. $63,507,386. $254,835,820. Primary income generation account (value added categories). Capital account (investment). Rest of the world. Institutional sectors. Primary and secondary income assignation account. $4,013,868. Taxes and subsidies. $26,530,465. $254,835,820. $472,651,716. $213,802,028. Areas of economic activity. Primary income generation account (value added categories). Areas of economic activity. Goods and services. Goods and services. (Thousands of Colombian pesos 2005). Table 3. Macro-SAM for 2005. $79,438,282. $3,214,831. $15,228,593. $60,994,857. Rest of the world. $59,373,837. $59,373,837. Capital account (investment). $59,373,837. 79,438,282. $472,666,872. $181,029,310. $52,732,637. $254,835,820. $472,651,716. $562,689,567. Total. 112 LATIN AMERICAN JOURNAL OF ECONOMICS | Vol. 49 No. 1 (May, 2012), 99–123.
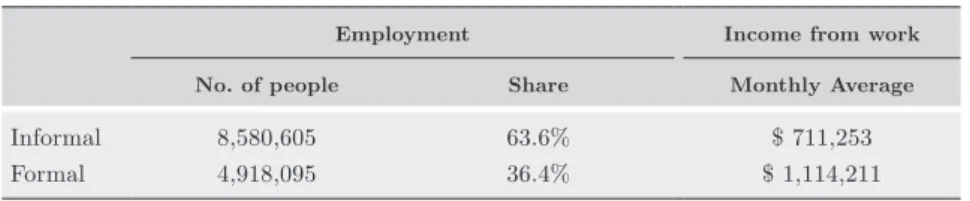
(15) 113. Gustavo Hernández | PAYROLL TAXES AND THE LABOR MARKET. Table 4. Tax revenue, SAM 2005 (Thousands of Colombian pesos 2005). Revenue. % of GDP. Average ef fective rate (%). VAT. $17,077,105. 6.0. 6.2. Indirect taxes. $10,316,340. 3.6. 1.9. Customs duties. $3,150,888. 1.1. 3.7. Payroll taxes. $4,237,327. 1.5. 5.1. Taxes on capital. $15,012,574. 5.3. 18.2. Source: Author’s calculations.. beverages, tobacco and fuels. On the other hand, taxes on products are taxes that must be paid for each unit of a good or service that is produced or distributed. The tax may consist of a specific amount of money per unit or service, or be set as an ad valorem percentage of the unit price, and it is always necessary to know the type of goods or services to which this kind of taxes apply. The breakdown of formal and informal workers follows the DANE definition, which considers workers informal if they have the following characteristics: i) employees and workers who work in establishments, businesses or private companies with 10 or fewer employees in all agencies and branches, ii) domestic employees, and iii) self-employed workers, except for independent professionals. Given these characteristics, findings show that 63.6% of workers are informal, while the remaining 36.4% of workers are considered formal. This informality rate is a little bit higher than the 58.8% found for 2005, according to DANE calculations, given the assumptions for calculating this figure. Table 5.. Earnings among different types of remuneration to factors Wage income. Private employee (+10) Private employee (-10) Government employee Day worker or laborer Domestic employee Independent professional Independent worker Boss or employer Worker on his/her own farm Source: Corredor and Pardo (2008). Formal remuneration Informal remuneration Formal remuneration Rural remuneration Informal remuneration -. Net earnings. Mixed formal income Mixed formal income Capital income Mixed formal income.
(16) 114. LATIN AMERICAN JOURNAL OF ECONOMICS | Vol. 49 No. 1 (May, 2012), 99–123. The following considerations are made for worker wages: People who work in the home and do not receive any kind of wage are not included in the breakdown of labor remuneration. It is assumed that the remuneration of owners or employers corresponds to capital earnings. Table 5 presents the correlative used between the labor classification that the 2003 Encuesta de Calidad de Vida (Quality of Life Survey) assigns to employed persons and the remuneration to factors used to prepare the SAM. In the SAM, it is assumed that all mixed income corresponds to labor income. Given this assumption, the labor remuneration for each type of labor is made up of the sum of the corresponding remuneration to salaried workers and mixed income. Table 6 summarizes the information concerning the share of remuneration and the labor force represented by the different kinds of labor. Table 6.. Remuneration and employment for the dif ferent types of labor Employment. Income from work. No. of people. Share. Monthly Average. Informal. 8,580,605. 63.6%. $ 711,253. Formal. 4,918,095. 36.4%. $ 1,114,211. Source: Corredor and Pardo (2008) and author’s calculations.. 5.. Simulations results. The objective is to evaluate dif ferent financing alternatives if payroll taxes are eliminated. In addition, although parafiscal contributions finance a large portion of the operations of the SENA and the ICBF and eliminating them entails negative social costs, funding of these institutions should not increase government expenditures, and therefore government savings (fiscal deficit or surplus) must be kept constant. Thus, the elimination of payroll taxes means that they must be substituted by another type of tax in order to generate permanent rather than temporary revenue, which would be the case when resorting to public debt. Three tax instruments are used for the simulation: VAT, indirect taxes and taxes on capital. Customs duties are not used as a source of financing, as there is currently a major ef fort underway to open up trade with new markets for Colombian exports through free trade agreements with diverse trading blocs or countries (including the European Union, Canada and the United States)..
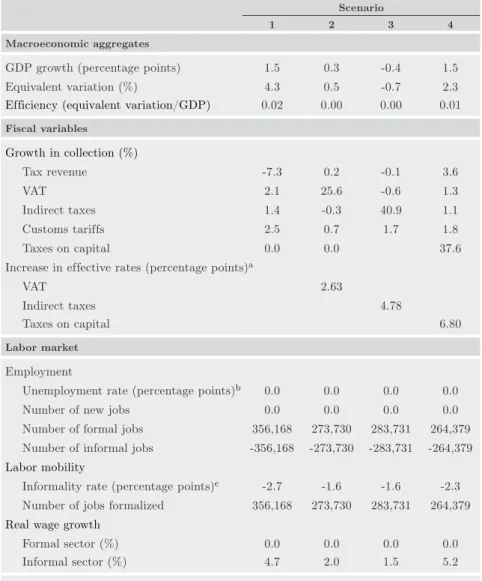
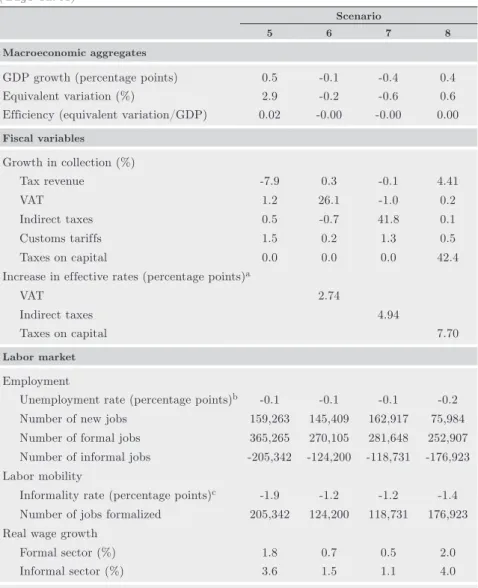
(17) Gustavo Hernández | PAYROLL TAXES AND THE LABOR MARKET. 115. The elimination of payroll taxes is analyzed under two dif ferent scenarios. The first assumes full employement of resources, which implies perfect mobility between sectors of labor; that is, a worker enters the formal sector because he or she left the informal sector (became formal) or vice versa. This type of scenario shows what occurs with sector reassignments when a price distortion is eliminated—in this case, payroll taxes in the formal labor sector—which helps counteract the results of scenarios that involve unemployment.It should be kept in mind that the results, that is, changes in the GDP or in well-being, indicate better functioning of the economy given of the new reallocation of resources (greater ef ficiency) and do not imply economic growth, because at no time are there factors that create growth. Then, to enrich the analysis a scenario is presented in which unemployment is introduced through a wage curve for formal labor, while informal labor is assumed to continue to be a competitive market. In addition, the decision to remain in the formal or informal labor market is introduced through a Harris-Todaro equation. This implies that informality, in addition to being a decision about relative prices, is also voluntary. Tables 7 and 8 show the dif ferent simulation scenarios. For scenarios 1 and 5, payroll taxes are reduced without any type of financing for family compensation funds, the SENA and the ICBF. In these scenarios, government savings fall, that is, there is a larger fiscal deficit. These scenarios are simulated in order to of fer a comparison of the ef fects on employment found in the partial equilibrium models. In the remaining scenarios, the reduction of tax revenues as a consequence of the elimination of payroll taxes is compensated by an increase in the VAT (scenarios 2 and 6), indirect taxes (scenarios 3 and 7) or taxes on capital (scenarios 4 and 8). As can be observed, the elimination of payroll taxes implies a reallocation of employment (scenario 1); in other words, the net effect is that formal employment increases, “formalizing” a significant number of workers. Now, it is important to remember that the increase in formal sector employment can be explained in dif ferent ways depending on the way in which the labor market is modeled. In the case of full utilization of resources, this is an ef fect of recomposition due to the employment of the distortion, while in the case of the wage curve, part of the increase comes from the informal workers but just over 40.0% comes from the unemployed..
(18) 116. LATIN AMERICAN JOURNAL OF ECONOMICS | Vol. 49 No. 1 (May, 2012), 99–123. Table 7. Simulations with full employment Scenario 1. 2. 3. 4. GDP growth (percentage points). 1.5. 0.3. -0.4. 1.5. Equivalent variation (%). 4.3. 0.5. -0.7. 2.3. Ef ficiency (equivalent variation/GDP). 0.02. 0.00. 0.00. 0.01. Macroeconomic aggregates. Fiscal variables. Growth in collection (%) Tax revenue. -7.3. 0.2. -0.1. 3.6. VAT. 2.1. 25.6. -0.6. 1.3. Indirect taxes. 1.4. -0.3. 40.9. 1.1. Customs tarif fs. 2.5. 0.7. 1.7. Taxes on capital. 0.0. 0.0. 1.8 37.6. Increase in ef fective rates (percentage points)a VAT. 2.63. Indirect taxes. 4.78. Taxes on capital. 6.80. Labor market. Employment Unemployment rate (percentage points)b. 0.0. 0.0. 0.0. Number of new jobs. 0.0. 0.0. 0.0. 0.0. Number of formal jobs. 356,168. 273,730. 283,731. 264,379. Number of informal jobs. -356,168. -273,730. -283,731. -264,379. 0.0. Labor mobility Informality rate (percentage points)c. -2.7. -1.6. -1.6. -2.3. 356,168. 273,730. 283,731. 264,379. Formal sector (%). 0.0. 0.0. 0.0. 0.0. Informal sector (%). 4.7. 2.0. 1.5. 5.2. Number of jobs formalized Real wage growth. Source: Author’s calculations. a. The effective rates are: VAT 6.2%, indirect taxes 1.9%, customs tariffs 3.7% and taxes on capital 18.2% b. The unemployment rate in the base scenario is 11.7% c. The informality rate in the base scenario is 63.57%. However, in scenarios 1 and 5, as in the other scenarios, it is evident that informality rates fall but only slightly, between 1.2 and 2.7 percentage points. This result is quite close to what has been found in estimates of the transition matrices between formal and informal labor. Mondragon, Peña and Wills (2010) obtained similar results when.
(19) Gustavo Hernández | PAYROLL TAXES AND THE LABOR MARKET. 117. estimating such a matrix: They found that between June 1997 and June 1998, 40.0% of informal workers continued to work informally, while only 12.1% moved from informal to formal jobs. On the other hand, these results show that informality in Colombia is more of an exclusion phenomenon than an escape phenomenon, that is, people are not able to obtain access to certain benefits due to institutional regulations. However, Bernal (2009) founds that half of independent workers would not accept a formal job with benefits for the same salary or a lower one. This is evidence that people work in the informal labor market because of personal choice, and not because they have not had opportunities to enter the formal market. There are two indicators that enable observation of the ef ficiency of payroll taxes in this model. The first is the change in GDP. This indicator may be interpreted thus: i) when the tax is eliminated, how much additional output can the economy produce as a result of the removal of the distortion, and ii) given that there is a new tax, how much will the economy produce or cease to produce as a result of this new distortion. Furthermore, another indicator is reported, this time from the regulatory point of view. This is the equivalent variation in percentage terms, which shows how much well-being increases or decreases as a result of the change in taxes. In the first case, in terms of GDP the elimination of payroll taxes results in a change of 1.5% (scenarios 1 and 5) because the distortion no longer exists. However, the incorporation of rigidity into the labor market reduces this by one percentage point. This is evidence of the distortion created by these taxes on the economy, which occurs because in the formal labor market quantities adjust rather than prices. Well-being is expected to experience a positive change, since it reflects consumption, and the suppression of payroll taxes implies higher take-home wages for consumers, who can therefore spend more. It should be noted that in both cases—full employment of resources or unemployment—the most ef ficient tax is that levied on capital. This is because increased collection of this tax generates smaller distortions of the economy. However, the ef fort that must be made to increase tax collection is significant, since collection has to increase by 37.6% (scenario 4) and 42.4% (scenario 8) to maintain the fiscal deficit constant. This would be equivalent to an increase in the ef fective rate of tax on capital by 6.8 (scenario 4) and 7.7 (scenario 8) percentage points. It should be mentioned that this is a short-term model that does not provide information about the long-term consequences of.
(20) 118. LATIN AMERICAN JOURNAL OF ECONOMICS | Vol. 49 No. 1 (May, 2012), 99–123. economic ef fects. Increased taxes on capital could lead to negative results in terms of GDP growth. As indicated by Escobar et al. (2003) the long-term ef fect of taxes on capital is a decline in GDP caused by lower accumulation of capital stock. Regarding financing through the VAT, it should be taken into account that this also has negative consequences, because an increase in this tax implies a reduction in household consumption. On the other hand, technically it can be much easier to increase the collection rates, in terms of monitoring and enforcement. In addition, the rate increase would only be around 2.7 percentage points. Now, if we observe the results of financing through indirect taxes, the findings show that these are the least ef ficient taxes since they directly distort production costs. Moreover, two aspects have to be considered: i) there are many specific taxes (for example, on tobacco or liquor), but depending on the size of the sector, an increase of this kind can hurt the sector to the point that it disappears, and ii) many of these taxes are handled by municipalities, so their collection is often not the responsibility of the central government. In this case the rate increase is 4.8 percentage points because the collection rate is one of the lowest among government tax revenues. Here, it is important to remember that the model works with ef fective rather than nominal rates. This implies that two factors are implicit in the average rates: evasion and tax exemptions. As a consequence, a tax reform must be focused on achieving an increase in ef fective rates, such that greater ef ficiency in the tax administration or a reduction in tax exemptions would be an ef fective tool to achieve these goals. The results show that in terms of the labor market, there is a reduction in the unemployment rate (scenarios 5 to 8) but this reduction is quite small, as it only reaches one percentage point. This is due in part to the fact that at least 53.6% of the increase in formal employment consists of workers who were already in the labor market as informal workers and the remaining 47.4% consists of workers who were unemployed. On the other hand, the elimination of payroll taxes results in an increase in wages in the formal sector, but the wage increase in the informal sector is due to the fact that this market behaves like a perfectly competitive market, such that the departure of workers generates wage pressure to retain them. As can be seen in scenarios 1 to 4, wages in the formal sector do not rise even though payroll taxes have been eliminated. This is because.
(21) 119. Gustavo Hernández | PAYROLL TAXES AND THE LABOR MARKET. Table 8. Simulations with unemployment (wage curve) Scenario 5. 6. 7. 8. GDP growth (percentage points). 0.5. -0.1. -0.4. 0.4. Equivalent variation (%). 2.9. -0.2. -0.6. 0.6. Efficiency (equivalent variation/GDP). 0.02. -0.00. -0.00. 0.00. Macroeconomic aggregates. Fiscal variables. Growth in collection (%) Tax revenue. -7.9. 0.3. -0.1. 4.41. VAT. 1.2. 26.1. -1.0. 0.2. Indirect taxes. 0.5. -0.7. 41.8. 0.1. Customs tarif fs. 1.5. 0.2. 1.3. 0.5. Taxes on capital. 0.0. 0.0. 0.0. 42.4. Increase in ef fective rates (percentage points)a VAT. 2.74. Indirect taxes. 4.94. Taxes on capital. 7.70. Labor market. Employment Unemployment rate (percentage points)b. -0.1. -0.1. -0.1. -0.2. Number of new jobs. 159,263. 145,409. 162,917. 75,984. Number of formal jobs. 365,265. 270,105. 281,648. 252,907. Number of informal jobs. -205,342. -124,200. -118,731. -176,923. -1.9. -1.2. -1.2. -1.4. 205,342. 124,200. 118,731. 176,923. Formal sector (%). 1.8. 0.7. 0.5. 2.0. Informal sector (%). 3.6. 1.5. 1.1. 4.0. Labor mobility Informality rate (percentage points)c Number of jobs formalized Real wage growth. Source: Author’s calculations. a. The effective rates are: VAT 6.2%, indirect taxes 1.9%, customs tariffs 3.7% and taxes on capital 18.2% b. The unemployment rate in the base scenario is 11.7% c. The informality rate in the base scenario is 63.57%. this is a net effect. In other words, initially wages increase due to cost reductions, but this attracts people working in the informal market. Because the informal market behaves like a perfectly competitive market, there is downward pressure on salaries, and the initial effect is canceled.
(22) 120. LATIN AMERICAN JOURNAL OF ECONOMICS | Vol. 49 No. 1 (May, 2012), 99–123. out. But this does not occur in scenarios 5 to 8, as they operate in a market where the adjustment affects wages more than quantities.. 6.. Conclusions. A computable general equilibrium model has been used to show the ef fect of an elimination of payroll taxes, taking into account secondbest ef fects on the economy. To perform the exercise, it was assumed that the elimination of payroll taxes would not have any impact on the fiscal deficit, that is, public savings are maintained constant in absolute terms. To achieve this, payroll taxes are substituted by other types of taxes (VAT, indirect taxes and tax on capital), applying a rate endogenous to the tax system. These taxes can generate more or fewer distortions than payroll taxes. Additionally, the labor market is considered to be segmented into formal and informal employment, and a non-competitive labor market is also included (for the formal sector) through the introduction of a wage curve. The experiments show that in the labor market there is a very small ef fect on the unemployment rate, equivalent to a reduction of one percentage point. When payroll taxes are substituted, the ef fect on the unemployment rate is canceled out, due to the behavior of the labor market. In regard to formalization of employment, the simulations show that the informality rate changes only slightly, by about one percentage point. This result reveals that the phenomenon of informality in Colombia is explained by a hypothesis of exclusion rather than escape in the labor market20; in other words, the institutional framework of the Colombian labor market is more influential than workers’ wage conditions. Although not presented here, the increase in taxes on capital could result in harmful consequences for the economy. This is because despite the positive ef fects in the short term—greater ef ficiency of the tax and increased formalization of the labor market—the rate of investment in the economy is af fected, potentially jeopardizing growth. Therefore, what is observed is that a change in VAT rates could lead to results that would certainly have a negative ef fect on output.. 20. As informality in Latin America has been characterized by the World Bank (Perry, et al. 2007)..
(23) Gustavo Hernández | PAYROLL TAXES AND THE LABOR MARKET. 121. Even though our findings are similar to of partial equilibrium analyses, in that the elimination of payroll taxes reduces unemployment (albeit to a lesser extent), it is apparent financing through other taxes dilutes the positive ef fects on the economy, reducing them to zero or transforming them into negative ef fects in some cases, as a consequence of the interrelationships in the economy..
(24) 122. LATIN AMERICAN JOURNAL OF ECONOMICS | Vol. 49 No. 1 (May, 2012), 99–123. REFERENCES Alm, J. and H. López-Castaño (2005), “Payroll taxes in Colombia,” Andrew Young School of Policy Studies, Georgia Tech University, Working Paper 06-36. Arango, L.E., N. Obando, and C.E. Posada (2010), “Sensibilidad de los salarios al desempleo regional en Colombia: nuevas estimaciones de la curva de salarios,” Banco de la República, Borradores de Economía, No. 590. Arango, L.E. and C.E. Posada (2006), “La tasa de desempleo de largo plazo en Colombia,” Banco de la República, Borradores de Economía, No. 388. Bernal, R. (2009), “The informal labor market in Colombia: identification and characterization,” Desarrollo y Sociedad, Vol. 63: 145-208. Blanchflower, D. and A. Oswald. (1994), The Wage Curve, Cambridge: MIT Press. Böhringer, C., S. Boeters, and M. Feil (2005), “Taxation and unemployment: an applied general equilibrium approach,” Economic Modelling, Vol. 22: 81-108. Böhringer, C., T. Rutherford, and W. Wiegard (2003), “Computable general equilibrium analysis: opening a black box,” ZEW Discussion Paper 56. Cárdenas, M. and R. Bernal (2003), “Determinants of labor demand in Colombia,” in Heckman, J. and C. Pagés, eds., Law and Employment: Lessons from Latin America and the Caribbean, National Bureau of Economic Research, University of Chicago Press. Cárdenas, M. and C. Mejía (2007), “Informalidad en Colombia: nueva evidencia,” Fedesarrollo, Documento de Trabajo, No. 35. Cárdenas, M. and V. Mercer-Blackman (2006), “Análisis del sistema tributario colombiano y su impacto sobre la competitividad,” Fedesarrollo, Cuadernos de Fedesarrollo No. 19. Cepeda, F., E. López, and M. Ripoll (1994), “Crónica de los modelos de equilibrio general en Colombia,” Banco de la República, Borradores de Economía, No. 13. Escobar, A., G. Hernández, G. Piraquive, and J.M. Ramírez (2003), “Elementos para el análisis de incidencia tributaria,” Departamento Nacional de Planeación, Archivos de Economía, No. 224. Farne, S. (2010). “La parafiscalidad laboral en Colombia,” Universidad Externado de Colombia, Boletín del Observatorio del Mercado de Trabajo y la Seguridad Social, No. 12. Gaviria, A. and J. Nuñez (2003), “Evaluating the impact of SENA on earnings and employment,” Departamento Nacional de Planeación, Archivos de Economía No.220. Hernández, G., O. Pardo, and D. Corredor (2007), “Construcción de una matriz de contabilidad social 2003 para Colombia,” document prepared for the Regional Conference on Computable General Equilibrium Models: Contributions to Economic Policy in Latin America and the Caribbean, Santiago, Chile. Hutton, J. and A. Ruocco (1994), “Tax reform and employment in Europe,” International Tax and Public Finance, Vol. 6, No. 3: 263-287..
(25) Gustavo Hernández | PAYROLL TAXES AND THE LABOR MARKET. 123. Iregui, A.M., A. Melo and M.T. Ramírez (2010), “Downward wage rigidities and other firms’ responses to an economic slowdown: evidence from a survey of Colombian firms,” Banco de la República, Borradores de Economía, No. 612. Kugler, A. and M. Kugler (2009), “Labor market ef fects of payroll taxes in developing countries: evidence from Colombia,” Economic Development and Cultural Change, Vol. 57, No. 2: 335-358. Light, M. and T. Rutherford(2002), “A general equilibrium model for tax policy analysis in Colombia,” Departamento Nacional de Planeación, Archivos de Economía No. 188. Mathiesen, L. (1985), “Computational experience in solving equilibrium models by a sequence of linear complementarity problems,” Operations Research, Vol. 33, No. 6: 1225-1250. Mondragon, C., X. Peña, and D. Wills (2010), “Labor market rigidities and informality in Colombia,” Universidad de los Andes, Documentos CEDE, No. 7. Pardo, O. and D. Corredor (2008), “Matrices de contabilidad social 2003, 2004, 2005 para Colombia,” Departamento Nacional de Planeación, Archivos de Economía No. 339. Perry, G., W. Maloney, O. Arias, P. Fajnzylber, A. Mason, and J. SaavedraChanduvi (2007), “Informalidad, escape y exclusión” (executive summary), World Bank. Ramos, R., J. Duque, and J. Surinach (2009), “Is the wage curve formal or informal? Evidence for Colombia,” Economics Letters, Vol. 109, No. 2: 63-65. Rutherford, T. (1999). “Applied general equilibrium modeling with MPSGE as a GAMS subsystem: an overview of the modeling framework and syntax,” Computational Economics, Vol. 14, Nos. 1-2: 1-46. Sánchez, F. and J. Núñez (1998), “La curva de salarios para Colombia: una estimación de las relaciones entre el desempleo, la inflación y los ingresos laborales, 1984-1996,” Departamento Nacional de Planeación, Archivos de Economía No. 80. Sánchez, F., V. Duque, and M. Ruiz (2009), “Costos laborales y no laborales y su impacto sobre el desempleo, la duración del desempleo y la informalidad en Colombia, 1980-2007,” Universidad de los Andes, Documentos CEDE, No. 11. Steiner R. and C. Soto (1999). “Cinco ensayos sobre tributación en Colombia,” Fedesarrollo, Cuadernos de Fedesarrollo, No. 6. Todaro, M. (1969), “A model of labor migration and urban unemployment in less developed countries,” The American Economic Review, Vol. 59, No. 1: 138-148..
(26)
(27)
Figure

+4
Documento similar
Government policy varies between nations and this guidance sets out the need for balanced decision-making about ways of working, and the ongoing safety considerations
The expansionary monetary policy measures have had a negative impact on net interest margins both via the reduction in interest rates and –less powerfully- the flattening of the
The movements analysed in the report date from 2004 to 2020, in which we can observe different types of acquisitions in which several aspects have been analysed: the price of
The spatially-resolved information provided by these observations are allowing us to test and extend the previous body of results from small-sample studies, while at the same time
Summarizing, even if the non-completeness of General Relativity in the ultra-violet leads us to consider it as an effective field theory, valid up to a scale of M p ∼ 10 19 GeV,
(hundreds of kHz). Resolution problems are directly related to the resulting accuracy of the computation, as it was seen in [18], so 32-bit floating point may not be appropriate
Una vez el Modelo Flyback está en funcionamiento es el momento de obtener los datos de salida con el fin de enviarlos a la memoria DDR para que se puedan transmitir a la
Even though the 1920s offered new employment opportunities in industries previously closed to women, often the women who took these jobs found themselves exploited.. No matter
