User experience monitoring : |b a path towards quality of service in the educational system
178
0
0
Texto completo
(2) ii PONTIFICIA UNIVERSIDAD CATOLICA DE CHILE SCHOOL OF ENGINEERING. USER EXPERIENCE MONITORING: A PATH TOWARDS QUALITY OF SERVICE IN THE EDUCATIONAL SYSTEM LEONARDO ANDRÉS MADARIAGA BRAVO. Members of the Committee: MIGUEL NUSSBAUM LIOUBOV DOMBROVSKAIA MARCOS SEPÚLVEDA JOSÉ MANUEL ALLARD MARIJN JANSSEN. Thesis submitted to the Office of Research and Graduate Studies in partial fulfilment of the requirements for the Degree of Doctor in Engineering Sciences Santiago, Chile, August 2018.
(3) iii. To Carolina, Alonso and Felipe, for their support and providing purpose to this journey.
(4) iv. ACKNOWLEDGEMENTS I would like to thank everyone who has helped in my development as a researcher, particularly my family and friends. A special thank you to Professor Miguel Nussbaum, who has provided me with his unconditional support and dedication over the doctoral process. Without him, none of this would have been possible.. I would also like to thank everyone who has worked with me in some way during my research: Isabelle Burq, Faustino Marañón, Manuel Aldunate, Tomás Ozzano, Cristóbal Alarcón and María Alicia Naranjo.. I would also like to thank Pontifical Catholic University of Chile and particularly the Computer Science Department and the Engineering Graduate Studies Office for the support and delivering a superb learning experience over the course of these last years.. Finally, the corresponding author would like to thank Comisión Nacional de Investigación Científica y Tecnológica (CONICYT) for financial support of his Doctoral studies. Grant: CONICYT-PCHA/ Doctorado Nacional/2016- 21160787..
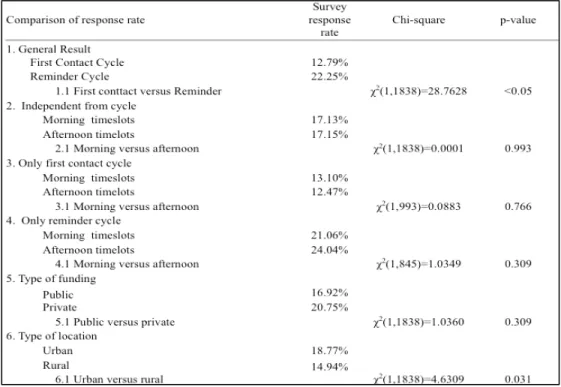
(5) v. INDEX ACKNOWLEDGEMENTS .................................................................................................................... IV RESUMEN .............................................................................................................................................. IX ABSTRACT ............................................................................................................................................ XI 1. INTRODUCTION ................................................................................................................................13 1.1 CONCEPTUAL FRAMEWORK: INFORMATION ARTIFACT .......................................................................13 1.2 USER EXPERIENCE AND QUALITY OF SERVICE ...................................................................................17 1.3 GENERAL AND SPECIFIC GOALS OF THE THESIS PROJECT ....................................................................20 1.4 QUALITY PROCESSES IN EDUCATION & INFORMATION DEMAND .........................................................21 1.5 INFORMATION FOR QUALITY: STAKEHOLDERS AND INTERACTIONS .....................................................25 1.6 USAGE OF INFORMATION ARTIFACTS: LEVELS OF INTERACTIVITY ......................................................32 1.7 TOWARDS QUALITY OF SERVICE: USER EXPERIENCE OF LOW LEVEL INTERACTIVITY ARTIFACTS..........36 1.8 PROBLEM STATEMENT ......................................................................................................................39 1.9 THESIS METHODOLOGY AND OUTLINE ..............................................................................................41 2. USER EXPERIENCE OF LEARNING MATERIALS: A FRAMEWORK FOR ASSESSMENT....47 2.1 INTRODUCTION .................................................................................................................................47 2.2 THEORETICAL FRAMEWORK ..............................................................................................................49 2.2.1 User evaluation in Education....................................................................................................49 2.2.2 Student perception of Learning Materials .................................................................................55 2.3 METHOD ..........................................................................................................................................58 2.3.1 Stages of the study ....................................................................................................................58 2.3.2 Participants..............................................................................................................................60 2.3.3 Development of Assessment Framework....................................................................................61 2.3.4 Data Analysis ...........................................................................................................................64 2.4 RESULTS ..........................................................................................................................................66 2.4.1 Research Question 1.................................................................................................................66 2.4.2 Research Question 2.................................................................................................................68 2.5 CONCLUSION ....................................................................................................................................73 2.6 LIMITATIONS AND FUTURE WORK ......................................................................................................75 3. ONLINE SURVEY: A NATIONAL STUDY WITH SCHOOL PRINCIPALS.................................77 3.1 INTRODUCTION .................................................................................................................................77 3.2 LITERATURE REVIEW ........................................................................................................................79 3.2.1 Impact of email scheduling on response rate and response time ................................................79 3.2.2 Influence of embedding surveys in an email ..............................................................................84 3.3 RESEARCH METHOD ..........................................................................................................................85 3.3.1 Procedure for Study 1: Effect of email scheduling on response rate and response time ..............85 3.3.2 Procedure for Study 2: Effects of embedding the survey in an email on response rate and response time ....................................................................................................................................87 3.3.3 Participants..............................................................................................................................88 3.3.4 Measurements and data analysis...............................................................................................89 3.4. RESULTS .........................................................................................................................................90 3.4.1 Effects of email scheduling on response rate .............................................................................90 3.4.2 Effects of email scheduling on response time .............................................................................92 3.4.3 Effect of embedding survey in email on response rate and response time ...................................96 3.5 DISCUSSION AND CONCLUSIONS ........................................................................................................99 3.6 LIMITATIONS AND FUTURE WORK .................................................................................................... 102.
(6) vi. 4. USER EXPERIENCE OF PUBLIC SERVICE INFORMATION .................................................... 103 4.1 INTRODUCTION ............................................................................................................................... 103 4.2 LITERATURE REVIEW ...................................................................................................................... 105 4.2.1. What is Public Service Information? ...................................................................................... 105 4.2.2 Public Service Information as Usable Products....................................................................... 108 4.3 RESEARCH METHOD ....................................................................................................................... 114 4.3.1 Method used to answer the first research question: How can Public Service Information (PSI) materials be classified in terms of User Experience? ....................................................................... 116 4.3.2 Sample for first research question........................................................................................... 116 4.3.3 Definition of dimensions for classifying UX............................................................................. 117 4.3.4 Method used to answer the second research question: How can the User Experience of PSI be monitored over time in order to inform design decisions? ................................................................ 121 4.3.5 Survey design: Dimensions for assessing User Experience ...................................................... 121 4.3.6 Sample for second research question ...................................................................................... 126 4.3.7 Focus group design ................................................................................................................ 127 4.4 RESULTS ........................................................................................................................................ 130 4.4.1 PSI-Classification................................................................................................................... 130 4.4.2 Validating and redefining the main interaction goals .............................................................. 132 4.4.4 Focus group results ................................................................................................................ 137 4.5 DISCUSSION, CONCLUSIONS, LIMITATIONS AND FUTURE WORK ....................................................... 139 5. RESEARCH LIMITATIONS, CONCLUSIONS AND FUTURE WORK ....................................... 144 5.1 RESEARCH LIMITATIONS ................................................................................................................. 144 5.2 CONCLUSIONS ................................................................................................................................ 145 5.3 FUTURE WORK ................................................................................................................................ 149 REFERENCES ...................................................................................................................................... 151 APPENDIX ............................................................................................................................................ 171 APPENDIX A: SURVEY FOR STAGE 3 ...................................................................................................... 172 APPENDIX B: SURVEY FOR STAGE 4 ...................................................................................................... 173 APPENDIX C: EMAIL MESSAGE .............................................................................................................. 174 APPENDIX D: SURVEY QUESTIONS ........................................................................................................ 175 APPENDIX E: WEB LINK AND EMBEDDED EMAIL DESIGN ........................................................................ 176 APPENDIX F: ROLES WITHIN THE QUALITY OF EDUCATION AGENCY’S INFORMATION DIVISION AND THE UNIVERSITY RESEARCH TEAM ............................................................................................................... 177 APPENDIX G: STAKEHOLDERS OF PUBLIC SERVICE INFORMATION PRODUCED BY THE QUALITY OF EDUCATION AGENCY ........................................................................................................................... 177 APPENDIX H: FOCUS GROUP PARTICIPANTS .......................................................................................... 178.
(7) vii. INDEX OF FIGURES. Figure 1. Information System components .......................................................................16 Figure 2. Choice framework .............................................................................................17 Figure 3. Choice framework extended to the thesis...........................................................19 Figure 4. A new framework for Quality Assurance in Chile .............................................24 Figure 5. Information flow and levels within the Quality in Education System .................28 Figure 6. A three-way model applied to computer-initiated interactivity...........................37 Figure 7. A three-way model relating Information provider and information user .............39 Figure 8. User Experience with regards to the Quality in Education system......................40 Figure 9. Chapters relation to the initial context of research .............................................42 Figure 10. Summary of Methodology and current status of results ...................................45 Figure 11. Stages of Research ..........................................................................................60 Figure 12. Assessment framework....................................................................................62 Figure 13. Process of sending email invitations and scheduling reminders........................86 Figure 14. Total response time versus Total completed surveys ........................................96 Figure 15. Initial model for monitoring User Experience, based on the work by Dragunalescu (2002) ......................................................................................................113 Figure 16. Stages of the research project ........................................................................116 Figure 17. Graphical representation for classifying PSI ..................................................120 Figure 18. Model for the classification, monitoring and design processes .......................124 Figure 19. Classification of a sample of PSI materials. N.B., there are fewer than 57 items included in the model as many of these were duplicated. ................................................131 Figure 20. Redefining the classification model. N.B., there are fewer than 89 items included in the model as many of these were duplicated. ................................................133 Figure 21. Classification and survey results for 2015 and 2016 Results Report for School Principals and Teachers..................................................................................................135 Figure 22. Final model for classifying PSI and assessing User Experience ....................142 Figure 23. A general perspective over agents and information flow for government-based information ....................................................................................................................147 Figure 24. Quality of Service based on the three-way model between information provider an information user ........................................................................................................148.
(8) viii. INDEX OF TABLES. Table 1. Examples of information artifacts in the Quality of Education System ................30 Table 2. Usage Assessment of information artifacts related to Quality in Education .........34 Table 3. Methodology and its relation to the thesis outline ...............................................43 Table 4. Usage studies of information artifacts in education .............................................50 Table 5. Student assessment of Learning Materials..........................................................55 Table 6. Sample of study ..................................................................................................60 Table 7. Main topics of the survey responses....................................................................61 Table 8. Survey structure .................................................................................................62 Table 9. Student Experience of Podcast vs. Study Guide ..................................................66 Table 10. General User Experience of Learning Materials ................................................69 Table 11. Perception of Learning Materials by gender......................................................71 Table 12. Perception of Learning Materials by instructional cycle ...................................72 Table 13. Literature review of technique tools used in the study .......................................80 Table 14. Study samples ..................................................................................................89 Table 15. Operational measurements of the study.............................................................90 Table 16. Summary statistics for the data collected on response rate ................................91 Table 17. Effect of email scheduling and contextual variables on response rate ................91 Table 18. Summary statistics for the data collected on response time ...............................92 Table 19. Effect of email scheduling on response time for completing the survey.............93 Table 20. Effect of timing on response time for opening email .........................................94 Table 21. Effect of timing on response time for clicking on the link to the survey ............95 Table 22. Summary of coded response time for each of the three elapsed times...............95 Table 23. Summary statistics for comparison of embedded survey versus survey sent as link ..................................................................................................................................97 Table 24. Effect of survey type on response rate..............................................................97 Table 25. Effect of survey type on response time ............................................................98 Table 26. Classifications of Public Service Information documented in the literature .....106 Table 27. Summary of the literature regarding the assessment of the use of Public Service Information in e-gov ......................................................................................................109 Table 28. Sample of PSI materials initially selected for the study ...................................117 Table 29. Interaction goals .............................................................................................118 Table 30. Summary of main factors for assessing UX taken from previous studies for a given PSI .......................................................................................................................122 Table 31. Summary of User Experience dimensions covered by the survey ....................125 Table 32. Summary of the assessment of User Experience for a given PSI product........126 Table 33. Focus group statements..................................................................................129 Table 34. Structure for coding participants’ statements ..................................................129 Table 35. Redefining the main interaction goals ............................................................132 Table 36. Summary of responses to the questions on the survey .....................................136 Table 37. Summary of the statements made during the focus group................................138.
(9) ix. MONITOREO DE EXPERIENCIA DE USUARIO: UN CAMINO HACIA LA CALIDAD DEL SERVICIO EN EL SISTEMA EDUCACIONAL Tesis enviada a la Dirección de Postgrado en cumplimiento parcial de los requisitos para el grado de Doctor en Ciencias de la Ingeniería. LEONARDO ANDRÉS MADARIAGA BRAVO. RESUMEN En un sistema de entrega de información compuesto por actores heterogéneos que se informan entre sí en diferentes niveles, la calidad del servicio se relaciona con un equilibrio general entre las necesidades y los objetivos del usuario y del proveedor de la información. En la última década, el flujo de artefactos de información, en cualquier contexto, se ha incrementado significativamente: desde datos simples, figuras, tablas, hasta informes organizados, formularios, sitios web, plataformas de datos abiertos, aplicaciones, entre muchos otros. A pesar de una serie de esfuerzos para garantizar el acceso, la estandarización y la facilidad de uso, gran parte de los artefactos de información no cumplen con un uso efectivo. En el contexto de esta tesis la visión general apunta a que para garantizar el uso de la información, los proveedores de información deben recibir retroalimentación constante por parte de los usuarios para comprender si realmente se cubren sus necesidades de información. Se generó y probó un modelo para el Monitoreo de la Experiencia del Usuario dentro del Sistema Educativo de Chile, que abarca artefactos de interactividad de bajo nivel en dos tipos de interacción: Gobierno a Instituciones Educativas e Instituciones Educativas a Estudiantes. Esta tesis proporciona un modelo y herramienta para comenzar a implementar procesos centrados en el usuario en el.
(10) x. contexto de la entrega de información pública para avanzar hacia la Calidad de Servicio, debido a que las organizaciones tanto públicas como eudativas pueden mejorar el diseño de sus artefactos de información en base a una mejor comprensión de sus usuarios.. Palabras clave: experiencia de usuario, monitoreo, artefactos de información, información de servicio público, calidad de la información, interacción con computadora humana.. Miembros de la Comisión de Tesis Doctoral:. MIGUEL NUSSBAUM LIOUBOV DOMBROVSKAIA MARCOS SEPÚLVEDA JOSÉ MANUEL ALLARD MARIJN JANSSEN.
(11) xi. USER EXPERIENCE MONITORING: A PATH TOWARDS QUALITY OF SERVICE IN THE EDUCATIONAL SYSTEM. Thesis submitted to the Office of Graduate Studies in partial fulfilment of the requirements for the Degree of Doctor in Engineering Sciences by. LEONARDO ANDRÉS MADARIAGA BRAVO. ABSTRACT. In a system of heterogeneous actors informing each other in different levels, Quality of Service relates to an overall balance between the needs and goals of the information user of government information (e.g. documents, patents, reports, among many others) and the information provider (i.e. public services). In the last decade the stream of information artifacts, in any context, has augmented significantly: from simple data, figures, tables, to organized reports, forms, websites, open data platforms, apps, among many others. Despite a series of efforts to ensure accessibility, standardization and ease of use, much of the information artefacts does not meet effective usage. In the context of this thesis, the general vision is that it in order to ensure information usage, information providers need to have constant feedback from users to understand if their information needs are being actually covered. A model for User Experience Monitoring was generated and tested within Chile’s.
(12) xii Education System, covering low-level interactivity artifacts in two types of interaction: Government to Educational Institutions and Educational Institutions to Students. This thesis provides a model and tool to start implementing user-centered processes in the context of information delivery towards advancing to Quality of Service, due to the fact that organizations can improve the design of their information artifacts based on a greater comprehension of their users.. Keywords: User Experience, Monitoring, Information Artifacts, Public Service Information, Information Quality, Human Computer Interaction.. Members of the Doctoral Committee: MIGUEL NUSSBAUM LIOUBOV DOMBROVSKAIA MARCOS SEPÚLVEDA JOSÉ MANUEL ALLARD MARIJN JANSSEN.
(13) 13 1. INTRODUCTION 1.1 Conceptual framework: Information Artifact In the context of e-government, user-centered evaluation has been implemented as a medium to improve the quality of the service (Kumar et al, 2017). However, in this context citizen consultations are applied mainly to information products with higher levels of interactivity such as websites, portals or mobile applications (Wani et al, 2017). Less attention has been made to those products with lower levels of interactivity, such as digital or paper-based forms (two-way interactivity) or non-interactive products such as text-based reports, laws, maps, infographics and documentation in general. The latter, still represent a large part of the user experience with regards to public services, particularly in context where citizen information needs revolve around access to content, either digital or non-digital. Organisms such as the United Nations has stated diverse concerns with regards to the low level of usage of information products delivered by public services, stating: "The data itself has no value. Innovative strategies are needed to increase the use of data and promote a demand-driven perspective. Other requirements for the use of data are: accessibility, reliability, accuracy and usability of the data, knowledge and confidence in the data shared by governments. (United Nations, 2016) A considerable body of research has studied dimensions affecting efficient information usage: digital inclusion (Mesa & Martínez-Monje, 2013), information literacy (Cestnik & Kern, 2014), information seeking behaviors (Wang & Chen, 2012), among others. This.
(14) 14 asymmetry, between information provision and information usage drive the main problem confronted by this thesis, which has been stated as: How can an organization improve the User Experience of the information artifacts it generates? In this work, we will understand “information artifact” as a sub-component of the Information System construct.. In the framework proposed by Lee et al (2015), the. Information System Artifact is the resulting interaction between the “technology artifact”, the “information artifact” and the “social artifact”. Each of this components are defined as: •. Technology artifact: human-created tool whose main reason to exist is to solve a problem, achieve a goal or serve a purpose that is human defined, human perceived or human felt. Technology artifacts may include not only those that are described as digital or electronic (such as a mobile phone, a FaceBook page, a memory stick, a pdf file and a hardware-software-data-network system) but also those that are nondigital and non-electronic (such as a face-to-face meeting, a billboard, a person’s memory, a book and a library). •. Information artifact: an instantiation of information, where the instantiation occurs through a human act either directly (as could happen through a person’s verbal or written statement of a fact) or indirectly (as could happen through a person’ s running of a computer program to produce a quarterly report). Examples of information artifacts are (1) numbers, letters or other symbols that are themselves devoid of content (hence, ‘tokens’), but to which content can be described and with which the content can then be processed; (2) relationships among numbers,.
(15) 15 letters or other symbols (literally, a ‘syntax’), of which a special case is the algebraic relationships among variables and constants in an equation and another special case is the grammatical relationships among words and punctuation marks in a sentence or paragraph; (3)accounting numbers that form the meaning of (and therefore are a ‘representation’ of) a real world financial situation; and (4) a perception or observation of a ‘difference that makes a difference’ in a system. •. Social Artifact: artifact that consists of, or incorporates, relationships or interactions between or among individuals through which an individual attempt to solve one of his or her problems, achieve one of his or her goals or serve one of his or her purposes. We describe this artifact as social because relationships and interactions involve more than just one person; hence, they involve the social, not just the individual. Defined in this way, social artifacts can include persistent social objects that involve already established relationships (such as kinship structures, institutions, roles, cultures and laws) as well as one-off ephemera in one-off interactions (such as an utterance in a conversation, a decision made in a committee meeting, a purchase made in a retail transaction and a charitable act).. This definition broadens the perspective of the design of an informational experience, providing equal importance to measuring the user experience of an information system, separating, technology used for the communication (i.e website), information artifact (i.e. content of the website) with the social interaction around the system (i.e. website demo provided by a person). The scope of this thesis is to understand the interaction with information artifacts, as depicted in figure 1..
(16) 16 Figure 1. Information System components. An important consequence of using this conceptual framework, is that enhancing User Experience of a government information system is not only related to measuring and redesigning the technological artifact (i.e. government website, portal), but it also requires a systemic enhancement action covering the other two components, the information artifact (i.e. the content of the website) and the social artifact (i.e. the face-to face events that are used to disseminate the website and its content)..
(17) 17 1.2 User Experience and Quality of Service As public sector moves towards greater integration of Information and Communication Technologies (ICT) in its service provision, citizen can acquire greater access to tools, content and processes to enhance their quality of life (Bell & Nusir, 2017). Based on Kleine´s Choice Framework (2010) this technology-enhanced service can be conceptualized as a greater degree of “empowerment” of public services. Empowerment of an organization will relate to the degree of choices available, in other words major empowerment will lead to major degrees of freedom and the ability to adapt the service to the context of action. The choice framework is depicted in figure 2. Figure 2. Choice framework. The framework consists of four main constructs (Kleine, 2010): •. Agency — It is an entity which possesses some abilities and relies on different kinds of resources as inputs to achieve its goals. The resources comprise: material resources like machinery, equipment and other inputs to production processes; financial resources such as cash and shares; natural resources such as local climate and.
(18) 18 available minerals; geographic resources related to the physical location of the agency; as well as human, psychological, informational, cultural and social resources. According to this model, an Agency is the subject of development. •. Choice — It represents a degree of empowerment of an Agency determined by the combination of its resources and structural conditions. The model defines four levels of Choice: 1) existence of Choice — Agency has access to resources, 2) sense of Choice — Agency is able to assess and decide on the relevance of existing resources, 3) use of Choice — Agency is able to determine how to use resources to achieve its goals, and 4) achievement of Choice — Agency is able to act and achieve its goals.. •. Structure — It includes formal and informal laws, rules, regulations, norms, customs, culture, policies, institutions and processes. The framework also includes discourses as Structures as rules, laws, norms, policies, etc. often emanate from them and are embedded in them. In general, a Structure enables or constrains an Agency in the attainment of its goals.. •. Outcome — According to the Capability Approach, the primary development Outcome is the choice itself. The secondary Outcome depends on the Agency's choice informed by its underlying values, for example whether the Agency values more communication, knowledge, income, voice, time, etc. Achieved at the Agency level, such Outcomes could be aggregated at the national or international level where MDG are formulated and measured. For instance, increased income at the Agency level directly contributes to poverty reduction at the community, national and international levels..
(19) 19 This conceptual framework is a useful tool in this thesis since it is able to link the action of User Experience monitoring to a greater effect, such as the enhancement of the quality of service, while at the same time being able to depict the interaction of the information provider with the users and the regulatory and technological structure. Figure 3, depicts the use of the Choice framework with regards to the quality assurance of the educational system in Chile. Figure 3. Choice framework extended to the thesis. In the particular domain of this thesis, the user experience monitoring of documentation delivered by a public information provider to a user, will have the choice effect over the ability to design, re-design, preserve or discard information artifacts that are in current use..
(20) 20 1.3 General and Specific Goals of the thesis project In a global context where government services are becoming increasingly demanded, there is a need to develop models that address the usage of multiple information artifacts for a variety of users and needs. However, public agencies are not traditionally user-centered in terms of their information-goal setting (Henninger, 2017). In this sense, the present project seeks to address this "gap" through the following general objective: To develop a model that allows to systematically evaluate and monitor the user experience of information artifacts delivered from an information provider to a user. For this it is necessary to cover the following specific questions: •. How can the information items be ordered in relation to the user experience?. •. How can the user experience of public information items be monitored continuously?. •. How does ordering and monitoring influence the management of the user experience in a public organization?.
(21) 21 These questions lead to the general structure of goals and hypotheses of the thesis: Goal 1: Develop a representation model of the information artifacts of an organization in relation to the self-assessment of the user dimensions. Hypothesis 1: A methodology that organizes the information artifacts according to User Experience and Usability criteria allows to guide the development of information items of an organization towards an improved quality of service Goal 2: Define a systematic survey methodology for users in relation to the usability of the information products of an organization Hypothesis 2: The action of monitoring user dimensions implies a progressive increase in user-centered practices in the organization Goal 3: Validate the model of representation, survey and indicators with a Chilean public organization that has a relevant presence in terms of digital government Hypothesis 3: A methodology that classifies the information artifacts according to user dimensions allows to guide the design (or re-design) of information artifacts of an organization 1.4 Quality Processes in Education & Information demand. In the last decade a significant number of countries have moved towards the implementation of national systems for administering Quality Processes in Education (Steinhardt et al, 2017). A consistent characteristic of these systems has been a steady increase in the flux of.
(22) 22 information produced by government actors in order to support monitoring processes in Education (Sherman, Bosker & Howie, 2017). Chile has not been the exception. In year 2011, under a new legislation, a National system of Quality Assurance was defined, shifting mainly from one governing institution (Ministry of Education) to a system of actors with different roles interacting with Higher Education and the School System, in order to enhance policy, regulation and to respond to the challenges of Quality in a highly diversified and unequal system (Cabalin, 2012; Tuchman, 2017). In the new structure (see Figure 1), the Ministry of Education maintains its directive role in terms of policy, regulation and public educational budget, but new public services were added to the general scene of decision making. In the School system, there are three additional actors (Cox, 2012): a) National Education Council (CNED): Its main objectives are: definition of a standard curriculum and study programs, assessment plans, learning standards, quality indicators, recognition of educational institutions, teacher development, among others. b) Quality in Education Agency (ACE): Its main goal is to implement process for evaluation and guidance of the educational system so that it tends to improve the quality and equity of educational opportunities c) Superintendence of Education: A public service with the core mission to contribute to the assurance of quality and exercise of the right to early childhood and school education, by monitoring compliance with regulations; accountability; the management of complaints and the provision of information with a sense of efficiency, effectiveness, transparency and participation..
(23) 23 On the other hand, the new legislation also brought new actors to the Higher Education system (OCDE, 2013): •. Higher Education Division: Is a division of the Ministry of Education, responsible for ensuring compliance with laws and formally recognizes higher education institutions. Its other main function is to collect and disseminate information, a task that is carried out through the new Higher Education Information Service (SIES).. •. National Education Council (CNED): The national council also interacts with Higher Education agents with the core mission of: managing of the licensing process, the appointment of those responsible for carrying out the peer review, the provision of information and the processing of the appeals filed in relation to the accreditation decisions.. •. National Accreditation Commission (CNA): Manages the accreditation, sets the accreditation criteria, implements the institutional accreditation, authorizes the Accrediting Agencies and provides public information.. •. Accreditation agencies: Private non-profit organizations that are responsible for the accreditation of careers. They need the authorization of the CNA to exercise their activity in certain series of areas of knowledge and academic levels..
(24) 24 Figure 4. A new framework for Quality Assurance in Chile. The goal of the Chilean Quality in Education system is based on supporting new processes of self-assessment, external assessment, inspection, testing, guidance and support for planning and implementation of Quality enhancement plans (Río, Rojas & López, 2016). In this scenario, Quality Assurance is an evaluation process directed towards “quality levels”, in which the need for organized data and information becomes fundamental to monitor the educational process based in “quality indicators and numbers” (Lingard, 2011). In literature, the need to use public information and data by educational actors has been related to a variety of dimensions such as: aspects of organizational legitimation (Lascoumes & Le Galès 2007), school governance capabilities (Ozga, 2009), improvement of administrative and learning process (Jin, 2013) and data-driven practices (Lewis & Holloway, 2017). Therefore, the type information artifacts in the interaction between Government and Educational system has become a complex system of information artifacts ranging from data-driven documents,.
(25) 25 guidelines, reports to online platforms and web-repositories. In many administrative levels, public services have become accountable of the information artifacts they produce, driving attention to the idea that organized and methodic feedback about the work of public services is essential for evidence-informed decisions (Kroll, 2015). A crucial effect of this, is that any information provider in this system, from a public agency to an instructor in the classroom, is meeting the need to assess if the information they produce is strategically aligned to organizational goals (Luftman, Lyytinen & Zvi, 2017). 1.5 Information for Quality: stakeholders and interactions The notion of “quality” in education is broad and has been largely discussed in literature (Filippakou, 2011). In an ample perspective, it has been related to the need that educational institutions display operational transparency (particularly when being publicly funded), responsiveness to societal challenges and responsible with regards to national development goals (Cowen, 2018). Gvaramadze (2008) describes a model in which the need to establish an agreement with regards to the concept of “Quality” in education has been related to two core concepts to frame the processes involved: “quality as enhancement (process of changing institutions) and quality as transformation (process of changing individuals)”. In terms of relating the quality process to actors and levels, the author defines two levels: 1) “Institutional level — a structural and managerial element in order to enhance quality and coordination of members. This refers to quality as an enhancement process.”.
(26) 26 2) “Individual/staff level — cultural and psychological level of shared values, beliefs, expectations and commitment towards quality culture among individuals. This refers to quality as a transformation process” In the particular case of Chile’s Quality in Education System it is possible to observe that the information artifacts produced by public services relate mostly to this bi-dimensional perspective of quality in which the main interactions are centered in the institution-individual interaction (e.g teacher-student, school principal-teachers) and government-institution interaction (e.g agency-school governing boards). However, from a governance perspective (Ozga, 2009), there’s a third quality level that provides an important liaison between government and citizens. In this third interaction space, government agencies relate directly to students and their family space, which has emerged as an important element of information needs related to Quality in Education (Kanji, Malek & Tambi, 1999). Based on a triangular relationship model among E-Government, E-Business and Citizens proposed by Fang (2002), it is possible to frame a structure of relationships for information flux and information levels in a Quality in Education system (Figure 2), considering the following three actors: •. Quality in Education Agents: Represent all the different public services structuring the system of Quality (for School and Higher Education).. •. Educational Institutions: Represent the entire universe of educational institutions (both public and private) and at any level (School system, Higher Education). Internally, these actors are mainly represented by governing boards (Principals, Rectors, Management teams) and educational agents (Teachers, Technical-.
(27) 27 Pedagogical Teams, Career Guidance teachers, Learning Support Teachers, among others). •. Students: Represent an heterogeneous group across the School and Higher Education systems. When considering information for career or school- choice, this group also includes the family space of students (Kanji, Malek & Tambi, 1999).. Among these actors, three interaction spaces define the types of information artifacts and processes that relate to quality in terms of enhancement or assurance (Gvaramadze, 2008): •. Regulatory space - Quality as Enhancement: Related to information and processes directed towards enhancing managerial processes at strategic and administrative level in Educational Institutions. The main interaction goals with information artifacts are related with data-driven decisions, internal benchmarking with peer institutions, institutional goal-setting and accountability, among many others.. •. Performance space - Quality as Transformation: Related to information and processes directed towards enhancing learning and teaching processes at classroom level. The main interaction goals with the information artifacts are related with student course evaluations, educational technology assessment, new strategies for effective learning, grading and outcomes among many others.. •. Guidance space - Quality as Support: Related to information and processes directed towards enhancing sense of influence and contingency (Grimsley & Meehan, 2007) which provide public value to the services provided by the government. The main.
(28) 28 interaction goals with the information artifacts are related with school-choice, career guidance, university benchmarking and economical support, among many others. Figure 5. Information flow and levels within the Quality in Education System. The types of information flow between each actor can be defined in 6 categories relating the three main actors of this triangular model. Regulatory Space 1. Government to Educational Institutions (G2E): Exchange of information to support quality assurance and enhancement processes within educational institutions..
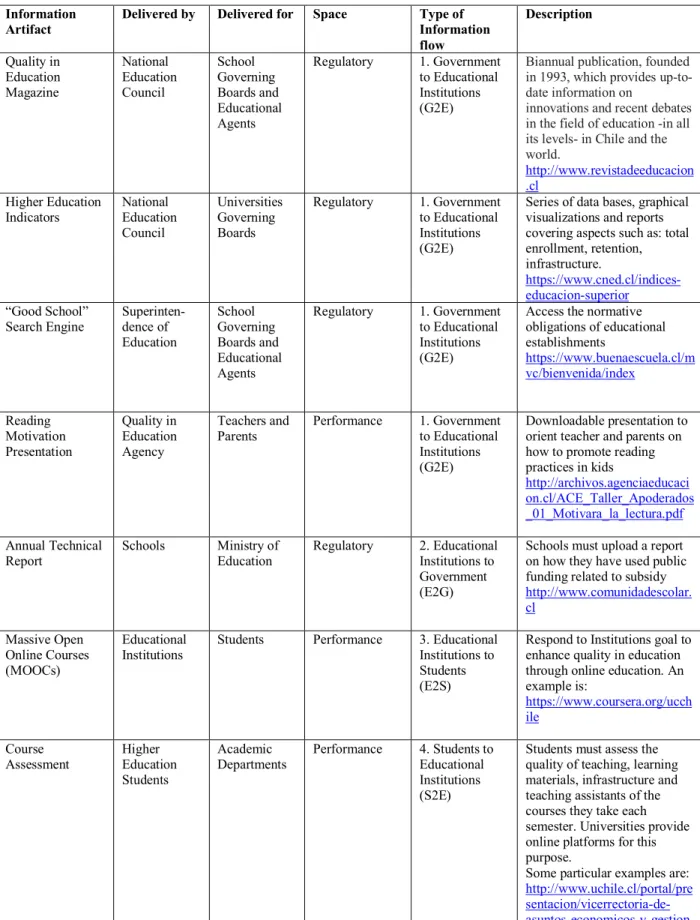
(29) 29 2. Educational Institutions to Government (E2G): Information related to processes of accountability of internal administrative and learning processes. Performance space 3. Educational Institutions to Students (E2S): Information related to support teaching and learning, standardized processes and evaluations of learning outcomes. 4. Students to Educational Institutions (S2E): Information related to provide feedback to the education provider in terms of its education provision. Guidance Space 5. Government to students (G2S): Information for orienting decisions for educational institution selection and career guidance. 6. Students to Government (S2G): Information evidencing the specific needs of students and their families with regards to the expected quality of the educational institution in which they participate.. Each of these categories relate to the exchange of information artefacts over time, Table 1, displays a set of Information Artifacts that links with the particular context of Quality in Education in Chile. It is possible to observe a wide range of information artifacts, from static images (infographics) to dynamic search engines. Consequently, further understanding of the User Experience within the Quality of Education System was linked with an interactivity framework in which it is possible to relate information artifacts to their communicative and interactive nature..
(30) 30 Table 1. Examples of information artifacts in the Quality of Education System Information Artifact. Delivered by. Delivered for. Space. Type of Information flow 1. Government to Educational Institutions (G2E). Description. Quality in Education Magazine. National Education Council. School Governing Boards and Educational Agents. Regulatory. Higher Education Indicators. National Education Council. Universities Governing Boards. Regulatory. 1. Government to Educational Institutions (G2E). “Good School” Search Engine. Superintendence of Education. School Governing Boards and Educational Agents. Regulatory. 1. Government to Educational Institutions (G2E). Reading Motivation Presentation. Quality in Education Agency. Teachers and Parents. Performance. 1. Government to Educational Institutions (G2E). Downloadable presentation to orient teacher and parents on how to promote reading practices in kids http://archivos.agenciaeducaci on.cl/ACE_Taller_Apoderados _01_Motivara_la_lectura.pdf. Annual Technical Report. Schools. Ministry of Education. Regulatory. 2. Educational Institutions to Government (E2G). Schools must upload a report on how they have used public funding related to subsidy http://www.comunidadescolar. cl. Massive Open Online Courses (MOOCs). Educational Institutions. Students. Performance. 3. Educational Institutions to Students (E2S). Respond to Institutions goal to enhance quality in education through online education. An example is: https://www.coursera.org/ucch ile. Course Assessment. Higher Education Students. Academic Departments. Performance. 4. Students to Educational Institutions (S2E). Students must assess the quality of teaching, learning materials, infrastructure and teaching assistants of the courses they take each semester. Universities provide online platforms for this purpose. Some particular examples are: http://www.uchile.cl/portal/pre sentacion/vicerrectoria-deasuntos-economicos-y-gestion-. Biannual publication, founded in 1993, which provides up-todate information on innovations and recent debates in the field of education -in all its levels- in Chile and the world. http://www.revistadeeducacion .cl Series of data bases, graphical visualizations and reports covering aspects such as: total enrollment, retention, infrastructure. https://www.cned.cl/indiceseducacion-superior Access the normative obligations of educational establishments https://www.buenaescuela.cl/m vc/bienvenida/index.
(31) 31 institucional/convenio-dedesempeno/sistemas-degestion/96393/encuestadocente http://direcciondedesarrolloaca demico.uc.cl/index.php?option =com_content&view=article&i d=391&Itemid=419 Assessments of Ethical Aspects. Doctoral Students. Institutional Review Boards. Performance. 4. Students to Educational Institutions (S2E). Quality of Doctoral research is related to the Process of Institutional Review Boards. Doctoral students must submit their research through online platforms such as: https://evaluacionetica.uc.cl/#!/ login. “My Future” Portal. Higher Education Division. Students (and parents). Performance. 5. Government to Students (G2S). Access employability data for undergraduate programs in Chile. http://www.mifuturo.cl. Infographics. Quality in Education Agency. School Governing Boards, Educational Agents, Students and Parents. Guidance. 5. Government to Students (G2S). A set of graphical schematics for explaining various concepts and processes around Quality in Education, directed towards parents and students. http://www.agenciaeducacion. cl/orientacion/herramientas-deorientacion/infografias/. Unique Form of Socioeconomic Accreditation. Higher Education Students. Ministry of Education. Guidance. 6. Students to Government (S2G). Students must complete this form in order to apply for public grant to support their education. http://www.gratuidad.cl.
(32) 32 1.6 Usage of Information Artifacts: Levels of interactivity “Although two separate concepts, the notion of information is closely related to the notion of interactivity, as interactivity is all about the transmission of information in a process of communication” (Ariel and Avidar, 2015). The information flow between agents in the regulatory, performance or guidance space, can be conceptually framed as a process-related interaction between a sender and a receiver (Rafaeli, 1988). This communication process will be enabled by the degree of interactivity of the medium (Stromer-Galley, 2004). Early on Bretz (1983) defined “interactivity” as a quasi-interaction between a user-system or user-document interaction. Since then, a practical approach adopted by scholars has been to distinguish between two dimensions (o´neill, 2008): •. Medium interactivity, related to the definition by Bretz in which the focus is on the interactivity allowed by the content of a system/document. The communication process based on the nature of the technology itself and what the technology allows users to do. This perspective is consistent with a human–computer interaction (HCI) approach in which the construct of “interactivity” is the result of how the interface design is characterized.. •. Human interactivity, also known as user-to-user or interpersonal interactivity, is the communication between two or more users that takes place through a communication channel..
(33) 33 Additionally, in terms of medium interactivity, Rafaeli (1988) defined a model with three levels of interactivity of a message: •. Non-interactive: A one-directional message between a sender and a receiver or receivers, this represents the lowest level of responsiveness of the message. In terms of the Quality in Education system it can be related to information artifacts such as: reports, presentations, videos, audio, infographics, data, study guides, among many others.. •. Reactive: A two-way directional message, in which a first message produces a second message related to the first one. This level can be related to forms, surveys and search engines.. •. Interactive: Represents a continuous two-messaging from sender to receiver, in which the communication convey all the previous turns. It can be related to online forums, chat-platforms, and citizen support systems.. Consequently, interactive information artifacts convey significantly more complex interfaces compared to reactive and non-interactive ones. Additionally, with the implementation of online services, much of the HCI focus on interactivity of information artifacts has been directed towards understating the nature of their navigational, adaptive and customizable features (Deuze, 2003). Table 2, displays a set of studies related to information artifacts in Education, from where it is possible to observe the interaction spaces related to Quality in Education (regulatory, guidance and performance), the type of information flow (G2E, E2G,E2S, S2E, G2S and S2G) and level of interactivity (interactive, reactive and noninteractive)..
(34) 34 Table 2. Usage Assessment of information artifacts related to Quality in Education Article. Author/year. What was evaluated. Information flow/Interaction space Government to Educational Institutions/Regulatory. Type of Interactivity. Evaluating the Quality of Indian School Education boards’ websites using multi criteria decision making models. Dani & Agrawal (2018). 36 homepages of national and state boards for secondary education in India.. Usability of mobile learning applications: a systematic literature review. Kumar & Mohite (2018). Metanalysis of 23 publications conducting usability evaluation of mobile learning applications.. Educational Institutions to Students/ Performance. Interactive. Internet cognitive failure relevant to users' satisfaction with content and interface design to reflect continuance intention to use a government elearning system. Hong et al. (2017). Content and interface design of a government e-learning system in Taiwan to explore factors relevant to users' continuance intention to use the system. Government to Educational Institutions/Regulatory. Interactive. Analysis of usability of universities Web portals using the Prometheus tool SIRIUS. Chamba-Eras et al (2017). 24 universities Web portals. Educational Institutions to Students/ Performance. Interactive. Development and Usability Test of an e-Learning Tool for Engineering Graduates to Develop Academic Writing in English: A Case Study. Lin , Liu & Wang T. Usability testing of an Engineering English Journal Paper Writing System. Students to Educational Institutions / Performance. Interactive. A study of the interface usability issues of mobile learning applications for smart phones from the users perspective Usability design for video lectures. Ali, Alrasheedi, Ouda & Capretz (2015). Two m-learning models were evaluated in terms of ease of use, user satisfaction, attractiveness, and learnability. A video lecturing system. Students to Educational Institutions / Performance. Interactive. Educational Institutions to Students/ Performance. Reactive. (2017). Chorianopoulos & Giannakos (2013). Interactive.
(35) 35 Assessing the accessibility and usability of Malaysia Higher Education Website. Abdul Aziz , Wan Mohd Isa & Nordin (2010). 120 samples of higher education institution websites from the online portal of the Ministry of Higher Education Historical analysis of the usage success of two open access bibliographic databases related to Education and Medicine 49 Websites of computer departments at universities in North Carolina. Government to Students / Guidance. Interactive. Tale of two databases: The history of federally funded information systems for education and medicine. Weiner (2009). Government to Students / Guidance. Reactive. Do computer science department websites meet the needs of students?. Palmer &Kent (2007). Educational Institutions to Students/ Performance. Interactive. Evaluation of the interactivity of web-based learning systems: principles and process. Evans & Sabry (2003). 3 Web-based learning systems (WBLSs. Educational Institutions to Students/ Performance. Interactive. Website usability and content accessibility of the top USA universities. Zaphiris & Ellis (2001). 50 top fifty USA universities (US News 2001). Government to Students/ Guidance. Interactive. As observed in Table 2, there is a significant research effort on evaluating different information artifacts related to education. There has been a notorious tendency to the evaluation in the performance space, involving highly interactive interfaces. This trend can be linked to aspects as the debate on the advantages and disadvantages of using Information and Communication technology in educational management, teaching and learning processes (Margaret, Uma, Tejonidhi & Neelakantappa 2018; Schulz, Isabwe & Reichert, 2015; Evans & Sabry, 2004); and how the physical classroom has been extended into new domains such as online, virtual and. collaborative settings (Coetzee, Schmulian & Coetzee, 2017).. However, different studies have related students learning needs with less innovative artifacts such as personal notes and lecture audio/video recordings of lectures (O´Brien & Verma,.
(36) 36 2018; Copley, 2007). Therefore, it is plausible to relate the complete learning experience of a given educational system to the use of multiple information artifacts, ranging from low to high levels of interactivity.. 1.7 Towards Quality of Service: User Experience of low level interactivity artifacts The effective usage of a system can be placed within the dimension of improvement of the Quality of Service, in which an overall match between user needs and information provider is achieved (Verdegem & Verleye, 2009). With regards to the information artifacts connected to the Quality in Education model context defined (Table 2) it is possible to observe that User Experience and Usability assessments need to advance in two complimentary dimensions: the system for delivering content and the content itself (Stromer-Galley, 2004). The Government of Chile has arranged a series of guidelines and projects in its e-government digital agenda to meet the goal of mass-use of online public services. In 2004, a set of national guidelines were created to ensure minimum usability standards for public websites and platforms (Comité de Ministros Desarrollo Digital, 2007). A great amount of these evaluation models (e.g., usability heuristics) can be related to the three-way model of interactivity (Rafaeli, 1988). In this framework an interaction is defined based on three sequential actions: (1) initiation; (2) response; (3) feedback. In the model, each action is related to a one-way flow of information between two agents. The first step (initiation) connects a first agent asking input from the second. In a second step (response) the second agent provides back an input. Finally, in a third step, feedback connects the first agent passing back information about the response. The three actions are correlated in terms that the response must be consistent with the.
(37) 37 initiation, and the feedback must be in direct relation to the response. Evans & Sabry (2003) used this straightforward model to describe a computer-initiated interaction (see Figure 3).. Figure 6. A three-way model applied to computer-initiated interactivity. Computer-initiated interactions strongly relates to the practical use of information artifacts which can be assessed in terms of efficiency, efficacy and satisfaction within the constraints of the interaction, constructs that are core in Usability when defined as: “The extent to which a system, product or service can be used by specified users to achieve specified goals with effectiveness, efficiency and satisfaction in a specified context of use (ISO,2010) From here it seems natural that most of the usage assessments in Table 2 are linked to technological and interactive artifacts assessed in the domain of Usability.. However, the previous model can be complimented with a user-initiated interaction in which the user defines the first input into the posterior flow of interactions. Dragunalescu (2002) defines a three way model that can be related to a user-initiated interaction with a website..
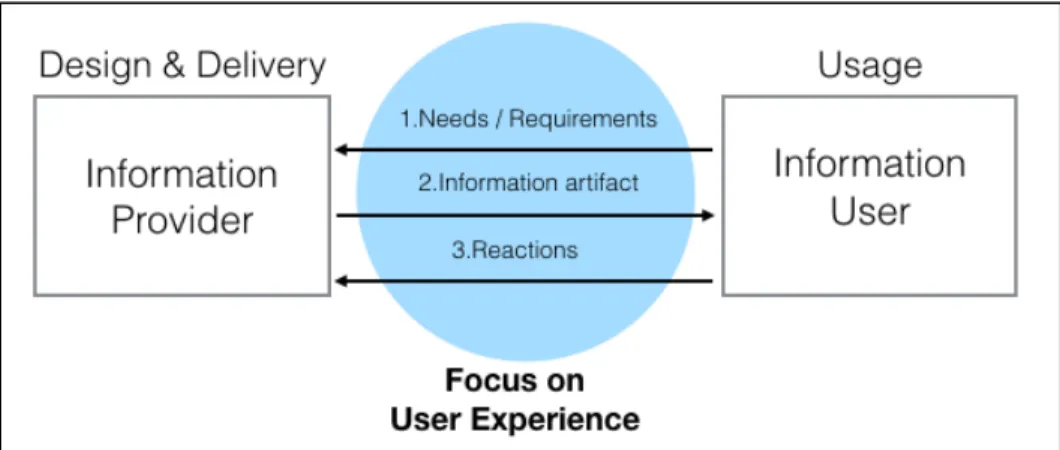
(38) 38 Here the interactions start with the user and its needs and/or requirements (step 1), which are interpreted by the information provider, who in response delivers a tangible/intangible product to the user (step 2), who finally has a reaction to the product (step 3). According to this model the “quality of the product” is built around the information provider taking into account both step 1 (user needs) and step 3 (user reactions) in the product delivery. Here the focus of the interaction is put on the information provider and how the process of understanding the user is managed. From a usage assessment perspective, a user-initiated interaction can be greatly referred to the User Experience definition: “A person's perceptions and responses that result from the use and/or anticipated use of a product, system or service”. (ISO, 2010). Additionally, a user-inititated interaction model can integrate: a) Context-related factors such as social, spatial, temporal, infrastructural and task related issues (Wigelius and Väätäjä, 2009) b) Non-instrumental aspects of technology, such as user needs related to self-growth, increase in knowledge and skills (Hassenzahl, 2003).. In this thesis, the focus of the assessment of information artifacts has been related to a userinitiated interaction. This particular sort of interaction is depicted in Figure 4..
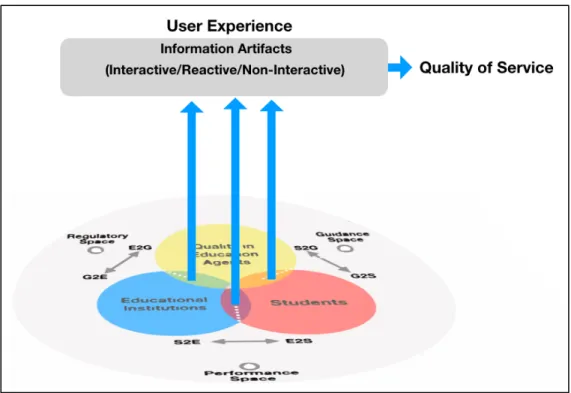
(39) 39 Figure 7. A three-way model relating Information provider and information user. In Figure 4, User Experience evaluation can provide significant input on which are the main needs and requirements that an information user has with regards to a task. User experience can also be part of the actual use of the information artifact in terms of understanding user perception while using the product. Finally, the reactions (or posterior perceptions) can also be assessed. This temporal assessment (pre, during and post experience of the product) relates to the main ideas expressed in the field and research agenda of User Experience assessment in which strong emphasis has been to take into account not only the system characteristics (functionality, usability, purpose), but also users internal states (needs, expectations, predisposition) and the context of use (Hassenzahl and Tractinsky, 2006). 1.8 Problem statement Despite a significant advancement of usage assessment with regards to information artifacts related to education either produced by government agencies or educational institutions, many types of products still remain low or absent in terms of usage evaluation. In consequence, the gap covered by this research has a scope on the low interactivity information artifacts. Figure 5 summarize the relationships between the.
(40) 40 initial perspective of the Quality in Education System, and the challenge of achieving a balanced User Experience across all levels of interactivity to reach an ultimate Quality of Service goal. User Experience assessment is related to the generation of assessment evidence in educational environments, not only to evaluate the quality of teacher service (performance level) but also how the school environment is holding accountable of government policy, helping students, parents and teachers to judge if learning goals has been reached, and what new goals and actions can be taken. Additionally, public agencies can also be hold accountable by the student population, enhancing their e-government accountability with regards to citizens (Al-Hujran et al, 2015). Figure 8. User Experience with regards to the Quality in Education system.
(41) 41 1.9 Thesis Methodology and Outline. The thesis process was based on an action research approach due to the need to integrate the experience gained in each stage into the next phase (or parallel phases) and to bring together the research team with other participants with the purpose to solve a problem and produce research results at the same time in a research context (Baskerville, 1999). In this thesis, three different studies were conducted. One study was performed in terms of an Education Institution to Student information flow, where the information artifact was Learning Materials (Chapter 1). Additionally, two studies were performed in terms of the regulatory space mediating Government to Education Institutions (G2C) information flow (Chapter 3 and 4) with regards to the school system. This allowed to achieve amplitude over deepness of the research effort, being this a limitation that will be further explained in the conclusions section. In terms of the specific actors involved, in each study the following institutions participated:. A) Education Institution to Students (E2S): we worked with two large scale chilean universities. Both Pontificia Universidad Católica and Universidad Técnica Federico Santa María participated as context for. initial experimentation with a User. Experience assessment tool. Applied within an academical domain, where information artifacts provision was related to Learning Materials (i.e. non-interactive Information artifact) provision from instructors to students.. Both Universities. currently share a joint program called Engineering 2030, which has set to modernize and improve Chilean Engineering Education focusing on innovation..
(42) 42 B) Government to Educational Institutions (G2E): A significant section of the thesis project relates to an action research collaboration with the Chilean Quality in Education Agency (OECD, 2017). The interaction was focused on the Agency’s Community Information Division, which designs, analyzes and implements information products (i.e., Agency website, social media sites, platforms, reports, among many others). Figure 6 summarizes the context of research with the corresponding chapters of this thesis. Chapter 1 is related to the Educational Institution to Student (E2S) information flow. Chapter 2 and 3 are interlaced in terms of the Government to Educational Institution (G2E) information flow. Figure 9. Chapters relation to the initial context of research.
(43) 43 Table 3 summarize the relationship between the context showed in Figure 6 and the hypotheses, research questions and results obtained in each of the three studies.. Table 3. Methodology and its relation to the thesis outline Information flow/Level 3. Educational Institutions to Students (E2S) / Performance. Hypothesis. 3. Educational Institutions to Students (E2S) / Performance. H2: User Experience assessments should allow to make inferences about specific user needs in the context of study. 1. Government to Educational Institutions (G2E) / Regulatory. H3: An Online survey will have better response rate if its sent according to respondents time availability. 1. Government to Educational Institutions (G2E) / Regulatory. H4: Reminder emails promote better response rates in online surveying. 1. Government to Educational Institutions (G2E) / Regulatory. H5: An email embedded survey should be easier and faster to answer since user makes less clicks to reach the survey. 1. Government to Educational Institutions (G2E) / Regulatory. H6: Classification of information artifacts can help Public Services understand the stream of. H1: A survey tool which allows information providers to monitor key aspects of User Experience should provide easy to interpret results. Research Question RQ1: How can educational institutions asses the User Experience of the low interactivity information artifacts delivered in order to meet their learning objectives? RQ2: What can educational institutions learn by assessing the User Experience of their learning materials?. Chapter/Paper. Results. Chapter 2 Paper: User Experience of Learning Materials: A Framework for Assessment. R1: An User Experience assessment, based on a five-question survey, that is easy to implement and low resource consuming in terms of time for answering and data interpretation. Chapter 2 Paper: User Experience of Learning Materials: A Framework for Assessment. RQ3: Is there a better time in the week to send out online surveys to educational institutions representative? RQ4: What is the effect of sending reminder emails over response rates and response times? RQ5: How does a survey embedded in an email compare with a web-based survey in terms of response rate and response time? RQ6: How can Public Service Information materials be classified (or grouped) in terms. Chapter 3 Paper: Online survey: A national study with school principals. R2: Usage of Learning Materials is mostly driven by students need to perform well according to course requirements, rather than applying knowledge to professional context, which should be their main objective R3: There is no better moment in the week to send out an online survey. Chapter 3 Paper: Online survey: A national study with school principals. R4: There were a significant effect of reminder email over response rate to the survey sent by email.. Chapter 3 Paper: Online survey: A national study with school principals. R5: No significant effect over response rate and response time when embedding a survey in email, as opposed to sending a link. Chapter 4 Paper: User Experience of Public Service Information. R6: A model for categorizing Public Service Information Materials based on User Experience and.
(44) 44 products delivered to Citizens. of User Experience?. 1. Government to Educational Institutions (G2E) / Regulatory. Chapter 4 Paper: User Experience of Public Service Information. 1. Government to Educational Institutions (G2E) / Regulatory. RQ7: Can organization relate its system of information products to its main goal?. 1. Government to Educational Institutions (G2E) / Regulatory. 1. Government to Educational Institutions (G2E) / Regulatory. 1. Government to Educational Institutions (G2E) / Regulatory. Information Quality frameworks. Chapter 4 Paper: User Experience of Public Service Information. Chapter 4 Paper: User Experience of Public Service Information. H7: A UX monitoring process over time may allow understating the reasons behind effective or ineffective usage of information artifacts. RQ7: How can the User Experience of Public Service Information be monitored over time in order to inform design decisions?. Chapter 4 Paper: User Experience of Public Service Information. Chapter 4 Paper: User Experience of Public Service Information. R7: By categorizing the information products, a Public Agency can have more visibility of the information artifacts delivered R8: By categorizing all the information artifacts with regards to user needs, a Public Agency can understand it is reaching its core mission in terms of information provision. R9: Classification establishes an initial ‘baseline’ assessment. Contrasting this baseline with the results of the user assessment will help organizations better understand the communication gap between the information provider (public service) and the users (citizens). R10: Definition of a model for monitoring User Experience of a specific product over time allowed for a better understanding of the users’ attitudes towards e-participation and the use of public information R11: Management and Resources are the team’s main concerns when it comes to implementing usercentered processes within the organization. This is linked to the fact that continuous testing and assessment of information requires higher levels of resources and support from decision-makers. Additionally, Figure 7 summarizes how hypotheses, research questions and results relate to each other and the current status of publishing efforts of the obtained results..
(45) 45 Figure 10. Summary of Methodology and current status of results. Chapter 2 is a complimentary study with regards to the other two; it brings perspective into User Experience assessment at performance levels, one of the three contextual levels defined in Figure 2. The results from chapter 3 oriented the aspects of the study described in chapter 4, particularly understanding that there was no ideal timeslot in the week to send out online surveys to school principals (results 3), allowed to perform the third study with independence from this variable. However, result 4 (significant effect over response time of reminder emails), influenced the third study since this was applied to the process. With regards to each chapter, it is possible to detail:. a) Chapter 2: User Experience of Learning Materials: A framework for Assessment, was submitted in May 2018 to the journal Computers in Human Behavior (impact factor: 3.435)..
(46) 46 Previously, initial results were presented in the bi-annual Conference of EARLI-European Association for Research in Learning and Instruction in Tampere, Finland (September, 2017). Highlights of the chapter: •. Learning Materials still play a significant role in the student learning experience in Higher Education. •. The User Experience (UX) of Learning Materials is often not assessed by instructors at Higher Education institutions. •. The use of short UX surveys in Higher Education can provide a powerful insight into the prevailing pedagogical policy and practice at an institution. b) Chapter 3: Online Survey: A national study with school principals was accepted in September in 2017 in the journal Computers in Human Behavior. Highlights of the chapter: •. Government consultation processes use on-line surveys extensively. •. On-line surveys may represent information overload to final recipients. •. Reminder emails allows increasing response rate to an on-line survey. •. Web-linked survey display better response rate than an email embedded one. •. School principals response rate and response time are context dependent. c) Chapter 4: User Experience of Public Sector Information: Was submitted to the journal Government Information Quarterly (impact factor: 4.090). Highlights of the chapter are: •. Provides an insight into how government organizations can improve the User Experience of their Public Service Information (PSI). •. Develops a model for categorizing Public Service Information materials. •. Characterizes a nationwide study of User Experience.
Figure


+7


Documento similar
Additionally, in order to provide a mechanism for extracting high- level context from low-level information, the system allows the creation of User- defined context reasoning rules in
These items were designed according to the different types of map information (explicit, implicit and conceptual information), so that there were six items for
To delete mail messages, select the folder in which the messages are stored in, and in the top right display panel where the list of messages are displayed, select
It consists on an HTML5 and Javascript program that allows the user to solve randomly generated maps of islands using a path- planning algorithm to solve them and a pix2pix
Chapter 4 “Performance Evaluation of 802.11g Mobile Ad-hoc Networks Supporting Multimedia Traffic: a QoE Perspective” compares two well-known ad- hoc routing
Government policy varies between nations and this guidance sets out the need for balanced decision-making about ways of working, and the ongoing safety considerations
No obstante, como esta enfermedad afecta a cada persona de manera diferente, no todas las opciones de cuidado y tratamiento pueden ser apropiadas para cada individuo.. La forma
The type of creativity required in the localisation of video games is one that allows players to immerse themselves in the game experience and the activities linked to beating
