Evidence for Nonhydrostatic Gas Motions in the Hot Interestellar Medium for Centaurus A
14
0
0
Texto completo
(2) –2– after the merger. The pressure discontinuity may have had a profound influence on the temporal evolution of the kpc-scale jet. The jet could have decollimated crossing the discontinuity and thereby forming the northeast radio lobe. Subject headings: galaxies: individual (Centaurus A, NGC 5128) - X-rays: galaxies - hydrodynamics - galaxies: jets. 1.. Introduction. Chandra has revealed the complex relationship between the lobes of radio galaxies and the hot gas of galaxies, groups, and clusters in a large number of systems. The heating of the gas induced by the inflation of the lobes, either subsonic or supersonic, plays an important role in the energy budget of the ISM of galaxies and the ICM of clusters. Lobe inflation also plays a key role in mixing the low entropy gas in the cores with the high entropy gas in the halo (Roediger et al. 2007). In addition, the relatively low inertia of the radio lobes means that they are easily influenced by subsonic or transonic motions of the ambient medium once the early, highly supersonic expansion phase has ended (Reynolds et al. 2001). The temporal evolution of radio lobes could be dramatically altered in systems that have undergone recent mergers. Observationally, there are at least two examples in which ongoing galaxy mergers have dramatically influenced the evolution of radio bubbles (Hardcastle et al. 2007b; Worrall et al. 2007). In Chandra observations both of the Antennae, the nearest earlystage merger (Baldi et al. 2006), and of more distant merging galaxies (Brassington et al. 2006) we see large spatial variations of gas temperature, density and elemental abundance as the hot ISM of the merging galaxies begins to coalesce. The dissipative processes that smooth out these gradients are poorly understood, but transonic gas motions and temperature/pressure variations could play an important role in the time evolution of relatively weak nuclear outbursts. Centaurus A (Cen A, NGC 5128) is the nearest radio galaxy and the nearest large, unobscured, early-type galaxy (DL =3.7 Mpc, MB =-21.2, see Dufour et al. (1979)). It is the dominant member of a poor group, and the prototypical example of several astrophysically interesting categories, including low-luminosity (FR I) radio galaxies, early-type galaxies, and late-stage mergers. These make it the ideal target for the study of the dynamics of the merger process and its effects on radio bubbles. Six 100 ks observations were made with Chandra/ACIS-I in AO-8 to study the X-ray jet (Kraft et al. 2002; Hardcastle et al. 2003, 2007b; Worrall et al. 2008), the interaction of the radio lobes with the ambient gas (Kraft et al. 2003), the X-ray binary population (Kraft et al. 2001; Voss & Gilfanov 2006; Jordán et al. 2007; Sivakoff et al. 2008), and the hot gas (Karovska et al. 2002;.
(3) –3– Kraft et al. 2003). In this Letter, we present preliminary results from our deep AO-8 Chandra observation of the ISM of Cen A and its interaction with the northeast radio lobe. In particular, we report the discovery of a surface brightness discontinuity in the gas ∼3.2 kpc from the nucleus that spans a 120◦ arc. We conclude that this discontinuity and associated gas motions may be responsible for the observed radio morphology of the northeast radio lobe. We adopt a distance of 3.7 Mpc to Cen A, which is the mean of distance measures from five independent indicators (TRGB, Mira variables, SBF, PNLF, Cepheids, summarized in Section 6 of Ferrarese et al. (2007)). At this distance, 1′′ =17.9 pc and 1′ =1.076 kpc. All uncertainties are at 90% confidence for one parameter of interest unless otherwise stated, and all coordinates are J2000. All spectral fits include absorption (NH =8.41×1020 cm−2 ) by gas in our Galaxy (Dickey & Lockman 1990).. 2.. Data Analysis. Cen A has been observed ten times with Chandra/ACIS. All the data were reprocessed to apply the most up to date gain and CTI correction, and the event files were filtered to remove events at node boundaries. Standard ASCA grade filtering (i.e. event grades 0,2,3,4,6) was applied to the data. A lightcurve was created in the 5-10 keV band after removal of point sources to search for periods of background flaring. Intervals where the background rate was more than 3σ above the mean were removed, leaving ∼623 ks and ∼96 ks of good time for the ACIS-I and ACIS-S observations, respectively. The observations were co-aligned by matching the X-ray positions of ∼200 X-ray binaries and other point sources (about half having >100 counts in the 0.5–7.0 keV band within a single observation) (Jordán et al. 2007). Full details of the data processing and alignment will be presented in a future publication. Given the narrow scope of this Letter, we use only the ACIS-I data (roughly 85% of the observation time) to avoid systematic uncertainties due to different backgrounds and spectral responses between the ACIS-S and ACIS-I detectors.. 3.. Results. A Gaussian smoothed, exposure corrected Chandra/ACIS-I image of Cen A in the 0.51.0 keV band with 5 GHz radio contours (6′′ resolution) overlaid is shown in Figure 1. One of the most striking features of Figure 1 is the surface brightness discontinuity which lies ∼3.2′ (3.54 kpc) to the east and north of the nucleus. Figure 2 contains an unsmoothed X-ray.
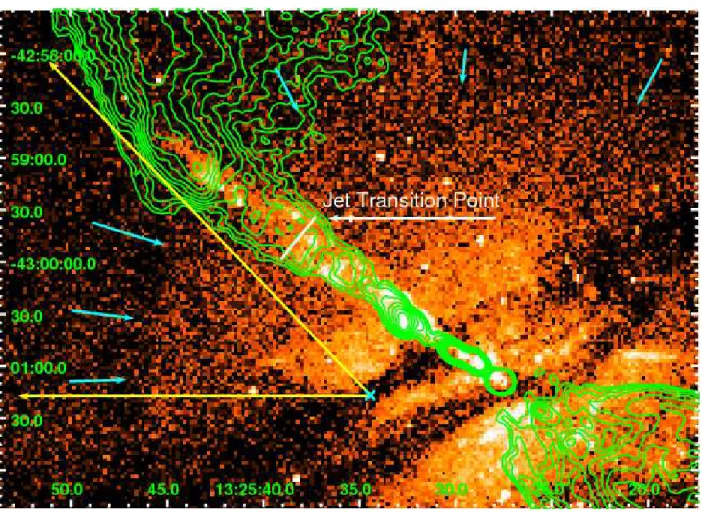
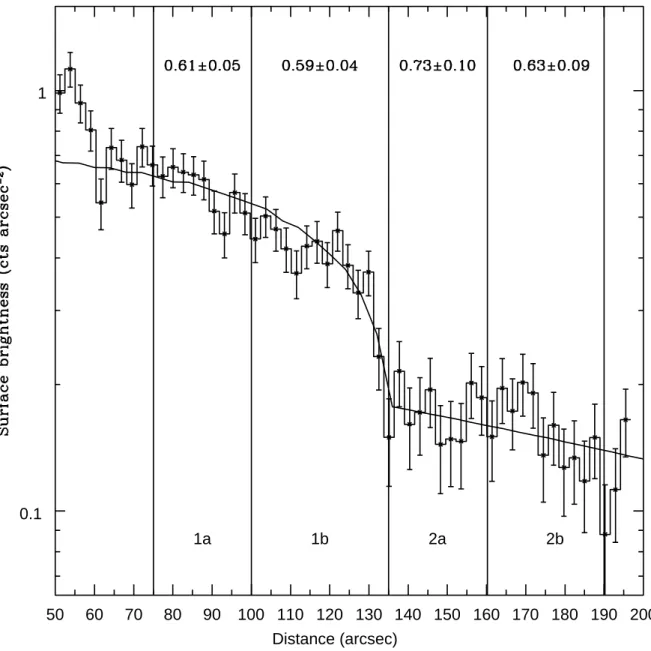
(4) –4– image in the same band in the vicinity of the discontinuity (denoted by the blue arrows). We extracted a surface brightness profile, shown in Figure 3, across the discontinuity in a 50 pie slice region centered at α=13:25:34.445, δ=-43:01:16.84. The vertex of this region was located ∼1.3′ east of the nucleus, so that the radius of curvature of the discontinuity matches that of the annular regions, simplifying the deprojection of surface brightness to density. We fitted spectra to four radial regions (1a, 1b, 2a and 2b) of the galaxy gas. Background was determined from a distant region of the combined image free from emission from Cen A. Absorbed APEC models were fitted to each spectrum, with the absorption fixed at the Galactic value, and the abundance allowed to vary freely. The two spectra on the interior of the discontinuity (1a and 1b) contained an additional component, the contribution to the emission from the overlying gas. The best fit temperatures and 90% uncertainties are shown in Table 1. In all cases, the elemental abundance was unconstrained. At these temperatures, the emission is line dominated so that the normalization can be traded off with the abundance. The only formal statistical constraint from each fit was that the elemental abundance, Z, is >0.1 at 90% confidence in the two regions interior to the discontinuity (regions 1a and 1b). ◦. 4.. Interpretation. We deprojected the surface brightness profile assuming a uniform gas density out to Rdiscont (134′′ ), and a beta-model gas density profile with core radius (fixed) r0 =200′′ beyond Rdiscont centered at a point ∼1.3′ east of the nucleus (see Figure 2). Our general conclusions are not sensitive to these model assumptions. The temperatures of the interior and exterior gas were taken to be 0.6 and 0.68 keV, respectively, and represent the average values of regions 1a+1b and 2a+2b. The elemental abundance was unconstrained in the spectral fits, so we initially assumed uniform abundance (Z=1.0) on both sides of the discontinuity. The best fit surface brightness profile using the density profile described above is shown overplotted on Figure 3. We find the hydrogen density interior and exterior to the discontinuity to be 3.60×10⁻³ and 1.38×10⁻³ cm−3 , respectively. The density ratio is more than double the ratio of the temperature differences and implies that the interior gas is greatly overpressurized relative to the exterior gas. In this case, the interior gas should be expanding at roughly its internal sound speed and the pressure gradient would dissipate in roughly a sound crossing time. One possible interpretation of this phenomenon is that the surface brightness discontinuity and density jump are the result of ‘sloshing’, that is non-hydrostatic motions of the central dense regions of the ISM due to the merger (Markevitch & Vikhlinin 2007). In this.
(5) –5– scenario, the gas is moving to the northeast at transonic velocity and is oscillating, perhaps non-radially, in the gravitational potential of the galaxy. This model has been invoked to explain the presence of similar features observed in clusters of galaxies. Hydrodynamic simulations of this phenomenon for galaxy clusters indicate that the non-hydrostatic oscillation of the core can be quite long lived, typically several Gyrs. The length scales are much smaller in Cen A than in galaxy clusters, but the sound speed of the gas is also much lower. The presence of the ‘sloshing’ gas is entirely consistent with the time since the merger (several hundred Myr - see Israel (1998)). The ratio of the gas pressures interior and exterior to the discontinuity is 2.3±0.4. If this ratio represents the ratio of pressures at the stagnation point and free stream region, the gas interior to the discontinuity is moving to the northeast at approximately 470 km s−1 , or with Mach number 1.0±0.2 (1.2±0.2) relative to the gas exterior (interior) to the discontinuity (Landau & Lifshitz 1950). In this analysis we assumed, however, that the elemental abundance is constant across the discontinuity. If there is a large, discontinuous jump in the elemental abundance, the gas on the two sides of the surface brightness discontinuity could be at or near pressure equilibrium. This would imply that the elemental abundance of the material interior to the discontinuity was several times larger than that exterior to the discontinuity, and that the ratio of the gas densities is the reciprocal of the temperature ratio. In this model, the surface brightness discontinuity is a relatively stable, long lasting contact discontinuity between two fluids. The cooling function, Λ, of an optically thin plasma scales nearly linearly with elemental abundance at the temperatures (<0.75 keV) and abundances relevant to the hot ISM of Cen A. The difference from a purely linear relationship is less than 5% for Z >0.1, and since nH ∼ Λ−0.5 , these differences are negligible. The elemental abundances of the gas interior and exterior to the discontinuity would therefore have to differ by a factor of ∼7 for the two fluids to be in pressure equilibrium. Thus, if the exterior gas is relatively metal poor (Zext =0.1-0.3), the gas interior to the discontinuity would have to have Solar or super-Solar abundance (Zint =0.7-2.1) for the pressure to be continuous. Such a low abundance of the gas exterior to the edge is plausible. Recent HI observations of a sample of relatively isolated elliptical and lenticular galaxies demonstrates that there is considerable cool gas residing in their halos (Oosterloo et al. 2007). If such primordial cold gas is continuously falling into Cen A, the elemental abundance of the outer parts of the hot ISM could be quite low. Arecibo measurements of HI around early-type galaxies in and around the Virgo cluster have found little cold gas (di Serego Alighieri et al. 2007). In dense environments, HI is likely to be stripped, but this is not expected in a poor environment like the Cen A group (Israel 1998). A recent X-ray study of the hot ISM of the gas poor, isolated early-type galaxy NGC 4697 found Z ∼0.25Z⊙ (Irwin et al. 2007), consistent with this picture. There have been several measurements of the elemental abundance of the stellar.
(6) –6– halo population of Cen A. Harris & Harris (2000) reported that the average abundance of the stars in the halo of Cen A (∼20-30 kpc from the nucleus) is Z ∼0.37Z⊙ . After subtraction of the large-scale halo contribution, Harris & Harris (2002) found that the the metallicity of stars closer to the nucleus (∼8 kpc) was somewhat more metal rich, with Z ∼0.65Z⊙ . Suzaku measurements of emission lines and elemental absorption edges of the circumnuclear gas in Cen A suggest that the elemental abundance is slightly super-Solar (Z=1.3) (Markowitz et al. 2007). However, Suzaku does not have the angular resolution to resolve any of the substructure in the gas, the variable absorption, or the X-ray binary population. Analysis of Chandra spectra of the gas in the inner 2 kpc of Cen A demonstrates that the gas temperature of the central region varies by more than a factor of two, and there is a spatial variation in the elemental abundance (Brassington 2006). The temperature and elemental abundance of the central region based on the VLP observations will be presented in a future publication (Kraft et al. 2008, in preparation). In the absence of a precise measurement of the elemental abundances across the discontinuity, we conclude that both phenomena (i.e. gas motions and elemental abundance gradients) may be contributing to the visibility of the surface brightness discontinuity. The abundance profile in many early-type galaxies is sharply peaked at the center, and if the central core is rapidly displaced off-center, a sharp surface brightness discontinuity could result even at zero velocity. The inferred velocity of ∼470 km s−1 should therefore be regarded as an upper limit. The effect of projection is another source of systematic uncertainty in this analysis. Three dimensional simulations of sloshing in galaxy cluster mergers (Markevitch & Vikhlinin 2007) show complex gas temperature and density variations that would be difficult, if not impossible, to resolve via deprojection of surface brightness profiles. We consider the possibility that this surface brightness discontinuity is a shock due to the inflation of radio lobe to be unlikely for several reasons. First, it is not at all clear what is driving the shock. The pressure is larger on the interior, so the shock must be driven from the inside out. The northeast radio lobe clearly lies outside the discontinuity, so the inflation of the lobe cannot be responsible. There is nothing that appears to be driving the gas at supersonic velocity more or less radially from the nucleus. Second, the surface brightness and temperature profiles are wrong for a shock. We should observe a sharp jump in the surface brightness and gas temperature just behind the shock. This temperature jump, even for a high Mach number shock, would easily be observable by Chandra in Cen A if present. Third, there is no corresponding feature on the opposite side of Cen A. It is hard to imagine how the gas could be shock heated on only one side of the galaxy..
(7) –7– 5.. Implications for Evolution of the Jet and Radio Lobes. Did the discontinuity in the gas affect the temporal evolution of the jet and northeast radio lobe? The X-ray morphology of the jet shows a nearly constant opening angle to a distance of 139′′ from the nucleus, where the X-ray jet narrows (see Figure 1 of Hardcastle et al. (2007b)). It is at about this point that the jet opens into the northeast lobe in the radio band. One possibility is that the point at which the X-ray jet narrows is the position at which the jet crosses the X-ray surface brightness discontinuity. This point lies interior to the discontinuity in projection since the jet does not lie directly in the plane of the sky. The sudden change in ambient gas density and pressure across the discontinuity could explain the transition from jet to lobe. Norman et al. (1988) modeled this jet to lobe transition in Cen A as the result of the jet encountering a sudden increase in the external pressure and the jet transitioning from supersonic to subsonic relative to its internal sound speed. They hypothesized that gas was infalling on Cen A and driving a shock in toward the center the galaxy. Our data suggest that it is, in fact, the opposite scenario that is occuring. The motion of the gas interior to the discontinuity is creating the pressure jump (decrease) that de-collimates the jet. The decollimation of the jet across the discontinuity may account for some of the observed features of the X-ray jet. There must clearly be a change in the efficiency of particle acceleration at the point where the jet cross the discontinuity. The X-ray emission from the jet narrows and fades away as the jet enters the lobe (Hardcastle et al. 2007b). The spectral index of the jet emission beyond the discontinuity is considerably steeper than either the compact knots or diffuse emission of the rest of the jet. There is no obvious structure in the radio emission, however. The radio jet both widens and brightens as it smoothly enters the northeast radio lobe. Rapid expansion of the jet may lead to a reconfinement shock, causing the jet to decelerate, and will certainly cause the magnetic field strength in the jet to fall: both of these could reduce the efficiency of acceleration of ultra-relativistic particles. Can the change in physical conditions at the discontinuity be related to the bending of the lobe toward the northwest? Fundamentally, the bending of the X-ray jet into the northeast lobe is likely the result of velocity and pressure gradients in the external gas, although the low surface brightness of the gas and uncertainties due to projection prevent us from making a definitive statement. If the core is ‘sloshing’ there will be significant subsonic or transonic motions of the gas exterior to the discontinuity. This implies pressure variations of tens of percent to perhaps as large as a factor of 2. However, sharp X-ray surface brightness discontinuities have been observed along the north and northwest boundaries of the northeast lobe suggesting that it is expanding into the ISM supersonically (Kraft et al. 2007). We also know that the southwest radio lobe is expanding into the ISM highly supersonically. The.
(8) –8– similarity in size of the northeast and southwest lobes demonstrates that they must be inflating at roughly equal rates, although there are obvious bends in the jet in projection, so there may be some difference in the sizes of the lobes. A nearly transonic wind striking a radio lobe could cause it to inflate asymmetrically if the lobe is overpressurized by at most a factor of a few relative to the ambient medium. Finally we note that the position of the X-ray surface brightness discontinuity perfectly overlaps the position of one of the optical shells seen in deep exposures of Cen A (Malin et al. 1983; Gopal-Krishna & Saripalli 1984). These optical shells (in Cen A and other earlytype galaxies) are believed to be the result of phase wrapping of the dynamically cold disk of the merging spiral galaxy in the gravitational potential of the more massive early-type galaxy (Quinn 1984). The motions of the stars in these shells are thought to be a small perturbation in the larger scale potential. If the association of the X-ray surface brightness discontinuity with the stellar shell is not coincidental, the gas and some of the associated stars must therefore be moving synchronously. Interestingly, both HI and CO have been observed to be associated with the optical shells of Cen A as well (Schiminiovich et al. 1994; Charmandaris, Combes, & van der Hulst 2000). The appearance of the optical shells may not be the result of phase-wrapping but could be indicative of other dynamic stellar motions.. 6.. Acknowledgements. This work was supported by NASA grant GO7-8105X and the Royal Society. We thank the anonymous referee for detailed comments that improved this paper..
(9) –9– REFERENCES Baldi, A. et al. 2006, ApJS, 162, 113. Brassington, N. 2006, Ph.D. dissertation, Birmingham University. Brassington, N., Ponman, T. J., & Read, A. M. 2006, MNRAS, 377, 1439. Charmandaris, V., Combes, F., & van der Hulst, J. M. 2000, A&A, 356, L1. di Serego Alighieri, S. et al. 2007, A&A, 474, 851. Dickey, J. M., & Lockman, F. J. 1990, ARA&A, 28, 215. Dufour, R. J. et al. 1979, AJ, 84, 284. Ferrarese, L., Mould, J. R., Stetson, P. B., Tonry, J. L., Blakeslee, J. P., & Ajhar, E. A. 2007, ApJ, 654, 186 Gopal-Krishna & Saripalli, L. 1984, A&A, 141, 61. Hardcastle, M. J. et al. 2003, ApJ, 593, 169. Hardcastle, M. J., et al. 2007a, ApJ, 662, 166. Hardcastle, M. J. et al. 2007b, ApJ, 670, L81. Harris, W. & Harris, G. 2000, AJ, 120, 2423. Harris, W. & Harris, G. 2002, AJ, 123, 3108. Irwin, J. et al. 2007, Proc. ‘X-ray from Normal Galaxies’ conference. Israel, F. P. 1998, A. & A. Rev., 8, 237. Jordán, A. et al. 2007, ApJ, 671, L117. Karovska, M. et al. 2002, ApJ, 577, 114. Kraft, R. P. et al. 2001, ApJ, 560, 675. Kraft, R. P. et al. 2002, ApJ, 569, 154. Kraft, R. P. et al. 2003, ApJ, 592, 129. Kraft, R. P. et al. 2007, ApJ, 665, 1129..
(10) – 10 – Landau, L. D. & Lifshitz, E. M. 1950, ‘Fluid Mechanics’, 1st ed. Malin, D. E., Quinn, P. J., Graham, J. A. 1983, ApJ, 272, L5. Markevitch, M., & Vikhlinin, A. 2007, Phys. Reports, 443, 1. Markowitz, A. et al. 2007, ApJ, 665, 209. Norman, M. et al. 1988, Nature, 335, 146. Oosterloo, T. A., et al. 2007, astroph-0701716. Quinn, P. J. 1984, ApJ, 279, 596. Reynolds, C. S., Heinz, S., & Begelman, M. C. 2001, ApJ, 549, L179. Roediger, E., et al. 2007, MNRAS, 375, 15. Schiminovich, D., van Gorkom, J. H., van der Hulst, J. M., & Kasow, S. 1994, ApJ, 423, L101. Sivakoff, G. et al. 2008, ApJ, in press. Voss, R. & Gilfanov, M. 2006, A&A, 447, 71. Worrall, D. M., Birkinshaw, M., Kraft, R. P., and Hardcastle, M. J. 2007, ApJ, 658, L79. Worrall, D. M. et al. 2008, ApJ, 673, L135.. This preprint was prepared with the AAS LATEX macros v5.2..
(11) – 11 –. -42:56:00.0. 4’=4.30 kpc 58:00.0. -43:00:00.0. 02:00.0. 04:00.0. 26:00.0. 40.0. 20.0. 13:25:00.0. 24:40.0. Fig. 1.— Gaussian smoothed, exposure corrected Chandra/ACIS-I image of Cen A in the 0.5-1.0 keV band with 5 GHz radio contours (6′′ resolution) overlaid. The color stretch has been selected to enhance the appearance of the X-ray surface brightness discontinuity to the northeast of the nucleus..
(12) – 12 –. Fig. 2.— Raw Chandra/ACIS-I image of Cen A in the 0.5-1.0 keV band. The light blue arrows denote the approximate position of the surface brightness discontinuity in the gas. The light blue cross and yellow lines denote the wedge in which the surface brightness profile in Figure 3 was created. The approximate position of the transition region of the jet (where the width of the X-ray jet narrows) is also labeled..
(13) – 13 –. 1. 0.1 1a. 50. 60. 70. 80. 90. 1b. 2a. 2b. 100 110 120 130 140 150 160 170 180 190 200 Distance (arcsec). Fig. 3.— Surface brightness profile of the hot ISM in a 50◦ wedge (shown in Figure 2) in the 0.5-1.0 keV band. The continuous curve is the best fit surface brightness profile model consisting of a uniform density sphere out to radius 134′′ and a beta model profile at larger radii..
(14) – 14 –. Region Temperature (keV) 1a. 0.61±0.05. 1b. 0.59±0.04. 2a. 0.73±0.10. 2b. 0.63±0.09. Table 1: Best fit temperatures and uncertainties (90% confidence) for two regions interior (1a and 1b) and two regions exterior (2a and 2b) to the surface brightness discontinuity..
(15)
Figure


Documento similar
No obstante, como esta enfermedad afecta a cada persona de manera diferente, no todas las opciones de cuidado y tratamiento pueden ser apropiadas para cada individuo.. La forma
– Spherical Mexican hat wavelet on the sphere software (developed by the Observational Cosmology and Instrumentation Group at
The program is based on the following pillars: (a) students become the main agents of their learning by constructing their own knowledge; (b) the teacher must be the guide to
“ CLIL describes a pedagogic approach in which language and subject area content are learnt in combination, where the language is used as a tool to develop new learning from a
In the “big picture” perspective of the recent years that we have described in Brazil, Spain, Portugal and Puerto Rico there are some similarities and important differences,
It is conjectured that a necessary condition for the existence of the hidden attractor in this class of systems is the rupture of the trajectories that resemble heteroclinic orbits
The Dwellers in the Garden of Allah 109... The Dwellers in the Garden of Allah
Finally, experiments with solar [17–34], atmospheric [35–45], reactor [46–50], and long-baseline accelerator [51–59] neutrinos indicate that neutrino flavor change through
