Model for ontologies development based on information reuse from a dimensional data warehouse Edición Única
154
0
0
Texto completo
(2) INSTITUTO TECNOLÓGICO Y DE ESTUDIOS SUPERIORES DE MONTERREY CAMPUS MONTERREY. DIVISIÓN DE INGENIERÍA Y ARQUITECTURA PROGRAMA DE GRADUADOS EN INGENIERÍA. Los miembros del comité de tesis recomendamos que el presente proyecto de tesis presentado por el Ing. Alejandro Ramírez Ávila sea aceptado como requisito parcial para obtener el grado académico de Maestro en Ciencias con especialidad en:. INGENIERÍA Y ADMINISTRACIÓN DE LA CONSTRUCCIÓN. Comité de Tesis. ________________________________________ Ing. Francisco Carlos Matienzo Cruz, M. S. C. Asesor. ___________________________________ Ing. Salvador García Rodríguez, Ph. D. Sinodal. _________________________________ Ing. Melesio Izquierdo García, M. C. Sinodal. Aprobado:. ___________________________________ Ing. Federico Viramontes Brown, Ph. D. Director del Programa de Graduados en Ingeniería Mayo 2003.
(3) MODEL FOR ONTOLOGIES DEVELOPMENT BASED ON INFORMATION REUSE FROM A DIMENSIONAL DATA WAREHOUSE.. By: Ing. Alejandro Espinoza Esparza. THESIS Presented as a partial fulfillment of the requirements for the degree of Master in Information Technology Management. INSTITUTO TECNOLOGICO Y DE ESTUDIOS SUPERIORES DE MONTERREY. December, 2003.
(4) Dedication ________. To God, who made all this possible and always being with me.. To my Parents, who have supported me in all possible ways available..
(5) Acknowledgements ________. To my uncle Dr. Cesar Solis and my aunt Dr. Cristina Esparza for watching me over during the time of this process.. To my Thesis Committee for helping me through the realization of this work.. To my friends for hanging out with me on all those sleepless nights.. Thanks you all…..
(6) ABSTRACT The costs of the actual implementation of a data warehouse in organizations are huge. The process of implementing this type of technology in enterprises requires great effort and time. The next step, for implementing a data warehouse for Decision Support Systems, is a Knowledge base for Organizational Memory. The cost and process of implementing a Knowledge base is similar in costs and efforts of implementing a data warehouse, which for some organization the transition is frustrating. There is a way to reduce costs and effort in the transition from a data warehouse to a knowledge base using Ontologies as a Knowledge structure. The star joint schema from dimensional data warehouses is quite similar to an Ontology in several ways; such similarities provide a way for reusing information stored in a data warehouse to create Ontologies, and with it, facilitate the transition process. In this investigation a model is proposed to exploit such similarities between the star joint schema and Ontologies in order to provide means for facilitating the transition between decision support systems, to knowledge oriented systems..
(7) Contents Dedication. Iv. Acknowledgements. V. Abstract. Vi. Contents. vii. List of Figures. viii. List of Tables. ix. Chapter I Introduction ................................................................................... 1 1.1 Problem Description ................................................................................... 1 1.2 Justification................................................................................................. 2 1.3 Objective..................................................................................................... 2 1.4 Components ............................................................................................... 4 1.5 Thesis Organization.................................................................................... 5 Chapter II Data ................................................................................................ 6 2.1 Data Technologies...................................................................................... 6 2.2 Data Architecture...................................................................................... 10 2.3 Data Languages ....................................................................................... 12 2.4 Data Methodologies.................................................................................. 12 Chapter III Information .................................................................................. 16 3.1 The Information Era.................................................................................. 17 3.2 Information Technologies ......................................................................... 18 3.3 Information Modeling ................................................................................ 22 3.4 Data Mining .............................................................................................. 22 3.5 Data and Information Modeling ................................................................ 24 3.6 Data bases and Information Bases .......................................................... 25 Chapter IV Knowledge ................................................................................. 27 4.1 Knowledge Economy................................................................................ 27 4.2 Knowledge Technologies ......................................................................... 29 4.3 Knowledge Methodologies ....................................................................... 29 4.4 Knowledge Structures .............................................................................. 30 4.4.1 Semiotic Structures............................................................................ 30 4.4.2 Ontologies.......................................................................................... 32.
(8) 4.5 Ontologies' role in Knowledge Engineering .............................................. 41 4.6 Data Bases, Information Bases and Knowledge Bases ........................... 42 4.7 Knowledge Bases Purpose and Application ............................................. 43 Chapter V Investigation Methodology ....................................................... 46 5.1 Investigation Type .................................................................................... 46 5.2 Investigation Method ................................................................................ 46 Chapter VI Information and Knowledge Integration Model ....................... 48 6.1 Hypothesis................................................................................................ 48 6.2 Learned Lessons ...................................................................................... 50 6.3 Knowledge Integration Model ................................................................... 51 6.3.1 Model Assumptions............................................................................ 53 6.4 Integration Process................................................................................... 54 6.5 Other Solutions......................................................................................... 58 6.6 Data, Information & Knowledge Interaction. ............................................. 59 6.7 Recommendations ................................................................................... 60 Chapter VII Application Cases ..................................................................... 62 7.1 Grocery Stores Case ................................................................................ 62 7.1.1 Case Description................................................................................ 62 7.1.2 Integration Process ............................................................................ 63 7.1.2.1 Class Creation............................................................................. 63 7.1.2.2 Hierarchies Identification ............................................................. 74 7.1.2.3 Relationships Creation ................................................................ 74 7.1.2.4 Group and Store Ontology .......................................................... 74 7.1.2.5 Test Ontology .............................................................................. 74 7.1.2.6 Convert Information into Domain Knowledge .............................. 75 7.2 Supply Case ............................................................................................. 80 7.2.1 Case Description................................................................................ 80 7.2.2 Integration Process ............................................................................ 81 7.2.2.1 Class Creation............................................................................. 81 7.2.2.2 Hierarchies Identification ............................................................. 96 7.2.2.3 Relationships Creation .............................................................. 100 7.2.2.4 Group and Store Ontology ........................................................ 100 7.2.2.5 Test Ontology ............................................................................ 100 7.2.2.6 Convert Information into Domain Knowledge ............................ 101 Chapter VIII Conclusions ............................................................................. 109 Chapter IX. Further Research .................................................................... 112. Appendix A Supporting Technologies ..................................................... 114 A.1 XML: Extensible Markup Language ....................................................... 114 A.2 RDF: The common Ontology Storage Schema...................................... 117 Appendix B. Example RDF Files ................................................................ 120.
(9) B.1 Grocery Stores Case Example............................................................... 120 B.2 Supply Case Example............................................................................ 127 References...................................................................................................... 135 VITA................................................................................................................. 142.
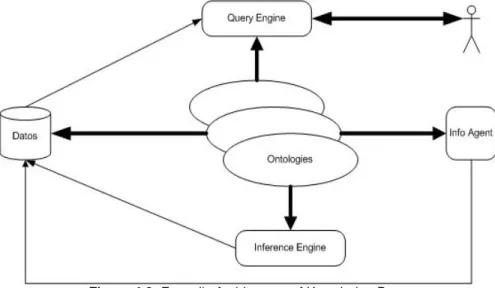
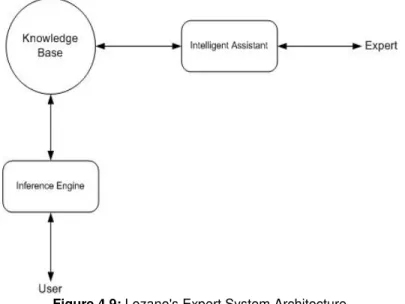
(10) List of Figures Figure 1.1: Modeling Process Flow Chart........................................................ 3 Figure 2.1: 2nd Generation Data base Systems .............................................. 8 rd Figure 2.2: 3 Generation Data base Systems ................................................ 9 Figure 2.3: Data base Systems Three Level Architecture ........................... 10 Figure 2.4: Distributed Data base Systems .................................................. 11 Figure 2.5: Relational Data Structures .......................................................... 14 Figure 2.6: ERM Diagram Simplified ............................................................. 15 Figure 3.1: Figure 3.2: Figure 3.3: Figure 3.4: Figure 3.5:. The Data Cube.............................................................................. 18 The Data warehousing components .......................................... 21 The Data warehousing process.................................................. 22 The Star Join Schema (Data Cube) ............................................ 22 The data mining process............................................................. 23. Figure 4.1: Symbolic Unit ............................................................................... 31 Figure 4.2: Semiotic Triangle ......................................................................... 31 Figure 4.3: Displaying Expression Type ....................................................... 31 Figure 4.4: Expression Unit's Differentiators ............................................... 32 Figure 4.5: Complete Notation for Expression Unit ..................................... 32 Figure 4.6: Ontology Iterative Process Diagram (The Baseball Model)...... 38 Figure 4.7: Knowledge Acquisition Model by Ford & Bradshaw ................. 41 Figure 4.8: Fensel's Architecture of Knowledge Base.................................. 42 Figure 4.9: Lozano's Expert System Architecture......................................... 44 Figure 5.1: Modeling Process Flow Chart...................................................... 46 Figure 6.1: Knowledge Composition Model................................................... 49 Figure 6.2: Particular Knowledge Model Fixed ............................................. 50 Figure 6.3.1: An Ontology Object.................................................................... 51 Figure 6.3.2: An Information Carpel ............................................................... 51 Figure 6.4: The Model Integration Process.................................................... 54 Figure 6.5: Semiotic Triangle ......................................................................... 59 Figure 7.1: POS Retail Schema...................................................................... 63 Figure 7.2: Validator Main Page...................................................................... 75 Figure 7.3: Validator Results........................................................................... 75 Figure 7.4 Supply Schema .............................................................................. 81.
(11) Figure 7.5 Validator Main Page ..................................................................... 101 Figure 7.6 Validator Results.......................................................................... 101 Figure A.1: XML Components ...................................................................... 115.
(12) List of Tables Table 1.1: Investigation Components............................................................... 5 Table 2.1: Data bases generations. .................................................................. 7 Table 2.2: Data base systems levels description. ......................................... 10 Table 2.3: Data languages ............................................................................... 12 Table 2.4: Data Dictionary common notation ................................................ 13 Table 4.1: Ontology Class automobile example........................................... 41 Table 6.1: Model Assumptions........................................................................ 53 Table 6.2: Rule #3 example ............................................................................. 55 Table 6.3: Rule #5 example ............................................................................. 55 Table 6.4: Rule #6 example ............................................................................. 56 Table 6.5: Ontology Relation example ........................................................... 56 Table 7.1: Store Dimension structure ............................................................ 64 Table 7.2: Store Class structure ..................................................................... 65 Table 7.3: Date Dimension structure .............................................................. 66 Table 7.4: Date Class structure....................................................................... 67 Table 7.5: Product Dimension structure ........................................................ 69 Table 7.6: Product Class structure................................................................. 70 Table 7.7: Retail Fact structure....................................................................... 72 Table 7.8: Retail Class structure.................................................................... 72 Table 7.9: Store Dimension tuples ................................................................. 76 Table 7.10: Date Dimension tuples................................................................. 77 Table 7.11: Product Dimension tuples ........................................................... 78 Table 7.12: Retail Fact tuples.......................................................................... 79 Table 7.13: StoreChain Dimension structure................................................. 82 Table 7.14: StoreChain class structure.......................................................... 82 Table 7.15: Store Dimension structure .......................................................... 84 Table 7.16: Store Class structure ................................................................... 85 Table 7.17: Period Dimension structure ........................................................ 86 Table 7.18: Period Class structure ................................................................. 87 Table 7.19: Client Dimension structure.......................................................... 88 Table 7.20: Client Class structure .................................................................. 88 Table 7.21: Brand Dimension structure ......................................................... 90 Table 7.22: Brand Class structure .................................................................. 90 Table 7.23: Product Dimension structure ...................................................... 91 Table 7.24: Product Class structure............................................................... 92 Table 7.25: Branch Dimension structure ....................................................... 93.
(13) Table 7.26: Branch Class structure ................................................................ 94 Table 7.27: Supply Fact structure................................................................... 95 Table 7.28: Supply Class structure................................................................. 95 Table 7.29: Common Class structure ............................................................. 97 Table 7.30: StoreChain modified Class structure. ........................................ 98 Table 7.31: Store modified Class structure ................................................... 98 Table 7.32: Client modified Class structure................................................... 99 Table 7.33: Branch modified Class structure .............................................. 100 Table 7.34: StoreChain Dimension tuples.................................................... 102 Table 7.35: Store Dimension tuples ............................................................. 103 Table 7.36: Period Dimension tuples ........................................................... 104 Table 7.37: Client Dimension tuples............................................................. 105 Table 7.38: Brand Dimension tuples ............................................................ 106 Table 7.39: Product Dimension tuples ......................................................... 106 Table 7.40: Branch Dimension tuples .......................................................... 107 Table 7.41: Supply Fact tuples...................................................................... 108.
(14) Chapter I. Introduction There is a change in how things are done in the world, changing from tangible objects to representations of objects, of intangible nature. It is said, by the Center for Knowledge Systems at the ITESM (Instituto Tecnologico y de Estudios Superiores de Monterrey), that most of the riches generated in the world are produced from representation of objects rather than the objects itself (Carrillo, 1998). The Economist says that the value of investments based on intangible objects is greater than the investments based on tangible objects in the 80s. The Harvard Cleveland comments that 60% of all the paid work it is information related (Carrillo, 1998).. 1.1 Problem Description There is no problem with this new economy of intangibles, the problem is the impact in organizations. Most organizations are not ready for this change; some of them are just beginning to stabilize themselves from setting up an infrastructure for decision support systems. These kinds of changes take a lot of efforts, time and money from an organization, just like the implementation of a data warehouse. It is hard for a company to begin the transition to knowledge based systems because of the efforts and time needed to implement such infrastructure. There are several Methods out there for knowledge based systems, but the most noted is KADS, which stands for knowledge analysis and documentation system. This is a structured method for the development of knowledge based systems specifically (Schreiber, 1992). Even thought there are several Methodologies for the development of knowledge based systems, including KADS which is the most important of them all, they all propose a new way of building systems in general, and only work specifically for knowledge based systems (Shreiber, 1992). This will not be a problem if all systems in the future will be knowledge based, but then, existing systems that are not based on knowledge but on information will be ignored. KADS does not take in consideration the fact that there are a lot of systems that are not knowledge based, and the future will force the enterprises to take the evolutionary step.. 1.
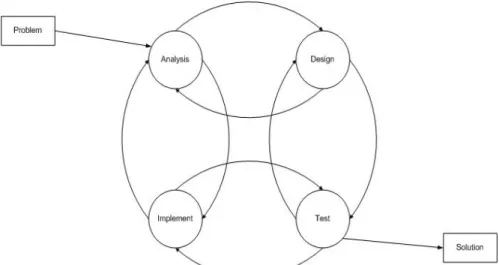
(15) Now, if the future of technology moves towards knowledge engineering, and the next evolution of storage for software is knowledge bases, there is a need for a method that creates all the certain connections in order for the already made data bases and information bases can work as a platform for a new knowledge base. KADS proposes a start from scratch as a requisite in order to successfully use the methodology, but that will be an expensive step, since this will be a new development, and for companies that have been storing information for years, this will not only be painful evolution, but an expensive one as well. It would not be prudent to ignore the work done in the past years inside the companies, and the information stored in their systems.. 1.2 Justification If there could be a way for organizations to reduce the efforts and time in order to get to the next evolving step, that is knowledge systems, then more enterprises would get into the transition process with less risk. The only place where real reduction in costs, time and effort can be produced is in the analysis phase of the systems’ development. There is enough information in today’s businesses already that can be reused to move to the next step, and avoid developing an existing process over again, every time a company want to renovate it self.. 1.3 Objective The main objective of this investigation is primarily to create a model of integration for data warehouses and ontology bases, taking into consideration the fact there is a data base and information base already designed and working. With this, the purpose is to help established companies that may have data bases and information bases all ready in used in their companies, and that were designed using other methods like the ‘Star Joint Schema’ in dimensional based data warehouses. In order to succeed in the objective described before, there are certain steps that are needed to accomplish. These steps can be seen as a Model development Method, which is in someway influenced in the Common Investigation Method. The steps required to the development of such a model are described below a long with its structure:. 2.
(16) Figure 1.1: Modeling Process Flow Chart. •. Identify the Problem: In this step of the investigation, the problem is identified. In the case of this specific investigation it refers to the identification of the need of the model proposed to design.. •. Analyze the Problem and the Context: This step refers to identification of the factors that affect the problem described in the previous step. Also in this step, there will be a comprehensive analysis of the situation, the problem and different proposed solutions that have nothing to do with this investigation, but that can be relevant to its objective. This includes a comprehensive analysis of the widely spread Ontology Component of KADS Methodology for knowledge based systems. After the analysis of the context and the problem, there will be an analysis of a possible solution for the problem. That will contain the components needed for the model to work as desired.. •. Design the Solution: The design phase of this investigation is based on the creation of the solution proposed in the analysis phase, and will contain formal and explicit components based on the solution all ready proposed.. •. Implement the Solution: In this phase the model will be implemented using an existing data base and information base designs in order to apply the model to a real life scenario.. •. Test the Solution: The test phase will take place after the implementation and will try to prove that the model has the properties and the functionality desired.. 3.
(17) The model produced will need to fulfill the following attributes of form: o o o o o. Simple Formal Explicit Flexible Coherent. The model produced at the end of the development process must have the following functional properties: o Must be compatible with the Star Joint Schema. o Must be also compatible with the KADS' Ontology Oriented Knowledge Base design proposed by Noy & McGuinness (2002). o Must be coherent with the information and data contained in the data base and information base designs. o Must be, technically speaking, implementation independent.. 1.4 Components In order to get to the task of integrating information and knowledge, first there is a need to examine comprehensively each of the components involved, in order to avoid confusions or misconceptions. Zeigler and Elzas (1986) proposed a complete definition to express the significance of a Model as a compact representation of a real phenomenon which can generate a behavior comparable with some behavior of interest in the real system and moreover, a vehicle to make more evident key characteristics of an object under study' . In other words a model can be seen as a personal conceptualization of an actual event or process, used mostly as a representation of a real life phenomenon, which means, as a matter of fact, that every model is different from each other, since it depends mostly on the perception of a person over an object under study. This components are the ones needed to make this integration successful, the obvious ones are: information and knowledge. Now in concept, Information includes data, so the three main components are: (1) data, (2) information, (3) knowledge. Each of the components has its own technology and of course a common modeling methodologies to go with it.. 4.
(18) There are, obviously, a great number of technologies and methodologies for each of the components, but as always there is one that is more commonly used, and that is the one that is going to be used in this investigation. In Table 1.1 there is a display of the components with each of the methodologies and technologies that are used throughout this investigation. Each of these components will be described in detail in later Chapters. Component Data. Technology Relational Data base. Information Data Warehouse Knowledge Logic-Based Knowledge base. Modeling Methodology Data Dictionary & Entity-Relation Model Dimensional Model KADS Method. Table 1.1: Investigation Components. 1.5 Thesis Organization The organization of this thesis is as follows. Chapters 2 through 4 describe the main components of the investigation; (2) data, (3) information and (4) knowledge. Each of these Chapters attempt to provide insight in the concepts involving each of the components of the investigation and also establish a theoretical background for the investigation. Chapter 5 formulates the methodology used through the realization of the proposed model in this investigation. The proposed model for the reuse of information from a data warehouse to an Ontology base is described in detail in Chapter 6. In order to validate the model proposed in Chapter 6, Chapter 7 provides a set of application cases which will provide verification of the model’s functionality. The conclusions and results from the investigation are in Chapter 8 and future projects that could result from this investigation are in Chapter 9. There are two appendices in this document; Appendix B for related technologies for Ontology’s storage and Appendix B for the detailed code generation from the application cases of Chapter 7.. 5.
(19) Chapter II. Data. The term ' data'refers to concrete pieces of information that have no meaning on their own, like a number or a word. Gio Wiederhold' s description of the term is described by the next observation: "If we can trust an automatic process or a clerk to collect the material then we are talking about data" (Brodie & Mylopoulos, 1986). Another definition of Data, described by Mizarro in its paper (edited by Jaakkola et al., 2001), relates to data as something physical that can be observed and therefore measured and stored. Inside the knowledge scope, data is the smallest unit, and it can be referred to it as the atomic structure of Information, and therefore of knowledge. There are several types of data, as described by Poli and Mazzola (edited by Kawaguchi et al., 2000), which are the most basic forms of data: integer, float, string, and Boolean. Even thought actual systems do not support other types of data different from text and number related data. Poli and Mazzola (edited by Kawaguchi et al., 2000) describe the current need for a new set of data types, including all pictorial types like ' pixels'(2D) and ' Voxels'(3D) and digital acoustic units ' pcm-quanta'or ' phenoms' .. 2.1 Data Technologies The technology used to store data is called data base, which stores great collections of data which form components of information (Date, 1993). The data base technology is a widely accepted tool for managing large amounts of formatted data (Vossen, 1991). Another way to describe data bases is the one used by Date (1993), which describes a data base system as a system to store data on a computer. Data base systems have a set of common operations that are used to fulfill its duty to manage amounts of data in a computer system; these operations are described below (Date, 1993): • Create new (empty) files to the data base. • Insert new data in existing files. • Get data from existing files.. 6.
(20) • Update existing data in files. • Delete existing data from files. • Erase existing files (empty or not) from the data base. This type of technology is very commonly used in a range from home use to businesses use, has been around since the 1950s and has been a popular asset in the enterprises since 1980s. The history of data base systems can divided in 5 generations as described by Vossen (1991) that stats a range from the 1950s to 1990s, which is in fact the five decades that technology evolve and gained acceptance in the businesses. These generations are mostly based on the advances of hardware and software that occurred during that range of time. Generation 1st 2nd rd 3 4th 5th. •. Decade 1950s 1960s 1970s 1980s 1990s. File systems on tape File systems on Disk Pre-relational Relational Post-Relational. Description. Table 2.1: Data bases generations.. The first Generation refers to the 1950s, and its most important attribute of this generation is that data bases where used mostly for processing data in control of a computer program, which meant calculating, counting and so on. These data base systems were based on a sequential access technology. This is also the time when computers used punched cards as a storage method. Most data base systems where considered a component of information systems of the time, this meant that only the system that had the data base could use the data, a no other.. •. The second generation which refers to the 1960s and its most significant advance were in the use of the news technology, at the time, for storage, which was the magnetic disk. This advance in hardware gave data base systems the ability to manage data in a very fast rate and that led to the of multiple access file systems, that where in fact an advance also in software. At this time, data base systems depended strongly from file systems, which were in fact the forerunners of data base systems.. •. Since data base systems in the later generations, including this one, still were components of a program that manages the data, there where some problems that began to make apparent that the flow of data was to great and that even thought storage was faster, still was not enough. 7.
(21) There were some problems detected in this generation that were partly inherited from the last generation: •. Redundancy: Since there were many programs managing the same data, but in different way, there were several copies of the same that going around.. •. Inconsistencies: this problem arouse due to the fact that there were several copies of the same data going around, and since different programs were in charge of managing that information, there were a lot of data that was updated and some that was not. There was a lack of integration in order to get all the files with the accurate data.. •. Inflexibility: There was a big inflexibility in that way data was managed and how it was created, since it took a considerable amount of time to make a change in the way data was stored, and since there were several copies around, it had to be done to all of them, and this took in fact a lot of time.. •. Low Productivity: Since systems maintenance was, and is, very expensive, in order to keep all systems up to date, no only with the data, but also with the structure of such systems, and all modifications had to be done in all systems related, which was in fact time consuming, bringing down the productivity.. •. Lack of Standards: The lack of standards was also a big problem in this generation, since the modifications that had to be done were increasingly painful, and without standards, all systems where completely different in structure and syntaxes, which made almost impossible to update them. The lack of standards also made a huge impact in how data was managed and therefore stored, so it made quite difficult for systems to communicate to each other.. Figure 2.1: 2. nd. Generation Data base Systems. 8.
(22) •. The third generation which coincides with the 1970s was very important, since it was during this generation, where the distinction between logical and physical data was introduced. This distinction was made in order to separate the supposed meaning of data and the actual values of it on disk. This allowed systems to integrate an all the data into one big collection, avoiding unnecessary redundancy and inconsistencies. This led to the use of data models, which were used to design physical structures (implementation-oriented models), and two important examples are the hierarchical and network model. It is also important to point out that in this generation, and thanks to the great advances in software technology and modeling, the systems that were once before ' data-based'systems, where now called ' data base'systems.. rd. Figure 2.2: 3 Generation Data base Systems •. The fourth generation (1980s) was very important due to several conditions attributed to newly named ' data base'systems, which not only had a centralized control over data in a redundancy-free environment, like the last generation' s data base systems, but it also made a difference between logical and physical data, but at the model level. This meant that the creation of a model that was transparent for physical storage of data, and this led to the creation of the relational model. This relational model provided a physical data independence, making invisible to the designer the actual process of storage of data, and made focus on the supposed meaning of data. So in this generation, there was a turn in the perspective in which data base systems were looked at, from ' record-oriented'to ' set-oriented' .. •. The fifth generation, which refers to the 1990s, it is termed the ' post-relational' generation, and it is mostly based on ' logic-based' modeling of data base systems and thanks to the outburst of object technology, resulting to ' ObjectOriented'data base systems.. 9.
(23) 2.2 Data Architecture Modern data base systems, thanks to the great amount of data managed, need to avoid all problems that could result in a inefficient management of data, taking into consideration an centralized environment free of redundancy and inconsistencies, the use of a unified integrity control that provides means for logical and physical modeling and the effective use of standards (Vossen, 1991). In order to cover all of those aspects, a three level architecture has been proposed and applied for data base systems, which consists of the following levels (Vossen, 1991; Ullman, 1988):. Figure 2.3: Data base Systems Three Level Architecture. Level 1 2 3. Name. Description This level refers to the physical data Internal or Physical Level organization. The conceptual level refers mostly to the Conceptual Level logical general view of the data. This refers to the individual, usually distinct External or View Level user views. Table 2.2: Data base systems levels description.. Distributed Data base Systems First, to understand what a distributed data base system is, the term ‘distributed’ must be described. The word ' distributed'in information technologies (Date, 1993) can be described as several interconnected machines that interrelate to create a communication network, which serves as a platform to simulate only one machine, and process tasks by several machines at one time. A synonymous term to ' distributed processing'is ' parallel processing' . So, a distributed data base system (Date, 1993), is a communication network, that has pieces of the data in each machine, having one machine managing all of the data, even thought it may be stored in a different machine than where the manager is running. 10.
(24) Durbin (1997) describes a distributed data base systems as a set of data bases stored in different computers that simulate to the user as a single data base, making physical data storage transparent (physical data independence).. Figure 2.4: Distributed Data base Systems. Data Independence Data independence, as Vossen (1991) describes, has two important aspects related to its definition: (1) Regarding to physical data independence, which refers to the structured organization of the physical layer in order to provide applications with a certain transparence to physical data storage; (2) Regarding logical data independence, meaning that any user can make a clear distinction between the specific, application-oriented view of the data base and its general logical structure. Ullman (1988) also made the clear distinction between physical data independence and logical data independence, also making clear that physical data independence gives the data base administrator a flexibility to modify the physical data base organization without affecting the efficiency of application programs. Date (1993) only identifies this ' objective'of data independence to physical data independence. Date (1993) made an interesting note about data independence in actual implementations of data base systems, he points out that data independence it is more of an ' objective' , or a goal than an advantage over older data base systems, since physical data independence has not reached an ideal level.. 11.
(25) 2.3 Data Languages In order to fulfill the data base purpose of managing data, there are several languages, described in Table 2.3, which were created to serve as a management tool for all data stored in the data base (Ullman, 1988; Date, 1993). Language Data Definition Language (DDL) Data Manipulation Language (DML) Host Language. Description Language to define or create the data base objects. Language to modify or manipulate data base objects all ready defined or created. This language it is also called ' Query Language' Language to manage computational aspects not specially related to the data base.. Table 2.3: Data languages. 2.4 Data Methodologies Modern data base systems manage enormous amounts of data, making data base design a complex matter, so this requires a methodology to design data to be stored and managed in the data base. The most commonly used design method to build data bases is called ' Data Dictionary'(Yourdon, 1993). Even thought some people are still skeptical regarding the use of method to design data bases (formal development), and use the informal development of defining data directly into the data base without prior planning, Yourdon (1993) states that this modeling tool, the Data Dictionary, is a very easy and fast way of designing data bases. The Data Dictionary (Yourdon, 1993) is based on the definition of data bases, and its data composition in a detailed way. The Data Dictionary can be attached to any software development process and it is specially applied in the structured method that extends the DD., even thought some Object-Oriented software development methods include it. The structured method provided by Yourdon (1993) extends the use of Data Dictionary tool not only to include data stored in a data base, but data flows in a system, which is also acceptable, and in fact successful. This is not the only method to extend the use of the tool, and it can be applied to any method existing thanks to its focus on data. There are two main levels in the creation of a Data Dictionary (Yourdon, 1993; Pressman, 1998): 12.
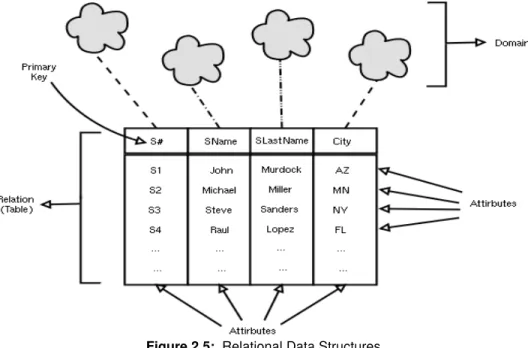
(26) 1. Data bases Definitions 2. Data base Contents Description. (Data Definition) Common Notation Yourdon (1993) proposed this common notation for the creation of the data dictionary: Symbol = + () {} [] ** @ |. Description. It is composed of And Optional Iteration Several Alternatives Comment Data base Key Separates alternative options in the definition phase. Table 2.4: Data Dictionary common notation. The Data bases Definition This step is primarily based on the design of the data bases to be used (Pressman, 1998) using the term ' data bases'as container of data objects. This step, in implementation, is related to the Data base Definition Language (DML) explained in previous sections. In another words, this phase produces a list of data bases which include a detailed description of the objective of it. The Data base Contents Description This phase, which depends strictly on the Data base Definition phase, is based on the actual listing and detailed description of each data field used divided by data base (Yourdon, 1993). The purpose of this phase to construct stable data objects that follow the modern data base objectives: redundancy-free, data independence, the use of standards, avoid inconsistencies and inflexibilities. Relational Model The most common way of representing data relations through data bases is based on a Relational Model first proposed by Dr. E. F. Codd (cited by Vossen, 1991) and it is strongly supported by a data representation language which is called Structured Query Language (SQL). As seen in the name of the model, the relational model is based on relations of data or entities that represent a collection of attributes which work on the context of the problem (Vossen, 1991).. 13.
(27) But first there is a need to describe the components of the Relational Model in order to get a clear understanding of the capabilities and reaches of the representation of information provided by the model. •. Relational Data Structures The Relational Model is composed of data structures, as explained before; those data structures have three main components: Relations, Tuples and Domains.. Figure 2.5: Relational Data Structures. 1. Relation: A relation, in the mathematical sense, is a sequence of attributes in the context of a domain (Vossen, 1991) which can also relate to the term ' Table'as described by Date (1993). 2. Tuple: A tuple refers to a row of a table and an attribute of a column (Date, 1993). 3. Domains: A domain is a collection of values, from which one or more attributes obtain their real value (Date, 1993). Information is a simple concept that has been misunderstood by the Technology community; therefore this confusion has led to misleading methodologies, and confusion regarding the management of information. This makes the search of a methodology for representation of information quite difficult. Even thought the Relational Model could be seen as Information, in essence it is not. The structure of the Relational Model misses the point of Information building, but it creates a great infrastructure for Information Bases construction. The notion of information will be discussed in the next section.. 14.
(28) The Entity-Relationship Model (ERM) The Entity-Relationship Model (ERM) was first proposed by Peter Chen in 1977 and has been extended by a number of contributors (Pressman, 1998). The ERM was created to map data entities relationships in order to increase transaction performance. Relational Data bases are all based on Transaction processing that is why they are usually called ' On-line Transaction Processing' (OLTP). This is accomplished by "dividing the data into many discrete entities" (Kimball et Al., 1996) which they all end up as tables in a data base.. Figure 2.6: ERM Diagram Simplified. Since all complex systems need a complete and formal language to represent its behavior, the ERM aids the Relational Model to create maps of relations between data objects, and with that create meaningful information blocks. An important characteristic about the way the ERM is designed is that all data entities, tables, look the same, there is no way to tell which table is more important than other, so ERM fails to address the need for categorization of data entities, but this is not a defect of ERM or Relational Data bases, in fact it is made to be like that, because the Relational and Entity-Relationship Models only focus on the transaction processing performance. That is the OLPT focuses on processing millions of transactions per a certain amount of time, where each transaction contains a small piece of data. What this means is that an OLPT focuses on the details of the transaction, meaning that any and all transactions requested are responded. In other words the whole point of the OLTP is to process a very large number of small pieces of data without loosing any of them, detailing each and every transaction. The Relational Model and so OLPT systems focus on the consistency of data based on avoiding data redundancy.. 15.
(29) Chapter III. Information ' Information'as described by Shannon (cited by Widerhold and edited by Brodie & Mylopoulos, 1986) is data conveying material that was previously unknown to the receiver. Another way to describe the term can be using Miller' s (1978) vision as ' the degrees of freedom that exist in a given situation to choose among signals, symbols, messages, or patterns to be transmitted". Miller (1978) also makes a distinction where he proves that ' Information'is not the same as meaning, but is more likely to produce meaning. And that is the most important distinction between the definition of the term information and Data. Stefano Mizarro (edited by Jaakkola, 2001) identifies two types of information and proposes a new one, regarding the field of Information Technology, this as a result of the common overload of the terms ' Data' , ' Information'and even ' Knowledge' . These two types are: (1) the objective information, which is based on the idea that knowledge is objective and can be stored therefore managed in a computer; (2) the subjective information, which is based on a subjective or contextual idea of information, meaning that information can only be inferred by intelligence with the relation of data. The proposed type by Mizzarro (edited by Jaakkola, 2001) is called epistemic information, which has the purpose of formalizing information into a graphical form, and is described as the differences between the states of knowledge that the agent had before receiving the information, to the Knowledge state after receiving the information. For the purpose of this investigation, taking into notice that there is so many different definitions of information, the term will be described the following way: Information is a great collection of data related that generate meaning. The term ' Data'and ' Information'are commonly used as synonyms, but there is obviously a distinction between the two. The term ' Data'refers entirely to the real values stored in the data base that is where the name comes from. And the term ' Information' refers to the meaning of the data (Date, 1993).A distinction between ' Data'and ' Information'must be made, in order get a full picture and make a successful integration. 16.
(30) The way ' Data'and ' Information'is commonly perceived affects directly into the nature of Knowledge, since as Carrillo (2001b) pointed out in his presentation that knowledge itself is affected directly by experience, the context and intelligence, and it also states, that information includes data, and that knowledge includes information. Technologies There are several opinions regarding the implementation of technologies that represent information, but all of them are based on common data managing technologies, data bases. This is in fact logical, since Information is composed on data components. As noted before, data is the atom of knowledge construction, and information is built on relations of data, which provide a platform for knowledge building.. 3.1 The Information Era Maybe in the past, organizations suffered for lack of information in general. They could need information to make a decision about the future of the company, or just to buy the right machinery for their factory. The fact is today, that is not the problem, and it goes all the way around. There is an excess of information and a lack of Knowledge. There is so much information going around, and thanks to the Internet, there is an extreme flow of information coming in and out of all the organizations. And it is a fact that all of the information an organization may need o require to succeed in this new world economy is right there in their data bases and information bases. The problem resides in how to get the information needed when needed. The systems in most organizations are rich in information, but poor in knowledge, (Kawaguchi, 2000) and that is the problem. Even thought there are some systems that promise to store knowledge in a knowledge base, it is way too complex to integrate with the information all ready gathered through the years. This operation at the time, it is not done, thanks to the limitations of the Knowledge Base technology and the lack of standards in the field, so, many organizations start all over again, the rest of them, just quit and prefer to stay the way they are. The problem that is trying to be assessed here, is how can the information all ready gathered throughout the years can be integrated into a knowledge base, in order to make an efficient use of information and with it generate knowledge that WILL add value to the organization. In other word, the purpose of this investigation is to add value to the organization with the use of Information Technologies (IT) and Knowledge Technologies (KT).. 17.
(31) 3.2 Information Technologies Data warehousing is used mostly to store big quantities of data organized and grouped in a certain way which serves the enterprise' s needs (Krivda, 1995). This solution was born thanks to the great need of modern enterprises to posses current, accurate and integrated information at the time needed (Brackett, 1996). And the problem is not the Data generation, is the lack tools to that use great amounts of data generated in the organization, and the fact is, that the speed in which the data is being generated is growing exponentially. A really good analogy presented by Brackett (1996), is that this problem can be related to trying to drain a swamp completely, while being waist-deep in alligators. Brackett (1996) uses a term called "disparate data", which refers to data stored that has no useful meaning to the organization, or at least has not been found yet. This creates a very interesting point relating to data warehouses, since Brackett (1996) believes that Data Warehouses are here to gather all "disparate data" and not only organize it in some way useful to the organization, but at the same time adding meaning. Talking about the differences between Data and Information, data warehouses make the difference, and it may also be called an Information Base. Kimball (1996) refers to a data warehouse as the place where people get their data, but he also describes a concept called "data cube". A data cube refers to a set of data interrelated to each other that create meaning, which relates directly to information. The most important thing about data warehouses, that makes such a different approach than relational data bases, is that data warehouses manage time as a series of layers which represent a static snapshot of the data stored in a data base.. Figure 3.1: The Data Cube. The atomic structure of an information base or data warehouse is the data cube, which is mostly based on a series of dimensions, which determine the data relations, and where each point of the cube contains measurement.. 18.
(32) Data warehouses, unlike OLTP systems, are to present the information stored in data base in away that can describe the enterprises situation in a specified time. This is done so that anybody, besides data base designers and information experts, could read the information displayed by the data warehouse and understand what is happening to the enterprise, this approach is made so that Enterprise Managers can get the information they need, avoiding the very complex structure of the relational model. The data warehouse main focus is data consistency but on a different approach than the OLTP systems. OLTP Systems base their data consistency on avoiding data redundancy stored in the data base. But data warehouse look at consistency in another way. Since data warehouses work around ' production data load' , or commonly used daily data layers, consistency is managed globally, not measuring individual transactions. What all this means is that the consistency is measured based on that all information needed for the ' production data load'was accounted for, before the layer was actually analyzed and stored in the data warehouse. Data warehouses, in other words, worry about that all data components to be stored as the company’s information was provided. Kimball (2002) describes a list of requirements in order to have a coherent and business aligned data warehouse system: •. The data warehouse must provide an easy access to the organization' s Information. By easy access, it refers to the organization of the data, and the ability to be understandable, intuitive and also obvious. By Understandable the data warehouse must be legible, meaning that the data stored in the data base generate meaning, as the representation of information.. •. The data warehouse must present the organization' s information consistently; meaning that the data not only be credible, but obtained and cleansed from verified sources around the organization. The consistency is obtained by a process of cleansing of the data depending on the usage of such information. This filter prevents users to manage information that is credible and usable.. •. The data warehouse must be adaptive and flexible to change. Change in data warehouses is essential, because of today' s businesses needs. So the data warehouse must be designed to not only deal with change but to embrace it.. •. The data warehouse must provide means of securing the organization' s information. Information in today' s businesses is one of the most powerful tools for decision making, and that creates an advantage over the competition. This makes the information stored in a data warehouse very important, and for that it must be secured from outside tampering or even stealing.. 19.
(33) The term securing is not only used to protect the information from outsiders, but from sloppy insiders too, in order to prevent accidents that may injure the consistency of the information. •. The data warehouse must provide a foundation for decision making. As said before, the data warehouse is a strategic tool, and therefore, it must be designed to support decision makers in their strategic moves.. •. The business community must embrace the data warehouse in order to accomplish the purpose of the data warehouse. It is not enough for the designers to implement the data warehouse as explained in this recommendations, it is also important, and maybe the most important, that the users of the information embrace the tool and become involved in the process of building and designing the access and the structure.. There' s another view of Data cube, in the eyes of Jim Gray (Soukup, 1999), a Microsoft Researcher which thought of Data cubes as a Relational Aggregation Operator, extending the capabilities of the common aggregation function "GROUP BY". Jim Gray in his Paper (Gray, 1995) explains that the problem in the aggregation function "GROUP BY" is that is only returns a zero-dimensional or a onedimensional results, where in the need for a combination of several factors; the only solution using this aggregation function is by doing several and separate specific queries. So Gray identified two extensions to the aggregate function "GROUP BY"; those two extensions are "CUBE" and "ROLLUP". Where "CUBE" in the words of Jim Gray (1995) is: "...is based on a relational representation of aggregate data using the ALL value to denote the set over which each aggregation is computed. In certain cases it makes sense to restrict the cube to just a roll-up aggregation for drilldown reports." The CUBE is nothing more than resulting "superset of groups" taking the results into another dimension. What this means, is that CUBE can return n-dimensional answers, at least in Gray' s vision. Such definition also answers the relationship of the ROLLUP with CUBE, which is in fact only a restriction used for drill-down reports, or a commonly known control-break report. This solution works fine with this type of results, because CUBE can be a real pain, because it returns a great amount of data would not be needed. This particular view of the CUBE, is the one used by OLAP Services on SQL Server since version 6.5, but since this view is only an extension, and does not add value to the data in order to become information as described by Kimball (1996).. 20.
(34) Data warehouse components Kimball (2002) states that a data warehouse has 4 main components which are displayed next:. Figure 3.2: The Data warehousing components. •. Operational Source Systems: This component has the main purpose of capture the transactions of the business and they are considered to be an outside data warehouse, since there is little or no control over these systems. It is also important to point out, that theses systems should not manage historical records, meaning that it should manage only the actual data in order to keep fast and simple. In a nutshell this is only a capture mechanism.. •. Data Staging Area: The Component referred as Data Staging Area, is the one in charged of extracting and storing the information from the Operational Source Systems, this process is commonly known as "extract-transformation-load" (ETL). The key feature of this component is that it is not accessible to users, avoiding any kind of querying mechanism.. •. Data Presentation Area: This component' s main purpose is to organize, store and create availability of the data of the staging area. In other words, this component is the one that make the information available to users, providing means to "Get the data out".. •. Data Access Tools: This component provides specific tools for querying the data in a specific custom way. A data access tool provides a simple way to obtain the data as simple or complex as needed.. 21.
(35) The Process. Figure 3.3: The Data warehousing process. 3.3 Information Modeling Data warehouses are based on a dimensional modeling technique, which is also called a ' Star Join Schema'(Kimball et Al., 1996). This technique has been around for quite some time, but it has been picked up lately by the enterprises.. Figure 3.4: The Star Join Schema (Data Cube). The name ' Star Join Schema'has been widely used by data base designers referring to dimensional models, and that is because of the structure it has, a large central table, and then surrounded by smaller tables, which form the dimensions. This modeling technique is based on a central table called the ' The Fact Table' , which is the one that stores the "numerical data measurements of the business" (Kimball et Al., 1996).. 3.4 Data Mining Data mining is an important part of information technologies, such as data warehouses, since it is used to build up the information base itself.. 22.
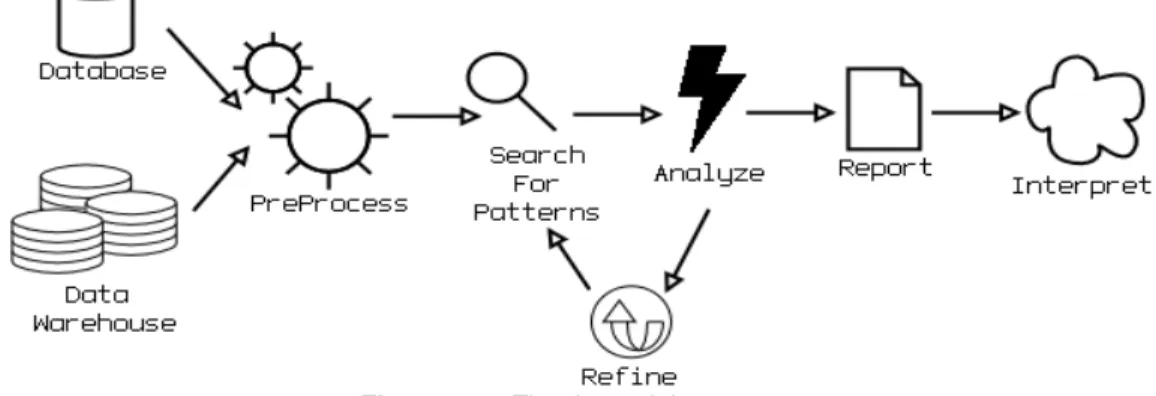
(36) Frydman (2002) explains that data mining is an iterative process which has as a main purpose to identify certain patterns in data bases, so that it can then be used by the data warehouse. The concept of data mining, also known as knowledge data discovery, is based on the idea of recollecting potential useful information from data bases. It is based mostly on statistical and visualization techniques which provide a way for knowledge discovery and presentation (Pyke, 2001). The whole idea behind the concept of data mining is that there is gold behind you data, and it should be extracted from the mines, aka data bases. And thanks to computers, the task of examining and extracting possible useful information from the data bases can be done faster and efficiently (DeJesus, 1995). Data mining can help enterprises analyze information gathered from clients, providers, and even competition, and with this not only act with precision, but confidence (Hedberg, 1995). The Process In order to exploit the data bases and/or the data warehouses there is a need to follow a certain process which involves a series of steps in order to obtain useful information (Hedberg, 1995).. Figure 3.5: The data mining process. • Obtain Data Nuggets: The data nuggets are pieces of data which may become useful information, and they are gathered from the data bases and data warehouse. • Preprocess Data: In this step, the data nuggets are collected, cleaned and stored. • Search for patterns: The search for patterns refers mostly for queries, rules, matched learning, statistics and others.. 23.
(37) • Analyst Reviews: Analysts review the information generated by the pattern searching step, and refine an output to insert back into the pattern search process, and again, until the data is refined enough for use. • Report findings: When the data is refined into useful information, it is time to generate a report of the findings. • Interpret Results: With the report filled, then the analysts and decision makers interpret result to later take action.. 3.5 Data and Information Modeling Evolution is, in essence, a process of constant development in which subjects are required to adapt themselves to the circumstances in order to survive. Humanity has evolved from the material objects into an economy of intangible assets, which seen from a standpoint of human evolution, refers to the evolution in the layers of the mind. Those layers of the mind are data, information and knowledge, which are represented on today' s technology. Data is represented in the common data base technology including index-like software and relational data bases. Information, then, is represented by technology created based on a dimensional model, which not only represents data, but also their relations with other data, organized in such a manner that creates meaning. The next logical step is towards knowledge. As seen in current technology, the layers identified before depend strictly on each other, making clear that they are not mutually exclusive. So, if there are data bases and information bases (data warehouses), there is a current need for knowledge bases, taking considering that the knowledge movement is strongly based on technology. Let' s not forget that just like everything that can be built, there is a constant need of a blueprint or a design model to assure quality, and since Knowledge Base is a new technology, there are limited resources for design of Knowledge bases and there is a need for a design model to create such a blueprint. In the case of the data base design, there is the Data Dictionary (DD) (Pressman, 1998), which serves as detailed list of data with its own definitions, and there is also the here is an Entity-Relation Diagram (ERD) proposed by Peter Chen (Pressman, 1998), which depends on the DD, and identifies the relations between data entities, and several other indicators. Talking about information base design, the design of information is based on the dimensional model, which links several dimensions of data organized in a way that generates meaning to the user; it is nothing more than entities related into each other. Even thought this is part of the data-modeling component of the Structured. 24.
(38) Method popularized by Tom DeMarco (Pressman, 1998), each of the objects of this component can be a separated in order to be used as an independent component. This can be proven, since other methodologies for software analysis and design, like Yourdon & Coad' s Object Oriented Method (Pressman, 1998), use the DD & ERD in their data-modeling component. This takes us to believe, that since the data modeling component of the Structured Analysis has so much time in the field, and other methodologies keep using them in their data-modeling component, then they are stable enough to be used in anything. Remembering what it was said before about the strict dependence-relation between the layers of the mind, and the process of knowledge, it is known that knowledge depends on information, and other factors that it will be talked about later on, and information depends on the data, a relation also identified by Gio Wiederhold in his article (Brodie & Mylopoulos, 1986) about knowledge versus data. Then it can be assumed that whatever knowledge design model it is used to design a knowledge base, it will be safe to base it on the Data Modeling component based on the Structured Analysis. Using the data-modeling component of the Structured Analysis is just a logical step in the building of a knowledge design model, thanks to its proven robustness and usefulness.. 3.6 Data bases and Information Bases Data bases and information bases are common in the real world, and have around for years specially data bases. According to Date (1993), data bases are composed of concrete data that is used by other systems to build information blocks. Information bases, according to Brodie and Mylopoulos (1986), form a large collection of information build up from data. So this creates a relationship between data bases and information bases. Data bases form a component in the information bases. So it is safe to state that information is build up from data interrelated. This creates a new point of view related to information bases and data bases; and this is why the differences between data bases and information bases have been overlooked even thought enterprises use them every day. When designing a computer system that is based on information management, the Relational Algebraic model is the one that makes a data base into an information base. 25.
(39) The Relational model, as explained by Date (1993), is made to create especial relations between entities or data. And this Relational Algebraic Model is specifically linked to the Entity-Relationship Model for designing information bases mentioned before. So this proves that the relationship is not only theoretical, but it is also applied in the everyday technology. Then examples of Information bases, called commonly relational data bases, are Sybase System 11, SQL Server, Oracle, Postgress, etc.. 26.
(40) Chapter IV. Knowledge 4.1 Knowledge Economy The economy is changing, into an economy of knowledge. The base of intangible or representation of objects is gaining field in the new world economy. Changes in all fields are also expected, especially in the Information Technology field, and it may create a new field of research and development: Knowledge Technology. The world seems to be changing from a pre-established form created in the industrial age, and now giving birth to a new age, some say it is the information age, but knowledge age is way more accurate, since Information is only the base for knowledge. Ruggles (2001) described in his article the main reason why knowledge is the next step for an organization. A company’s competitive advantage is based entirely on what it knows, what it can do with it, and how fast it can learn new knowledge. And that makes it an important asset in today' s economy. Knowledge can be seen as a resource, different from the rest of the resources. Knowledge is an interesting resource, since it is based on an intangible form, it does not follow the laws of physics, and since most of the economic theories are based on physic phenomena, then knowledge does not follow the scarcity rule of Economics, but it can be measured. And since it can be measured, it needs to be managed, so there' s a need for Knowledge Management. Knowledge is an intangible resource, and so it can not decrease its amount when used, instead it increases its amount when used. This breaks entirely the law of scarcity of economics, which is the reason why there is a need for a new way of working on the world economy. This is a tendency that has been building up since the industrial age. The burst in Information Technology (IT) it is only the basis for Knowledge Age, which in fact it is the final focus of IT. Technology was created to be a tool, only a tool not an objective. The objective of IT has always been the management of Information, which helps all Working fields in the world, but the objective or the focus is not on Information, it is on Knowledge. 27.
(41) This can be seen while looking at what applying for a job means and also in the burst in certification companies. The one perso who has more knowledge is the one that is best for this job. And certification companies are in charge of identifying what a person has, knowledge-related of course, in order to give you a paper, and that way sell you knowledge at a company. Knowledge is going to be the basis for the future world, and there is no doubt about it. It is time to make Technology distribute our knowledge the best way it can, in order to educate the rest of the world about the fascinating knowledge that is contained in expert minds. The world is changing rapidly, and thanks to the fast evolution of technology, information is reshaping the economy into a different form, where the focus of value is not based only on tangible assets, but on representation of objects, intangible assets. The most valuable intangible asset in this new world economy is knowledge, which in fact is not a new concept. Carrillo (2000) points out that there are three scenarios referring to Knowledge and its impact in the world order: 1. Fading - The first scenario states that the popularity of the knowledge movement has reached its maximum potential impact over the economy, and that it will not directly impact the future. 2. Institutionalization - This scenario states that the knowledge movement it is only going through a phase, and it will eventually create a whole context of a knowledge society. 3. Transcendence - This scenario states that the knowledge movement is not only going to go through a phase, but it will in fact impact humanity in such a way that it will be a key component of future generation economies. Even thought, the Institutionalization scenario is the most widely accepted, the fact that the knowledge movement may Transcendence does not seem such a crazy thought. In fact, it is more likely to happen judging the facts about the evolution of humanity. Knowledge has been proven to be a very important asset of the present and future economy. Yet not all companies have made the jump to the next level, but most of them do have information bases already running on their enterprises. Carrillo (2001) states that the nature of knowledge in the relationship between context, object and subject, knowledge management usually sees participants of an organization as knowledge cells, other way to explain natural knowledge storage, and that the knowledge of the organization can be explained as the union of all their participants’ knowledge. 28.
(42) There is a question on whether an enterprise can really store knowledge in other place different than a human being, and there is a big difference of opinion between the knowledge gurus. Not so recent investigations in the Artificial Intelligence field (Brodie & Mylopoulos, 1986) prove that this can be done, meaning that there is a way to store knowledge in a similar way a common data base is managed; that medium is called a knowledge base.. 4.2 Knowledge Technologies According to Brodie and Mylopoulos (1986) a knowledge base is a storage facility for large amounts of abstract knowledge, and the system that is in charge of the Knowledge base administration is called a Knowledge base Management System (KBMS). So to answer the question posted by Goñi (2002), is yes, and the knowledge base is already a reality. A knowledge base, explained by Yannis Vassiliou (edited by Brodie & Mylopoulos, 1986), has two main principles to obtain the appropriate representation of domain knowledge and the management of such knowledge. Knowledge bases have several uses in the industry, and there are several applications of it in the real world like the examples described by Fensel (2001): Ontoweb, Ontolingua and Ontobroker, which use the Knowledge base to make web searches a lot more precise and functional and learning from each query. Other applications of knowledge bases include Organizational Memory in the enterprises and expert systems.. 4.3 Knowledge Methodologies There are several efforts to create a comprehensive methodology specially on Europe, but the only one that has materialized and spread around quite a bit is KADS, which stands for Knowledge Analysis and Documentation System, even thought in some sources say that its Knowledge Analysis and Design System. Davis and Cailleteau (2000) described the methodology as a Methodology to develop knowledge based systems that supports project management, organizational analysis, knowledge acquisition, conceptual modeling, user interaction, system integration and design. KADS describes software development as two perspectives: •. Results Perspective where KADS provides a way to develop modifiable models related to the system throughout the life-cycle.. 29.
Figure

+7


Documento similar
Government policy varies between nations and this guidance sets out the need for balanced decision-making about ways of working, and the ongoing safety considerations
No obstante, como esta enfermedad afecta a cada persona de manera diferente, no todas las opciones de cuidado y tratamiento pueden ser apropiadas para cada individuo.. La forma
Method: This article aims to bring some order to the polysemy and synonymy of the terms that are often used in the production of graphic representations and to
Construct and implement the proposed model, considering the necessary interfaces to capture and consolidate data coming from different existing information systems and building up
In order to improve this situation, we present Extremo, an Eclipse plugin aimed at gathering the information stored in heterogeneous sources in a common data model, to facilitate
In addition to traffic and noise exposure data, the calculation method requires the following inputs: noise costs per day per person exposed to road traffic
– A graphical modelling tool, based on the previously defined meta-model, has been implemented in order to help designers to build new state-machine models.. This tool, together with
For example, the displacement of a particle in a mechanical problem can be related either to the voltage or to the current variable; in the first case the instantaneous
