Digital Platform of the second industrial market
60
0
0
Texto completo
(2) INDEX 1. EXECUTIVE SUMMARY............................................................................................3 2. ANALYSIS OF THE SITUATION................................................................................4 2.1 Company's presentation…….................................................................................4 2.2 A brief histor……….... ............................................................................................4 2.3 Environment analysis.............................................................................................5 2.3.1 General Environment Analysis...........................................................................5 2.3.2 Analysis of the specific environment...............................................................18 3. EXTERNAL ANALYSIS...................................... .....................................................17 3.1 Analysis of the sector…………………………………………..................................17 3.2 Competition analysis….........................................................................................21 3.2.1 Classification of the competition......................................................................21 4. INTERNAL ANALISIS..............................................................................................22 4.1 Resource and capacity analysis……...................................................................22 6. SWOT ANALYSIS.....................................................................................................22 7. SEGMENTATION, OBJECTIVE AND POSITIONING STRATEGY…………...........24 7.1 Segmentation Strategy………...............................................................................24 7.2 Objective ...............................................................................................................25 7.3 Positioning…….. ...................................................................................................26 8. MISSION AND VISION.............................................................................................27 9. OBJECTIVES AND STRATEGIES...........................................................................27 9.1 Goals……...............................................................................................................27 9.2. Strategies..............................................................................................................29 10. MARKETING MIX...................................................................................................30 10.1 Product................................................................................................................30 10.2 Price ....................................................................................................................46 10.3 Place ....................................................................................................................48 10.4 Promotion............................................................................................................49 11. PROJECT EXECUTION. TIMELINE…………………….........................................51 12. BUDGET …………………………………………………………………………………52 13. RESULTS CONTROL AND CONCLUSION …………………………………….…..54 A. TABLE INDEX …………………………………………………………………….……..55 B. GRAPHICS INDEX …..………………………………………………………………….56 C. INDEX OF IMAGES ….………………………………………………………………….58 I. BIBLIOGRAPHIC REFERENCES .………...……………………….…………………..60. 2.
(3) 1. EXECUTIVE SUMMARY The online platform of the second industrial market is an idea of a business project for the creation and implementation of a new business model without a presence in the network today. A project with global cavity with the use of new technologies. The idea is born from one of the most important needs and duties of the world and society today: caring for the planet. Focused on the ideas and creation of sustainable products in contribution to the environment, which make use of the 3 rd rule: reduce, reuse and recycle. The objective of the project is to take care and protect the world where we live, reusing and taking advantage of all those materials that do not need companies, and that can be used by others. Giving them a new value in the form of a product and at an economic level, putting them back into circulation in the market with innovative concepts and different utilities. Throughout this project the possible viability of the project is studied, analyzed and concluded, and what objectives and incentives it has for companies that participate in the digital platform. The viability of the project goes through a necessary online presence, where reuse and recycle have the digital transformation they deserve, making it possible for companies from different locations to get in touch in order to exchange useful materials between them. What may be no longer necessary materials in the value chain of one company, in that of another, may be the input of its product manufacturing.. 3.
(4) 2. ANALYSIS OF THE SITUATION 2.1 Company's presentation The name we have chosen for the project platform is called “Eco-business.net”. It is a startup that operates internationally in Spanish-speaking countries, mainly in Spain and LATAM, and English in the US and European countries. The activity of the company according to the epigraphs registered in the Tax on Economic Activities corresponds more closely to "professionals in advertising, public relations, and the like." As search engine positioning strategies, social networks, web programming and development, content marketing, inbound marketing, telemarketing, and performance marketing are carried out, focusing on online visibility and digital transformation, as well as relationships between companies, and recruitment of bidding and demanding industries. Therefore, the project is an online platform that connects diverse companies that sell materials that are not useful for them, but very useful for others, that the latter buy to transform them and produce new products that the market demands.. 2.2 A brief history The project arises after the observation of some small and medium businesses that make new products, sometimes even in the luxury sector, with materials that certain companies do not take advantage of throughout their production chain, or of products and materials that can submit tares, and they sell at cost prices to those who can take advantage of it and demand it. There are several examples of this: in the hospitality sector, SMEs appear that make dishes with defective ceramic pieces from the tile sector that cannot be put up for sale, or in the footwear sector, the use of rubber from expired or discarded tires in green dots to make sandals or shoe soles. Hence the idea of putting manufacturers and companies that have materials in contact, for some without value, and for others with great value because they are able to give them a second life and a positive economic result, converting them.. 4.
(5) 2.3 Environment analysis We will carry out the analysis of the environment, first from an international perspective, given that the project has a global presence, and then at the national level, from where the initial strategies and values of the project will start, since the headquarters of the project is located in Spain. We have to remember that environmental awareness and applied policies are not equal or perceived in the same way in all parts of the world, although there is a general concern and awareness.. 2.3.1 General Environment Analysis We will prepare a PESTEL analysis to study the general environment, in this case, in the international field mainly in Spanish-speaking countries of Latin America and Spain, where access to the Internet by citizens is between 65% and 85% respectively , and in English we will find countries in Europe and the United States, where access to the network is 90% and 93% respectively. They are the countries in the world where more people can access the internet, and therefore, where most of the web traffic comes from. Discarding in principle, to China, where both the language and the government regime they possess imply significant barriers to entry at first. Graph 1. Percentage of people who have access to the internet in the world.. Source: National Institute of Statistics, Geography and Informatics. 5.
(6) ONE) Political factors We will study the political-legal dimension referring to the stability of government of the countries and their public administrations, we will analyze what environmental policies they have, and the degree of involvement. The European Union has one of the strictest environmental regulations in the world, which has been built over several decades. The policy of the countries of the European Union forces the economy to be respectful of the environment, and protects the natural resources and well-being of the people of the territory. Despite the elaborate law, Europe faces significant challenges, which are still prominent climate change and unsustainable overproduction. In addition, it is committed to the Paris Agreement, and in applying the EU Emission Trading System (EU RCDE). The European environmental policy is based on Articles 11 and 191 until 193 of the Treaty on the Functioning of the European Union. Article 191, which refers to the fight against climate change, is an explicit objective of the policies that are applied, committing to reach a high level of protection and the commitment to improve the environment, all of which are also included in the Article 3 of the Treaty on European Union.. The US, on the other side of the ocean, which after the new presidency of Donald Trump, has changed policies drastically in opposition to the previous Barack Obama legislature. Its policies abandon the objective to reduce emissions of pollutants into the atmosphere, not considering climate change a priority. It is even debated in the government whether the United States should remain in the Paris Agreement, to which the EU is bound. In addition, Casablanca has already communicated its objective of ending the Climate Action Plan, which requires reducing emissions of polluting gases to coal industry. In short, all the previous regulations that supported the environment are being reviewed and are not in the foreground as if it was done in the past government. Latin America is quite diverse, and the numerous regions that comprise it also have important differences in environmental policies. There are Latin countries in which the. 6.
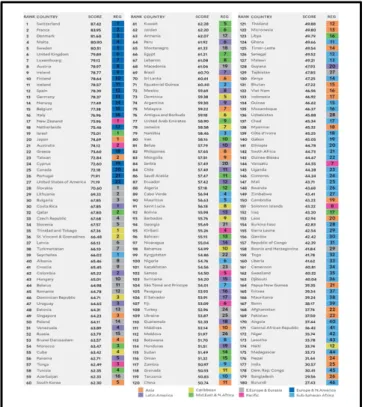
(7) problem of climate change and the environment exceeds their ability to design policies, because at the same time they have other challenges to overcome as emerging nations that are, for example, challenges related to territorial disputes, or also highlighting the richness in raw materials, which are extracted without taking into account the natural environment. However, it should be noted that other Latin countries such as Costa Rica have a public environmental legislation that protects the natural environment for the benefit of the entire community. Its payment for environmental services program stands out, which economically rewards landowners with lush forests in exchange for not cutting them down. In addition, there is the so-called Forest Law No. 7575 that recognizes the protection of forests, water, biodiversity and natural beauty for tourism and scientific purposes. As you can see, Latin America is quite diverse in terms of many aspects, and pollution of the natural environment as well. Next, the Ranking prepared by Yale University is a reliable method that classifies and quantifies the value of environmental policies that a country implements by its number and impact. As can be seen, the top of the list is occupied by Europe, followed by the US and finally LATAM in a very dispersed way. Figure 2. Ranking of global environmental performance. Source: Yale Environmental Index. 7.
(8) TWO) Economic factors Among the factors that we will deal with, we will focus on the Gross Domestic Product (GDP), which will provide us with information on a high or low production of products and services compared to others, and therefore the potential for tares, or obsolete products by territory that could be offered and demanded on the ECO-Business.net platform. We will divide the data, as on the previous occasion, into three zones; Europe, Latin America and the USA. We compare the three blocks of countries in a single graph, in which we can also see not only the exponential growth, but also the level of production of all goods and services between the different regions. Graph 3. Gross domestic product (GDP) in the 3 market regions. Source: World Bank. In the graph we can observe a continuous and upward trend of the US to achieve a GDP of almost 20 billion dollars in 2018, Europe near 22 billion USD and the emerging countries of Latin America exceed just 6 billion dollars. Which concludes that Europe and the US together produce almost 7 times what LATAM. It should be noted that developed countries such as Europe and the United States of America are capital intensive, that is, they produce many more products and services related to technology and a skilled workforce. Highlights include industries such as chemistry, capital goods, automobile, aeronautics and advanced technologies.. 8.
(9) However, Latin American countries, in general, are labor-intensive, as they also have a large amount of demand for low-skilled labor. In these countries the industry is mainly composed of export economies in the extraction of natural resources (mining and oil), work in the field (agricultural), and textile manufacturing (manufacturing). THREE) Socio-cultural factors In this part of the analysis of the general environment, we will collect and study population, birth rate, and main spending trends in Europe, LATAM and the US. The largest population in 2018 is taken by Europe and Central Asia with just over 900 million people, in the region the growth has been greater from 1960 to 1990, reaching a turning point until 2000, where then the population grew by 100 million until 2018. Latin America with almost 650 million inhabitants has grown exponentially since 1960 because the birth rate from 1960 to 1980 was very high in these countries, the average number of children stood at 6 and 4.5 children per woman in that time slot. Third, North America with just over 350 million. The evolution of its population has been progressive, with less slope than LATAM and more similar to Europe. Graph 4. Number of inhabitants per year in the three market territories. Source: World Bank. 9.
(10) Next, because our market is focused on the digital terrain, it is quite interesting to know how many people in these regions have access to the Internet. Figure 5. Number of users with internet access in the three market territories. USUARIOS CON ACCESO A INTERNET (MILLONES) Usuarios con acceso a Internet 1000. 841,5. 800 600. 422,5. 400. 319,9. 200 0 Europa y Asia Central. Latinoamérica. EEUU. Source: self made. Applying the percentages of the population that accesses the network, the graph reflects that Europe and Central Asia with 841 million users head, followed by Latin American countries with 422 million netizens and thirdly the US with 319. On the other hand, we can see in which products and services European consumers spend more money. The following table shows the 10 companies in Europe with the most market capitalization. We deduce with this data what may be the most abundant waste in the garbage of consumers. Table 1. Top ten companies with more market capitalization in Europe. Source: Bloomberg. 10.
(11) The main “top ten” industries that have tangible products as outputs are pharmaceutical, food and beverage, personal hygiene and alcoholic beverages. All of them produce a large number of containers constructed mainly of cardboard or plastic materials. These are the industries where Europeans mainly spend money. In Latin America, extracting the values of greater stock market capitalization in the main Mexican stock exchange and filtering by those companies that sell tangibles, we find the Walmart chain of department stores of the consumer goods industry, called Walmex. Also as tangible outpus highlights the company GRUMA, from the food industry, and that mainly works with products that have corn as a compound, a food widely consumed by Latinos. KIMBER next, from the personal care and hygiene industry (diapers, wipes, napkins, hand towels, etc) Table 2. Top nine companies with the highest market capitalization in LATAM. Name CEMEX WALMEX AMERICA MOVIL GF NORTE GRUMA GMEXICO KIMBER AC. Price. Var. (%). Var. (). Volume (€). Cap.. 15,58 53,59. -0,06% -1,54%. -0,02 -0,84. 774.814.725,83 690.954.977,92 938.294,12. 13,52 110,99 188,69 51,23 33,53 107,58. 2,11% -2,74% -0,12% 0,23% 0,60% 0,20%. 0,28 -3,13 -0,22 0,12 0,2 0,22. 673.646.694,66 643.472.990,01 335.957.580,12 276.424.179,06 251.784.102,59 239.647.509,20. 605.698,47 307.911,72 81.651,10 397.190,70 54.296,94 189.748,65. PENOLES 206,82 Source: Bloomberg. -2,68%. -5,7. 213.150.779,98. 82.197,98. In the US, it is more complex to have quoted values as a reference, since they are mostly technology companies. With the exception of Walmart, which has a great weight among consumers, where shopping is usually done on the outskirts of cities. Information sources such as CNN provide us with the data we seek thanks to its market research surveys, and again, among the most consumed tangible products are those related to food, health, personal care, and textile industry.. 11.
(12) Graph 6. Market research of consumer habits in the US. Source: CNN. FOUR) Technological factors Next, we make comparative of the investment in R&D that each territory makes in percentage of the country's GDP. The data is extracted from the world bank. Latin America and the Caribbean allocate 0.76% of GDP to investment in R&D. Most of the territories that compose it do not reach 0.50%. Only Argentina and Mexico approach 1%. There are differences between countries. Graph 7. Investment in R&D in LATAM. Source: World Bank. 12.
(13) Europe and Central Asia, capital intensive, have an investment in R&D of 1.92% with respect to GDP. Its main industries are chemical, capital goods, advanced technologies, and light industry. They are capital intensive economies.. Graph 8. Investment in R&D in Europe and Central Asia. Source: World Bank. In North America, this investment is one of the highest in the world in the rankings, with that percentage at 2.74%. They are very capital intensive. Its main quoted values are technological. Figure 9. Investment in R&D in North America. Source: World Bank. 13.
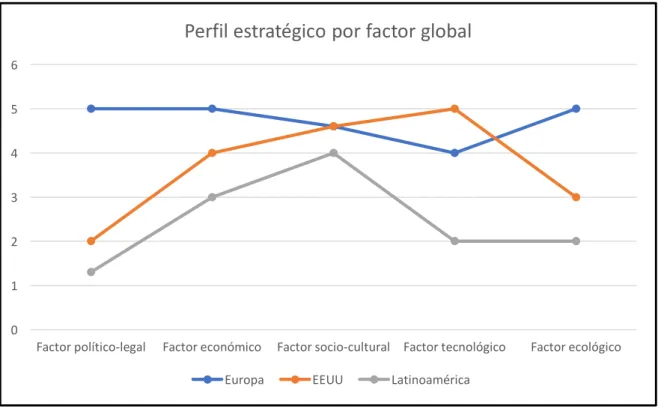
(14) FIVE) Ecological factors Another very important factor that also infers in the ECO-Business.net project is the ecological one. According to the Eurobarometer of the 2014 European Commission, 95% of Europeans consider environmental protection and care important. More than half of 28,000 respondents consider environmental protection "very important." The survey reveals that air pollution is the issue that most worries the citizens of the continent. Latin American countries and the Caribbean bear serious environmental problems. Coforme with ONGVitalis Latin America, due to the exploitation of natural resources, such as deforestation of wild forest areas and poor management of green areas in urban areas. Also the systems of little ecological production, habits of consumption, high levels of pollution, and the scarce environmental policies. From the schools, work and social environments there are not too many awareness campaigns, nor an involvement on the part of governments. Influence in the same way, the poor management of solid waste and waste, and the non-existent treatment of electronic waste. As for North America, according to the survey of the prestigious IndustryWeek in 2007, 52% of employees believe that their companies should be more environmentally friendly. 22% say they have done enough. And approximately 7 out of 10 employees know the ecological policies of the company where they work. The current presidency of Donald Trump does not support measures that protect the natural environment and plans to break international agreements against climate change. We visualize through the strategic profile the analysis performed with the PESTEL model, and conclude how each factor affects each country in ECO-Business.net. The values with which we carry out the valuation are; 1 = they influence very negatively, 2 = negatively, 3 = neither negative nor positive, 4 = positive, 5 = very positive.. 14.
(15) 0. Factor político-legal. Factor económico. Europa. EEUU. Factor socio-cultural Factor tecnológico. (Ecológicos) Latinoamérica. (Ecológicos) EEUU. (Ecológicos) Europa. (Tecnologicos)…. (Tecnologicos) EEUU - I+D. (Tecnologicos) Europa -…. (Socio-Culturales)…. (Socio-Culturales)…. (Socio-Culturales)…. (Socio-Culturales) EEUU-…. (Socio-Culturales) EEUU -…. (Socio-Culturales) EEUU -…. (Socio-Culturales)…. (Socio-Culturales)…. (Socio-Culturales)…. (Económicos)…. (Económicos) EEUU - PIB. (Económicos) Europa - PIB. (Politico-legal)…. (Politico-legal)…. (Politico-legal)…. (Politico-legal) EEUU -…. (Politico-legal) EEEU -…. (Politico-legal) EEUU -…. (Politico-legal) Europa -…. (Politico-legal) Europa -…. (Politico-legal) Europa -…. Figure 10. Detailed strategic profile. Perfil estratégico. 6. 5. 4. 3. 2. 1. Valoración…. Source: self made. Figure 11. Strategic profile by factors. Perfil estratégico por factor global. 6. 5. 4. 3. 2. 1. 0. Factor ecológico. Latinoamérica. Source: self made. 15.
(16) 2.3.2 Analysis of the specific environment For the analysis of the specific environment we will use the model of the 5 competitive forces of Porter. The market to analyze is “online recycling”, a booming market in the offline field, which we have not found in the online world. And we believe in the need for an online presence and organization of this sector. Porter's forces will consist of; bargaining power of customers or buyers, bargaining power of suppliers or sellers, threat of new incoming competitors, threat of substitute products and rivalry between competitors. F1) Bargaining power of customers or buyers. The bargaining power of customers or buyers is not relatively important, because there is little information from companies willing to sell materials that they will not continue to use in their value chain, in addition to the relationship and contact can be tedious for reasons of location and language. Also highlighting, that the greater the volume needed, this bargaining power falls even more, because businesses usually deposit materials directly at green points or landfills, which reduces the supply available to the customer. F2) Bargaining power of suppliers or sellers. The bargaining power is important for suppliers, the ECO-business.net platform has a part totally dedicated to them. This generates a potential amount of goods, in addition to being homogeneous and transparent prices that any user can see, being able to talk even about “perfect competition” markets with some materials, since many units are sold. But currently, and in principle, few industries know or carry out this type of activities because of the communication, language and geolocation barriers that exist, adding that it is usually aimed at very innovative new businesses, the power of sellers at first is of relevance , having a weight that can be considerable. F3) Threat of new incoming competitors. This threat is quite high, at least, in the beginning, because it does not require large investments, and does not present large barriers to entry. So that any competitor wants to enter the “online recycling” market, it would be enough to develop a platform. 16.
(17) that intermediates between the supply and demand of materials and products. The only barrier that may exist is in product differentiation, and brand consolidation, having a database large enough for sellers to sell what they offer, and buyers to buy what they demand. F4) Threat of substitute products. The threat level is not low, it is quite important. Other companies, both public and private, can encourage the collection of material to take it to green points or treat it, giving a reward to citizens and businesses. Small and large businesses in the European Union already have policies that encourage these activities. In Germany, Norway, Finland, Sweden, Israel and the Netherlands, citizens and businesses receive money in return for returning containers. They claim to recover between 80% and 90% of these solids. The business could be transferred to a public entity, without the ability to negotiate prices through the digital intermediary we develop. F5) Rivalry among competitors. There is no rivalry between competitors or it is low. They could be considered as competitors, recycling plants that buy and transform plastic for later wholesale in the form of balls or bags. These companies can cooperate and use the online platform of ECO-Business.net as an alternative sales channel. Alliances or collaborations can originate.. 3. EXTERNAL ANALYSIS 3.1 Analysis of the sector and household waste In Spain, 99% of companies have hired less than 250 workers, and 96% of the total are considered micro-enterprises, with less than 10 employees employed. In the country there are in 2018, 350 companies dedicated to waste management, which invoice more than 2,300 million euros and generate more than 8,000 jobs. 60% of the volume of recycling are metals, and 25% paper and cardboard. We can see the evolution of the number of companies in this sector until 2009 with the data extracted. 17.
(18) from the national statistical institute. New companies are incorporated every year, the increase is practically constant. Graph 12. Number of companies in the waste management sector in Spain. Source: National Statistics Institute (INE). The environmental non-profit organization Ecoembes provides us with information on citizen recycling. In 2015, Spanish cities recycled 12.7kg of plastic containers, and in 2018 they recycled 15.7kg, 12.3% more. As for the paper and cardboard container, recycling has grown from 14.6kg in 2015, to 18.1kg per citizen in the last year.. Figure 13. Yellow container. Source: Ecoembes. Figure 14. Blue container. Source: Ecoembes. Data in Europe according to Cepyme source, shows that 99.8% of companies are SMEs. And where are the countries where it is easier to start a business, according. 18.
(19) to the Doing Business index of the World Bank, in the top 10 are Denmark, Norway and the United Kingdom. Adding that around 7,300 companies in Europe are dedicated to recycling according to the database consulted by Xprt environmental. The source of CEPI (Confederation of European paper industries) in 2012 gives us the following graph, which shows a lower paper consumption since 2005, and at the same time a higher percentage of recycling.. Graph 15. Evolution of paper consumption and recycling in Europe. Source: Confederation of the European Paper Industry. On the other side of the puddle, in the US, and the eighth in the Doing Business ranking (ranking of countries with the easiest to do business), are the companies that make the most investment in R&D in the world. Pharmaceutical, chemical, electronic component business and telecommunications flood the Thomson Reuters list of the top 100 most innovative companies. We also add that there are a total of 30,200,000 small businesses in this region, which account for 99.9% of the total, and employ 47.5% of the population, which turns out to be 58,900,000 people. As for recycling companies, there are 6,380 according to the Xprt environmental database, somewhat less than in Europe. In Latin America, after the data collected by the CEOE, small businesses generate more than half of the jobs, represent 90% of the business network, and generate 28% of total GDP. They are countries with a high rate of new entrepreneurs, but only. 19.
(20) 45% of new businesses survive at least 2 years, compared to 80% in countries of the European Union or the US. In the region 380 companies are engaged in recycling according to the Xprt environmental database, quite striking and low data compared to 7,300 and 6,380 companies in Europe and the United States. Graph 16. Total annual amount of waste per inhabitant and market region Cantidad de desechos por habitante/año y región. 800 700 600 500 400 300 200 100 0 Europa. EEUU. Latinoamérica. Source: World Bank. The World Bank data gives us the previous graph that shows us that rich countries in Europe and the United States generate more waste than less rich countries like Latin America. In Europe the waste per inhabitant per year is 480kg, in the United States of America 730kg, and the average in Latin American countries (some richer and others poorer), 317kg. Figure 17. Total global waste amount by country. Source: World Bank. 20.
(21) The richest regions in Latin America generate more waste than their poorer neighboring countries. Average waste worldwide is 0.74kg per inhabitant per day in 2018, and it is forecast that in 2050, following the same trend, increase to 1.30 kg per capita / day. The countries with the highest income on the planet generate 34% of the garbage. We have to take into account that the inhabitants that make up these countries are 16% of the total world population.. 3.2 Competition analysis 3.2.1 Classification of the competition The competition analysis is carried out through the different levels of competition that exist and through the current competitors. We analyze the capacity, resources, strategies and competitive advantages of companies. It allows us to be aware of the actions and strategies that our competitors do, and take advantage of their weaknesses in search of opportunities. We will also take as reference your products and services that are giving you the best results. A) BUDGET LEVEL COMPETITORS: At this level we find public and private companies from each country or region, where consumers or customers may be willing to dispose or take their waste before selling it on the ECO-Business.net platform. Or even voluntarily transfer obsolete materials to other people or companies for non-profit or profit purposes. In this block we find all public companies and governments of the territories and municipalities of the US, Europe and Latin America. B) GENERIC LEVEL COMPETITORS: Currently there are no other online platforms that perform the same intermediation activity as ECO-Business.net.. C) COMPETITORS IN THE PRODUCT CATEGORY: They have not been found in any of the target market countries. D) COMPETITORS IN THE PRODUCT FORM: Have not been found.. 21.
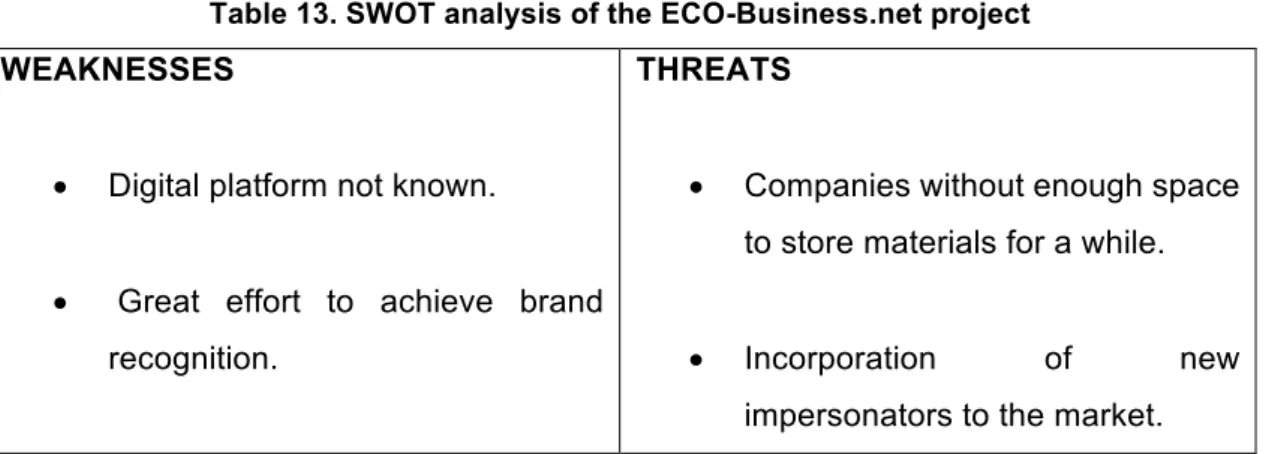
(22) 4. INTERNAL ANALISIS 4.1 Resource and capacity analysis The basis of the analysis is to identify and analyze the resources and capabilities of the company, as well as to consider alternatives that can improve the results of the company. The resources available to ECO-Business.net are mainly non-tangible assets, such as the software of its online platform, investment capital and reserve fund, the brand, the registered domain of the website and its databases. As for the capabilities of the company can be defined as the routines and activities that make the company can achieve its objectives, and that evolve and transform over time through the trajectory of its strategy. The business capabilities are knowledge about the sector and digital marketing, low or practically no competition, and the high adaptation of its equipment to new information technologies.. 6. SWOT ANALYSIS The DAFO tool will allow us to know in what real situation we find the ECO-Business.net project, in order to design a viable strategy with future objectives. The analysis is divided into 2 parts, from an internal perspective of the company (weaknesses and strengths), and from an external perspective (threats and opportunities).. Table 13. SWOT analysis of the ECO-Business.net project. WEAKNESSES •. Digital platform not known.. THREATS •. Companies without enough space to store materials for a while.. •. Great effort to achieve brand recognition.. •. Incorporation. of. new. impersonators to the market.. 22.
(23) •. Initial difficulty in achieving a. Government climate. change. parity, achieving a more or less. environmental. liquid market.. LATAM countries.. against. and. low. awareness. in. OPPORTUNITIES. Digital platform with worldwide. •. Motivation. by. the. ECO-. access in 2 languages: Spanish. Business.net platform, to obtain. and English... an. economic. materials •. policies. balanced supply and demand. STRENGTHS •. •. that. profitability are. no. of. longer. New free market of similar or. necessary in the business value. equal. services. chain, and the manufacture of new. Digital. products and ideas by companies. online. competencies.. that. transformation.. can. use. them. in. their. factories. •. Intermediary platform. It is not necessary. to. have. logistics.. •. Important. awareness in. of. the. Agreement between the selling. environment. European. and buying parties.. countries, in the US, and some in Latin America.. •. Free internal market, regulated by the law of supply and demand.. •. Important GDP, consumption of tangible products and volume of. •. Low fixed costs. It is not necessary. materials in developed countries. to have an office or large number. of Europe and the United States.. of staff. •. Industries in developed countries, with greater probability of tares and materials that are not needed in stock.. •. High. percentage. of. internet. access in developed countries. 23.
(24) (Europe and the USA). Important number of users in Latin America and high birthrate.. 7. SEGMENTATION, OBJECTIVE AND POSITIONING STRATEGY 7.1 Segmentation Strategy Any company that seeks to stand out in the market must know what its potential customers are. Failure to take into account a segmentation in the marketing strategy can lead to extra costs in attracting users. One of the main mistakes made is to think that a product or service is for everyone in the world. Once the strategy is identified, the advertising and marketing budget can be dedicated and adjusted to the group of people we are addressing, and which better and greater acceptance you can have from our service. It allows us to specialize in these groups or people, get to know them better, and pursue the results of excellence. •. One of the options, which is not a segmentation strategy is the mass marketing strategy. Which in principle is discarded, although it is true, recycling should be everyone's business. We segment for the different reasons or interests that users have to use ECOBusiness.net. Therefore, there are several types of profiles that are divided into users or user groups.. You can talk about market segmentation strategies when we refer to:. •. Differentiated Marketing Strategy: The market is segmented into two or more segments that we select. They can be groups of customers according to their. 24.
(25) buying habits, or type of activity of the company. In this case, it is the strategy that we will follow in attracting new customers.. •. Concentrated marketing strategy: Different market segments are located, but by budget, we focus only on one of them. This strategy is ruled out, since we do not have this limitation in principle.. •. Custom Marketing Strategy: In this type, each customer is considered as a single segment. The service is customized to each type of user according to their tastes or needs. We do not consider this modality, because users naturally concentrate on several groups with very similar characteristics.. 7.2 Objective Taking into account the data of the market research and the strategy that best suits the company, of differentiation marketing, the different groups of segments to which we will address in the marketing and advertising actions are created. In addition, throughout the strategy we will obtain feedback from the results of these groups and we can assess which tactics work or can work better. The client objective for the ECO-Business.net platform are private companies that have materials with or without tare not already useful in their value chain. Next, we identify each of these three groups. In reference to the group of private companies, the customer profiles that we can segment are: •. Companies that own materials with tares: Companies with a percentage of defect in their production, which cannot continue working with these damaged materials or sell products already finished in the market. With the platform they can give a profitable exit to the material, before depositing it in a green spot, which also entails a cost of transport and deposit.. 25.
(26) •. Companies with expired or unusable materials: Companies that own quantities of expired materials that cannot be sold, or that the consumer no longer wants. A clear example is the tire, which after a date becomes rigid and is not safe for vehicles. However, this material is fully reusable.. •. Creative and transformation companies: Companies dedicated to creating new products with second materials, or reusing them in their production. Likewise, companies that transform these materials for later wholesale. On the platform these customers can find the materials they need to create their outputs in their manufacturing or resale.. 7.3 Positioning In this section, we visually capture the simulated position that our company would occupy. Only our company appears because it is a new market, that of the online recycling sector. Today there is no such platform. Competitors at the budget level, who perfectly fit as potential customers of the ECO-Business.net intermediary platform, do not have an assessment in the minds of consumers, because they are usually garbage collection companies hired by municipalities and governments that comply with their normal activity, and take this waste to the treatment plants. It is not a sector where the citizen has a price and quality tracking, because they simply know that garbage is collected, and the rest of what happens is not usually known. The ECO-Business.net platform is transparent, because citizens know which companies or individuals sell their materials and who they buy from. The quality of the information is high, and as it is sometimes a market for homogeneous products, prices are perfectly competitive, and therefore low.. 26.
(27) Graph 24. Positioning of the brand in the mind of the consumer. (+) Quality ECO-Business (-) Price. (+) Price. (-) Quality. 8. MISSION AND VISION ECO-Business.net is a Spanish startup, with an international presence in two languages (English and Spanish), in the countries of Europe, the US and Latin America, whose mission is: “Facilitate communication between companies from different parts of the world that generate and dispose of materials that they do not need, to be used by other businesses in which they do have a value for the manufacture of products ”. The long-term expectations of the company are marked by its vision: "to become the world leader in the industrial recycling market, increasing awareness, and the commitment of companies".. 9. OBJECTIVES AND STRATEGIES 9.1 Goals Several levels of objectives differ. These are goals to meet the resources available. It should also be noted that these are not static and that they need to be reviewed periodically, in view of the alteration of the environment and the internal situation of the organization. First, the generals will be defined, which are consistent with the mission of the business. Among the generals are:. 27.
(28) •. The general objective, coincides with the mission of the project: "Facilitate communication between companies from different parts of the world that generate and have materials that they do not need, to be used by other businesses in which if it has a value for the manufacture of products.". Regarding the second level of objectives, the specific objectives are classified, which the company carries out in the medium term: •. Objective A: Carry out digital advertising campaigns to attract small and medium enterprises that generate or dispose of materials that they will not use.. •. Objective B: Create digital advertising actions to capture businesses that buy second-hand materials that they incorporate in their value chain.. •. Objective C: Position the website of the ECO-Business.net platform in the main search engines.. •. Objective D: Create digital brand recognition in Europe, the US and Latin America.. Next, we extract the functional objectives, which are more specific and determine how the proposed goals that we have set out in general will be achieved. They all flow from the marketing area of the company. The company seeks to monetize its activity in the medium / long term. First, it seeks to attract the initial users and sympathize with them, so in the first phase the objectives in the financial area are not a priority, since the company will initially offer its services, at no cost to the client: •. Goal A1: Attract at least 500 private users in the year interested in selling or buying recycling waste.. •. Goal B1: At least 10 companies interested in selling or buying classified recycling materials during the year.. •. Goal C1: Be visible in the Google search engine in at least 50 search keywords.. 28.
(29) •. Goal D1: Create agreements and be visible on a minimum of 10 Web pages in Europe, 10 in the US and 10 in Latin America, where there are users potentially interested in earning income from recycling, either selling, or buying to create recycled outputs in their small workshops.. 9.2. Strategies The strategies must be consistent with the objectives that have been established. They will mark how we should execute different actions to achieve the proposed goals, which will give us the results we seek, and that will fulfill the business's stated mission. First, we will analyze what strategies we will follow, using the Ansoff matrix, which allows us to identify growth opportunities. Our business model follows a market development strategy, because a business activity is exercised with recycled products that previously existed, but with a digital transformation and online presence that generates a new market through a new channel, because it does not There is evidence that there are companies that are dedicated to the digital intermediation of buying and selling recycled materials between companies, and also with an online platform of transparent prices and 100% accessible to any type of user who wants to perform an operation at the time. Besides, if we analyze the strategies according to the model of Michael Porter, we are clearly facing a differentiation of product or service. The rest of recycling companies do not have a real-time pricing tool, the information and access to the purchase or sale of materials is opaque and bureaucratic, in addition to not being accessible to any user. Therefore, given the service and advantages that our platform offers, even useful for these companies not yet digitized, the service is differentiated. Then, according to Miles and Snow, in ECO-Business the most beneficial strategy to adopt is the prospective one, due to the ease of entry of new competitors and the technological market in which it is located, since there are no significant entry barriers , at least in terms of economic resources, and the market is very changing due to network technologies. The startup must be constantly looking for new opportunities, reaching new. 29.
(30) customers in different possible ways. This dynamism is also possible thanks to the low hierarchy and high flexibility that this project has. Finally, according to Kotler and Singh, the recommended strategy is the market development of the leader. As we have mentioned on previous occasions, it is a new market that promotes new forms of product marketing, in which there is no competition at the beginning. And the intention is to increase the frequency with which companies sell and buy materials to give them a second product life.. 10. MIX MARKETING In this analysis of the strategy we will address the internal aspects taking into account the main variables of this study, which are the product, price, distribution and promotion. These variables influence the market decisively. Developing the startup positioning strategy. Regarding the price, a very competitive element in the market, we will establish what kind of rates are in the intermediation service offered by the platform. In the product we will also take into account all those supplementary ones such as customer service and operations guarantees. Next, in the distribution we will define the channels through which we reach the client or user. To conclude, and an important part of the activity, be visible and position ourselves very well as a private brand, speaking in this case of the promotion, where we will focus efforts so that the service is known.. 10.1 Product The product of ECO-Business.net is an intermediary platform between an offeror and a demand for recycling materials. It is a platform designed and created through customized development from scratch. On the Web, unregistered users can see the offers that exist, being able to get an idea of the available stock.. 30.
(31) There are two services: One for users and private or public companies offering classified materials, and another for demand, who wants to buy them. Users interested in buying or selling materials can register. Once inside the account, there is an area for the bidder where new materials can be published with a private or public company profile. This area also allows to define the method of collection, personal data, data modification, withdrawal of the account balance, attend private messages of buyers, purchase requests, edit the published offer, view their statistics, details of transactions and estimated cumulative weight of contaminants saved, in Kg of CO2. In the user zone of the requesting or buying party, the user can see his purchase history, accumulated contribution in weight of Kg of estimated CO2 saved that will not affect the environment, his balance, private messages with the bidders or sellers, modify and View your data and profile, search for materials using filters or special preferences, even be able to place materials classified as a seller on the market. The platform is managed by an online marketing and advertising agency, because its staff is mainly composed of experts in this field, being able to modify the trajectory and approach of the improved project, create other annexes, or have the ability and ability to change the objectives and strategies at any time. When a purchase-sale operation is carried out, the balance in the form of money goes directly to the bank of the platform, which releases as an intermediary, the balance to the selling party when the buyer notifies that she has correctly received the order. Within the Web you can create disputes about unsatisfactory or doubtful operations, which will be resolved by the advertising agency staff in the most objective and justified way possible. In addition, there will also be an insurance policy for more complicated cases or fraud. The entire website is intuitive, simple to understand and use. It is mainly composed of images. It aims to attract the attention of companies that wish to make a final return on materials that they will not use or that are a consequence of their regular production. The Web is hosted on a private dedicated server located in Ireland, with an unmanaged server company called OVH. It is a Rise-1 server, which is powerful enough for the traffic that the Web can have at the beginning and in its growth, thanks to its Intel Xeon E31270v6 with 4 cores and a connection of 500 Mbits per second. The domain that redirects. 31.
(32) through DNS to the server, is managed under the company Dondominio.com, which offers the best prices and qualities for domain names and an intuitive interface on its user panel. Web design is created based on a template by a graphic designer from Envato.com, a platform of freelancers specialized in different areas of digital technologies. Within the classification of materials, where the user can filter and search for specific products, there are several product lines and a number of important portfolio references. We distinguish the different products in which the company offers by default classify What can be sold or bought. In the breadth of category, users can filter materials by:. Light, plastic and cork containers. Metal. Paper and paperboard. Crystal and glass. Wood. Rubber. Machinery. Ceramics. 32.
(33) In addition to the breadth of category, users can select other search filters within it, showing the following product length data: A) Light, plastic and cork containers. Packaging and bottles. Bags. Cans. Plastic fragments. Feeding containers. Toys and other plastics. A) Paper and paperboard. Boxes. Bags. Paper, sheets and labels. Miscellaneous and food containers. Cardboard fragments. Other formats. 33.
(34) C) Crystal and glass. Containers and the like. Various bottles. Glass fragments. Mirror fragments. D) Metal. Screws and DIY. Beams, slats and other construction materials. Faucets and other household items. E) Wood. Wooden pallets and slats. Wood chips and other small pieces. Furniture 34.
(35) Logs and natural or bark wood. Wooden chopsticks and the like. F) Machinery. Fragments and waste of machinery. Obsolete technology. G) Caucho. Tires. Granules and other forms. 35.
(36) H) Ceramics. Tiles. Roof tiles. Sanitary ware. Crockery. As for the depth of the line, it is introduced by the one who publishes the product offer on the web, due to the multitude of variables that it can have, in which it can be classified by weight, shape, color, granulate level, origin, product status, etc. The consistency of the products is low. The different materials offered are not closely related, and although they have the goal of being used for reuse and recycling, very uneven uses can be made of them. Some of the outputs that may arise from these products intended for recycling are very ingenious and useful. There are already stores dedicated to it. This platform can be a supplier of these stores or small workshops that think, design and create new objectives with materials that give a second life and also contribute greatly to the environment and protect the planet. Next, we expose some of the outputs that have already been created. We classify these new products, by the materials used in their breadth of category or lines. For that same reason, our service is to be the perfect supplier of these large-scale materials.. A) RECYCLED PRODUCTS WITH LIGHT, PLASTIC AND CORK CONTAINERS Greenhouses, cabins, storage rooms, and booths of plastic bottles and other light containers can be made. This means cost savings, use of existing resources and an important utility. These materials allow different shapes to be made and can be worked comfortably by being flexible.. 36.
(37) Image 1. Greenhouses made with bottles. In developing countries, with extreme poverty, or even where there have been major natural disasters, rescue camps, sanitary facilities, shelters and houses can be created with recycled materials derived from light, plastic and cork containers, which also waterproof so thermal and acoustic outside. At the same time that we take care of the environment, we make it easier for people with more needs in the world to take refuge.. Image 2. House made with bottles. Image 3. House made with bottles (2). They are also used for the elaboration of school and office supplies, gifts and decoration. Let's see some examples below. Image 5. Trash bin Image 4. Cases for storing targets. 37.
(38) Also even for different forms of irrigation and distribution of water in gardens, lawn and farmland. And new ways of cultivating. Image 6. Different forms of irrigation with bottles. Other examples are ecological solar heaters through the use of bottles, and the construction of water pipes and pipes. Image 7. Solar water heater. Image 8. Pipes with bottles. 38.
(39) A) PRODUCTS RECYCLED WITH PAPER AND CARDBOARD It can be used for the construction of ecological bookstores, home sofas, restaurants and hotels of green or vintage design, baskets, bins, toys, recyclable chairs for events, chairs for children, etc. Safe toys for children, which can be painted, do not cause injuries, and can even be expanded with new modules. It promotes innovation and creativity of the youngest. Image 9. Paper and cardboard toys. Events with recycled furniture, ultra light, ecological, practical, simplified, fully customizable, for example, with the brand of the company or event, of few uses and improvised. Fully recyclable and manufacturing and assembly in a short time.. 39.
(40) Image 10. Recycled elements for events. A) PRODUCTS RECYCLED WITH GLASS AND GLASS The products recycled with glass and glass of workshops and any company dedicated to the recycling, are practically unlimited, innovative, of design and with excellent qualities. In addition, differentiated, handmade and unique products with a high market price, and with an attractive profit margin. That this type of recycling is visible, motivates the entry of new competitors to the industry that would contribute to the environment. The target audience for these recycling pieces are usually, for the most part, select customers, who are looking for new shapes and designs. Among the segments in which these outputs are demanded are, from middle-class, medium-high, high and very high homes, hospitality, fine cuisine and luxury restaurants, collectors and lovers of architecture and design, private events, Boutique shops and original gifts. In the hospitality and catering industry, recycled products are manufactured for the presentation of dishes in haute cuisine such as the following: Image 11. Glass for the elaboration of dishes in the hospitality industry. 40.
(41) As for decorative elements for gardens, homes, restaurants, and practically all kinds of environments, we find original products in which we can perfectly see what recycled materials are made of. The following cases stand out, in which different lighting elements can be created, produced by candles, or simple bulbs with an electronic system. Glass is a material that many bottles are made of, and it is easy to mold, or even cut with simple and economical techniques. Image 12. Decoration and lighting with glass. Imagen 13. Deco. Image 13. Decoration and lighting with glass (2). 41.
(42) Also the manufacture of marbles for kitchen countertops or dining tables with glass inlays are a trend in the market today. Or the elaboration of jewels from polished crystals by hand or by currents and erosion of rivers, seas or oceans. Image 14. Countertop with glass. Image 15. Crystal jewelry. A) RECYCLED METAL PRODUCTS There are numerous types of metals, some softer than others, and from them you can make accessories, accessories, ornaments, lighting products, or even toys. The possibilities, as always in recycling, are endless. Companies that have advanced machinery melt the material and make molds for products where their previous use is not appreciated. Below are some of the recycling possibilities that private firms make.. 42.
(43) Image 16. Accessories, decoration, toys and lighting with recycled metal. It is interesting to sell small containers made from soda cans, which make fire for a limited time, to carry several in camping luggage, camping, mountain excursions, or for emergency situations. These containers contain inside a measure of alcohol, which is flammable, and generates heat in the form of distributed flames, to be able to cook food at any time in isolated places or without electricity, or to disinfect utensils in urgent situations. Image 17. Mini camping fire for cooking. 43.
(44) A) PRODUCTS RECYCLED WITH WOOD From stairs with wooden pales for a loft or open space, through a table in the most rustic style taking advantage of a wine canister, boxes to store things that we will not use for a while, chairs or elegant decorations for unique places, Prefabricated houses or different ecological elements for the streets of numerous cities that need wooden benches or create green spaces with outdoor planters. Image 18. Products made from wood recycling. A) PRODUCTS RECYCLED WITH MACHINERY Different combinations of machinery can be made, including repairing them with new elements and giving them a second life. This depends on the technology available to each company or workshop. Image 19. Machinery manufactured from other machinery elements. 44.
(45) A) PRODUCTS RECYCLED WITH RUBBER The manufacture of shoe soles and rubber flip flops, tables that have as a base element car tires, tables, stools for sitting, ultra-breathable plant pots, accessories and accessories such as bags, bracelets and watch straps, and even spongy floors for playgrounds, gyms or homes, which guarantee safety and a new walking experience. Image 19. Accessories, shoes, furniture and floors with rubber wheels. A) CERAMIC RECYCLED PRODUCTS With ceramic tiles, original dishes are produced for the presentation of menus, and a great variety of drawings and shapes with fragments of broken tiles: for walls, floors and ceilings, mosaics in kitchen and living room tables, planters, pillars, facades, or any building element that you want to cover or decorate. Image 20. Dishes for hospitality and floor and wall cladding with fragments of recycled tiles.. 45.
(46) These are just a few examples of all the products that could be created by buyers of classified materials on the platform. The diversity of tools that can be created is infinite. The Web of ECO-Business.net also has a blog in which recycling ideas are published and which is also positioned in the search engines, sending the newsletter to the registered users. The blog aims to give ideas and motivate companies to take advantage of this type of materials. The usual purchase or frequency depends on the demand and production of the companies. The products sold by them are mostly durable goods. The consumer takes time to decide the purchase.. 10.2 Price The price that ECO-Business.net charges its customers for using the service, has three phases. The first seeks to develop the market, the second to achieve a minimum return that covers costs, and the third, to obtain a long-term return. A) FIRST STAGE (MARKET DEVELOPMENT): In the period of market development, and so that there are the least possible barriers to entry for the customer, some costs will not be charged. Transactions between buyer and seller will be carried out under an intermediation rate of zero euros. At this stage, the objective defined in the medium term is to capture the appropriate profiles for the Web community and generate the database for subsequent loyalty. In this way it is intended to achieve a market penetration with the price.. 46.
(47) B) SECOND STAGE (AT COVERED COSTS): At this time, the evolution of the user database has been favorable and we have met certain objectives. We have managed to like an important group of users, who can make us known thanks to the mouth-ear. Therefore, a rate is established that allows the company to cover its minimum costs and needs. Even so, the rate of each transaction is low. The price of the service is always assumed by the buyer. This encourages attracting a greater supply of sellers. The rate to be established may vary depending on the costs of the company at the time of setting the price. By default, it will be a percentage of the transaction, which will start scalable, from 3% of the total amount. For a transaction of 100 euros will be a benefit of 3 euros for the platform. C) THIRD STAGE (PROFITABILITY AND LONG-TERM CONSOLIDATION): In this phase, the company offers a service for which its users are willing to pay a set price. It is time to establish a long-term rate for which to obtain a higher return on profits. The company has growth prospects with lower risk. The rate will be scalable based on management decisions and expectations. The rate will go from the one established in principle by default of 3%, to 10%. The company will enter for every 100 euros of transaction, 10 euros in their accounts. Given the volume of users and transactions at the moment, considerable income is given to cover costs and begin to obtain benefits. With this market penetration strategy, the intention is to offer the user the incentive to use and try a totally new service. Motivate and retain it by sending newsletter for a longterm collaboration together. As for the prices that the bidder may have on the platform, they are established as a free trade. And prices are classified into two types, according to Michael Porter: A) Cost competition prices: The most homogeneous products or with enough offer in the market from many sellers, their prices will be low. They are easy to find goods in different markets, or on the ECO-Business.net platform. The transactions of these products are the most regular. B) Prices for differentiation: They are the rarest, singular, or hard to find materials in any market. Due to their shortage of supply, their prices are higher. Depending on their rarity, the material with which they are composed, etc., their price will be higher or lower.. 47.
(48) As a summary, these are all the price and decision possibilities of the user that exist on the Web. Either from the rate of business revenue, or from the prices established by the free trade and competition market on waste classified as buying and selling. It should be noted that the part of the demand can also generate offers against the bidder in the ECO-Business panel. In this way, they are able to close a greater number of agreements and generate greater market flexibility, where supply and demand meet. It also allows discounts to be made for the largest volume of material purchased.. 10.3 Distribution or place The headquarters of the company of ECO-Business.net will be in Valencia, in a location and economic place, because its members are autonomous, and very few at the beginning, hiring according to their needs, servers, programmers, or personnel of customer service, to freelancers in places like Workana or Fiverr. It is about economically simplifying resources, having diversity of knowledge, and getting the most out of it. The place where all operations occur is on the Web, a digital space that allows thousands of users to be kept in the store at the same time. The email channel offers more personalized attention, and is used for inquiries and problems with the platform or orders, also acting as a mediator between buyer and seller. The distribution channel is long, since it is a broker channel, which intermediate between buyers and sellers. Once the sale is made, the selling party is responsible for sending the merchandise to the buyer, and the latter manufactures a product for the final consumer or can even resell it to a third party who will then sell it to a wholesaler or retailer. The possibilities are endless. We mainly talk about a long channel. In addition, the distribution coverage is intensive because you can place the products in all the places you want, because the communication channel is the Internet, a place with worldwide reach.. 48.
(49) 10.4 Promotion The promotion part in the marketing mix meets several of the specific objectives of the marketing plan that it seeks to inform, have a persuasive power and remind the audience of the brand and the product. The tools in the development of the promotion for ECO-Business are advertising, sales promotion, personal sales, direct marketing and public relations. Next we will detail how we will use these tools from the operational level.. A) PUBLICITY From the point of view of the advertising actions that will be carried out, part of a good SEO positioning, focusing on the keywords that potential users can reach. These keywords are related to the care of the environment, ecology, information on recycling, volunteering, and the ecological and responsible company with the planet. Through landing pages and posts in our own blogs and third parties well indexed in Google and Bing, we will attract the interest and visit of potential users, at the same time that the relevance of our platform becomes more valuable in Google. In the SEO activity, the link building is also worked, with the possibility that we can link important media, and therefore get quality links and increase our visibility. Another important part is the allocation of the budget to pay per click advertising through Google Adwords and agreements with other websites related to potential customers. Social networks and environmental awareness groups are another of the advertising channels with the greatest social impact. The purchase of pay-per-click ads and sponsored posts in groups of topics related to the environment are potential collaborations.. 49.
(50) A) THE PROMOTION OF SALES For any new buyer user who registers on the platform, he has a credit of € 75.00 in his ECO-Business.net panel to acquire recycling materials in his first operation. This credit motivates the user to take an interest in the platform, use it, and interact with vendors.. A) PERSONAL SALE To attract and make known to manufacturing companies that have obsolete or tare products, or other companies of interest with materials that can be included in the ECOBusiness market, contact us by phone or in person, until the specific objectives of the plan are achieved of marketing. This personal sale has an after-sales follow-up and helps these companies know how to handle the control panel and correctly introduce materials into the second market, or buy them.. A) DIRECT MARKETING Through direct marketing, email marketing actions are carried out in our own and thirdparty databases to inform about the service offered, showing the opportunity to sell obsolete products for some and an opportunity for others, in a second market (the online platform), and get a final value or profitability. Or for small workshops and creative companies to help them have the materials they need to maintain or increase their production quickly and easily. In emails, creativity and content are prepared each segment or customer profile defined target. For the ordinary or postal mail channel, the same technique will be used as in e-mail, through the mailbox for areas where industrial companies are located. On the other hand, telemarketing is used for contact with potential clients of large companies, potential sellers and buyers of large quantities on the platform. Through banners with agreements on websites, blogs and forums of third parties, interested visits will be captured. They are also motivated and informed through landing pages about the possibilities of doing business related to recycling and creating small. 50.
(51) workshops that manufacture outputs. The idea is to generate a culture and idea about this new business concept, which also encourages the user to buy to create, earn profitability, and protect the environment, creating a win-win-win.. A) PUBLIC RELATIONS Public relations are motivated from the user panel of ECO-Business.net. Users will be able to post opinions about transactions made with other companies and workshops, and recommend the project to other entrepreneurs they know.. 11. PROJECT EXECUTION. TIMELINE Table 14. Timeline for the execution of the different phases of the project Año 2020. January. February. March. April. Mayo. June. July. August. September. October. November. December. Web development SEO and Link building Google Adwords Social networks Facebook Ads. Membership. Telemarketing Email Marketing Mailbox. Display SERVICE RATE. 0. EUROS 3% SERVICE RATE 8% SERVICE RATE. To organize the tasks and objectives that will be carried out within the project, a timeline is established, which guides and sets the pace of task execution and goal fulfillment. The planned year for the start of this project is in 2020.. 51.
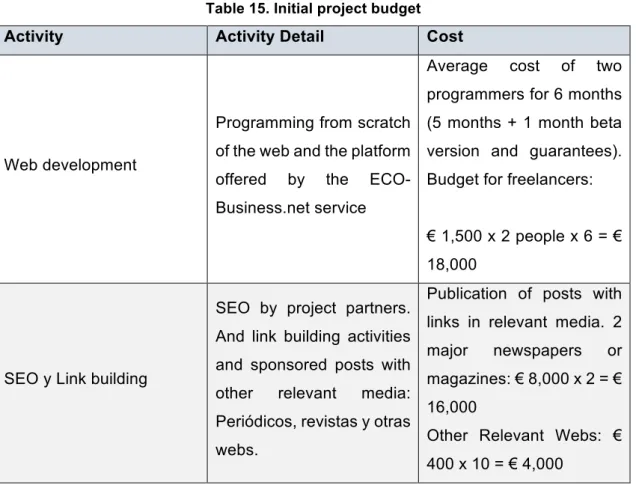
(52) The tasks related to advertising and digital marketing are carried out together to capture the different target profiles of companies. It's about most of the tasks and goals. As can be seen in the timeline of the table, the collection of the user community starts from the moment the project ends. The development of the ECO-Business platform is thanks to freelancers who provide their services, programmers or ENVATO informatics. The initial beta version is tested by the members of the company and the users who use it. The free service rate for the user, within the Marketing Mix tools, will be extended up to a medium term, starting at the end of the current year of the project, the service rate that only covers costs, that of 3%. The 8% service rate is established in the longer term, in approximately 1 year from the 3% service rate, and that is why the latter does not appear in the table.. 12. BUDGET Table 15. Initial project budget. Activity. Activity Detail. Cost Average. cost. of. two. programmers for 6 months Programming from scratch (5 months + 1 month beta Web development. of the web and the platform offered. by. the. version and guarantees).. ECO- Budget for freelancers:. Business.net service € 1,500 x 2 people x 6 = € 18,000 SEO by project partners. And link building activities SEO y Link building. and sponsored posts with other. relevant. media:. Periódicos, revistas y otras webs.. Publication of posts with links in relevant media. 2 major. newspapers. or. magazines: € 8,000 x 2 = € 16,000 Other Relevant Webs: € 400 x 10 = € 4,000. 52.
(53) Total link building = € 20,000 Payment by keywords in Google Adwords. Search Engines. Words budget. for. Google. related to ecology and the. Adwords € 600 x 8 = €. environment.. 4,800. Contact Social networks. Estimated initial monthly. with. different Contact with 8 relevant. relevant influencers for the. influencers for sponsored. publication of sponsored posts. Post price € 1,500 x posts.. 8 = € 12,000. Facebook Ads And other paid Facebook Ads. ads. networks. on with. social Monthly budget of € 100 for words Facebook. related to recycling and the. Ads. for. 8. months = € 800. environment. Membership. Marketing. actions. with. affiliate agencies.. Price for each new user € 5 x 3000 users maximum = € 15,000 Subcontracting. Telemarketing. to. the. Contact by phone to attract switchboard the telephone large company customers.. call service. 300 calls at 5 euros = € 1,500. Email. Marketing. advertising Email Marketing. with. agencies. in. third-party databases and other websites with user communities with target. Payment per 1,000 emails at € 18. Total 1 Million emails to send = € 18,000. profiles. Buzoneo. Outsourcing of local mail company in Valencia. Agreements. with. Payment for every 10,000 flyers 180 euros. 100,000 flyers in total = € 1,800. third- Visits to get 50,000 unique. party websites related to IPs. CPC price (pay per Display. recycling and earn money. click) at € 0.30. Maximum. online to install banners total for the volume of and links. Also the use of clicks achieved = € 15,000. 53.
(54) the. Google. Adwords. Display network. TOTAL BUDGET =. € 106,900.00. 13. RESULTS CONTROL AND CONCLUSION The results are checked by comparing them month by month. Its evolution is given with the data provided by Google's ad platforms, Facebook and affiliate agencies. In these same panels, in addition to the numerical data shown, they offer statistics, tables and comparative graphs.. In collaborations with third parties, with influencers, display and databases in third-party media, the Google Tag Manager tool is used. Through the tracking pixel it facilitates. Also, in the Business Intelligent panel of Google Analitycs you can see what channels the traffic comes from, compare it in timelines, user interactions, country, language, bounce rate, recurrence, etc. Thanks to this tool it is also possible to visualize from which newspapers or media the users come, or even if they enter the Web already knowing the ECO-Business.net platform, through the search of the brand in search engines (which is measurable), or if they are direct visits on the Web without having gone through a reference link. Through this latest data you can also know the popularity of the brand. In the ECO-Business.net panel, you can also view online users, registered users, new daily users, and billing of the project in time thanks to their rates or service fees, which depend on the volumes of the transactions. IN CONCLUSION, this project is the reference for recycling and use of materials among companies, reducing the amount of materials that will never be used again, reducing the waste produced every year by small, medium and large industries, to national and international level. This opens up new markets and business options for companies that take advantage of materials that other businesses do not need, and for very little money, while maintaining an attractive profit margin.. 54.
Figure


+6


Documento similar
The expansionary monetary policy measures have had a negative impact on net interest margins both via the reduction in interest rates and –less powerfully- the flattening of the
Jointly estimate this entry game with several outcome equations (fees/rates, credit limits) for bank accounts, credit cards and lines of credit. Use simulation methods to
In our sample, 2890 deals were issued by less reputable underwriters (i.e. a weighted syndication underwriting reputation share below the share of the 7 th largest underwriter
First, to measure the presence of politics in Spanish TV news programmes; second, to determine how the image of politics is built in these programmes; and third, to define
Nevertheless, the ratio of corporations using patents of introduction is higher than that obtained from the analysis of the entire patent system as a whole (around 8.5% from 1820
Comparing Spanish and Japanese against the English language we found that both languages have fewer vowel and consonant sounds than in English. In the case of
These data clearly reveal a complex structure for Spanish CP both in root and embedded clauses: They involve sentences with more than one instance of a complementizer heading
languages of study: Spanish, Catalan and English as a foreign language. Learners’
