British Journal of Nutrition
http://journals.cambridge.org/BJNAdditional services for
British Journal of Nutrition:
Email alerts: Click here Subscriptions: Click here Commercial reprints: Click here Terms of use : Click here
Decreased levels of uric acid after oral glucose challenge is associated
with triacylglycerol levels and degree of insulin resistance
F. J. Tinahones, F. Cardona, G. RojoMartínez, M. C. Almaraz, I. Cardona, J. VázquezMellado, L. GarridoSánchez, E. Collantes and F. Soriguer
British Journal of Nutrition / Volume 99 / Issue 01 / January 2008, pp 44 48 DOI: 10.1017/S0007114507787470, Published online: 29 August 2007
Link to this article: http://journals.cambridge.org/abstract_S0007114507787470
How to cite this article:
F. J. Tinahones, F. Cardona, G. RojoMartínez, M. C. Almaraz, I. Cardona, J. VázquezMellado, L. GarridoSánchez, E. Collantes and F. Soriguer (2008). Decreased levels of uric acid after oral glucose challenge is associated with triacylglycerol levels and degree of insulin resistance. British Journal of Nutrition, 99, pp 4448 doi:10.1017/S0007114507787470
Request Permissions : Click here
Decreased levels of uric acid after oral glucose challenge is associated with
triacylglycerol levels and degree of insulin resistance
F. J. Tinahones
1*, F. Cardona
1, G. Rojo-Martı´nez
2, M. C. Almaraz
3, I. Cardona
2, J. Va´zquez-Mellado
4,
L. Garrido-Sa´nchez
2, E. Collantes
5and F. Soriguer
31Servicio de Endocrinologı´a y Nutricio´n, Hospital Clı´nico Universitario Virgen de la Victoria, Ma´laga and CIBER Fisiopatologı´a
de la obesidad y nutricio´n CB06/03 Instituto de Salud Carlos III, Ma´laga, Spain
2Fundacio´n IMABIS (Instituto Mediterra´neo para el Avance de la Biotecnologı´a y la Investigacio´n Sanitaria), Ma´laga, Spain 3Servicio de Endocrinologı´a y Nutricio´n, Hospital Regional Universitario Carlos Haya, Ma´laga, Spain
4Hospital General Ciudad de Me´xico, Me´xico DF 5
Servicio de Reumatologı´a, Hospital Universitario Reina Sofı´a de Co´rdoba, Spain
(Received 29 March 2007 – Revised 29 May 2007 – Accepted 31 May 2007)
Hyperuricaemia is one of the components of metabolic syndrome. Both oxidative stress and hyperinsulinism are important variables in the genesis of this syndrome and have a close association with uric acid (UA). We evaluated the effect of an oral glucose challenge on UA concentrations. The study included 656 persons aged 18 to 65 years. Glycaemia, insulin, UA and plasma proteins were measured at baseline and 120 min after an oral glucose tolerance test (OGTT). The baseline sample also included measurements of total cholesterol, triacylglycerol (TAG) and HDL-choles-terol. Insulin resistance was calculated with the homeostasis model assessment. UA levels were significantly lower after the OGTT (281·93 (SD 92·19)v. 267·48 (SD90·40)mmol/l;P,0·0001). Subjects with a drop in UA concentrations.40·86mmol/l (.75th percentile) had higher plasma TAG levels (P¼0·0001), baseline insulin (P¼0·02) and greater insulin resistance (P¼0·034). Women with a difference in plasma concentrations of UA above the 75th percentile had higher baseline insulin levels (P¼0·019), concentration of plasma TAG (P¼0·0001) and a greater insulin resistance index (P¼0·029), whereas the only significant difference in men was the level of TAG. Multiple regression analysis showed that the basal TAG levels, insulin at 120 min, glycaemia at 120 min and waist:hip ratio significantly predicted the variance in the UA difference (r20·077). Levels of UA were significantly lower after the OGTT and the individuals with the greatest decrease in UA levels are those who have greater insulin resistance and higher TAG levels.
Uric acid: Insulin resistance: OGTT: Triacylglycerol
The metabolic syndrome is tightly associated with hyperuri-caemia1 – 3. TAG levels are directly associated with uric acid levels and these associations seem to be also related to several genetic polymorphisms4 – 7. We have also reported that hyper-uricaemic-hypertriacylglycerolaemic patients have high levels of VLDL components and a reduced fractionated excretion of uric acid7.
The association between serum uric acid and the metabolic syndrome seems to be related to insulin resistance. Insulin acts in the proximal tubules and interferes with excretion of Na and uric acid under physiological states. Hyperinsulinaemia has been associated with decreased urate and Na excretion and thus with hypertension and hyperuricaemia. It seems that higher insulin resistance is also associated with higher serum uric acid levels, although most studies reporting this associ-ation were done in healthy subjects and under fasting or baseline conditions8,9.
Oxidative stress has recently been shown to play an import-ant role in the genesis of the metabolic syndrome10. The metabolization of purins has a paradoxical effect on
oxidative stress. On the one hand, the action of xanthine oxidase on xanthine produces uric acid and superoxide radicals that are derived from reactive oxygen species11, and on the other hand is the antioxidant effect of uric acid itself. This paradox has resulted in some studies showing that the administration of allopurinol, which is hypouricaemic, reduces reactive oxygen species12, whilst others show that the rise in uric acid concentrations increases the antioxidant capacity of plasma13,14.
An oral glucose tolerance test (OGTT) causes an increase in insulin levels and oxidative stress, both in persons with dia-betes and in healthy persons15,16. Recent studies have shown that hyperglycaemia induces an overproduction of superoxide by the mitochondrial electron-transport chain17. Superoxide overproduction is accompanied by increased NO generation, due to endothelial NO synthase and inducible NO synthase uncoupled state, a phenomenon favouring the formation of the strong oxidant peroxynitrite. Additionally, during an oral glucose challenge, a reduction in the antioxidant defences is observed18 – 21.
*Corresponding author:Francisco Jose´ Tinahones, faxþ34 952 286704, email fjtinahones@terra.es
Abbreviations:HOMA, homeostasis model assessment; OGTT, oral glucose tolerance test.
qThe Authors 2008
British
Journal
of
Considering that uric acid may play a role in oxidative stress and that it has a direct relation with insulin levels, and aware that an oral glucose challenge increases oxidative stress and insulin levels, we sought to determine whether an OGTT was able to modify plasma levels of uric acid. Further-more, we attempted to determine the possible association between this hypothetical change in uric acid levels and the levels of TAG, which is the variable in the metabolic syn-drome that is most closely related with hyperuricaemia.
Subjects and methods
A total of 656 persons aged 18 – 65 years, selected randomly from the municipal census, were included in the present study. The general characteristics of the study have been reported elsewhere22. Pregnant women, hospitalized patients or those who lived in health institutions, as well as those with severe psychological disorders, were excluded. The sub-jects were requested by mail to attend their local health centre for a medical examination. Those who failed to attend their first appointment were sent a second letter giving them another appointment and all those still not attending were visited at home in order to ascertain the reason. The final sample distri-bution by age and sex was not significantly different from the population distribution23.
Procedures
All subjects were interviewed and given a standardized clini-cal examination based on standard procedures performed by the same researchers. The clinical data included weight, height, BMI (weight (kg)/height (m)2), hip circumference, abdominal circumference and waist:hip ratio, all measured as usual. An OGTT was given to all the participants. Blood samples were taken from all the subjects at baseline and 120 min after the OGTT. The plasma was separated and frozen at2708C for later analysis.
Glycaemia, uric acid and plasma proteins were measured at baseline and 120 min after the OGTT (Dimension autoanalyzer; Dade Behring Inc., Deerfield, IL, USA). Measurements were also made in the baseline sample of total cholesterol, TAG and HDL-cholesterol by enzymatic methods in an autoanalyzer (Dimension; Dade Behring Inc.). Baseline insulin levels were measured by RIA administered by BioSource S.A. (Biosource Europe SA, Nivelles, Belgium) and insulin resistance was calculated from the homeostasis model assessment (HOMA) with the formula: insulin resistance ¼ [fasting serum insulin (mU/ml) £ fasting blood glucose (mmol/l)]/22·524 and HOMA-IS¼(fasting insulin (mU/ml)£20)/(fasting glucose (mmol/l)23.5).
Statistical analysis
The data are presented as means and standard deviations. The 75th percentile (dP75) of the frequency distribution of the difference between uric acid at baseline and after the OGTT was used as the cut-off point for changes in the levels of uric acid during the OGTT. The percentiles for the uric acid difference were: 25 – 18·230; 50 8·862; 75 40·874mmol/l.
Means contrast was done with the Studentttest and bivariate correlations by calculating the linear correlation coefficient (Pearson r). The contribution of different variables to the variance
in uric acid level change between baseline and 120 min was calculated by multiple regression models. In all cases the rejection level for a null hypothesis was set ata¼0·05. The statistical anal-ysis was done with SPSS 12.0 for Windows (SPSS Inc., Chicago, IL, USA). The study was approved by the Ethics and Clinical Investigation Committee of Carlos Haya Hospital.
Results
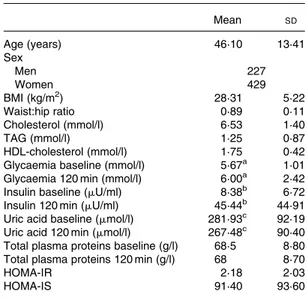
Table 1 shows the age, sex and the baseline and 120-min values for uric acid, total proteins, glucose and insulin, as well as the TAG level, BMI, waist:hip ratio, Homeostasis model assessment-insulin resistance (IR), HOMA-insulin secretion (IS), HDL-cholesterol and LDL-cholesterol in the study population. The levels of uric acid were signifi-cantly lower after the OGTT (281·93 (SD 92·19) v. 267·48 (SD 90·40)mmol/l;P,0·0001).
The subjects with the greatest differences between uric acid values at baseline and after 120 min (dP75) also had the highest levels of TAG (P,0·001), baseline insulinaemia (P,0·02), HOMA-IS (P,0·023) and HOMA-IR (P,0·034). Women with a difference in plasma uric acid levels above the 75th per-centile had higher baseline insulin levels (P¼0·019), higher con-centrations of plasma TAG (P¼0·0001) and a greater insulin resistance index (P¼0·029), whereas the men only had a signifi-cant difference in TAG levels (Table 2).
The baseline uric acid level correlated negatively with HDL-cholesterol and positively with HDL-cholesterol, TAG, age, BMI, baseline and 120-min insulinaemia and glycaemia, HOMA-IR and HOMA-IS. The difference in the uric acid levels between baseline and 120 min after the OGTT was significantly associ-ated with plasma TAG, cholesterol and glycaemia at 120 min (r 0·23, P,0·001, r 0·10, P¼0·006, r 0·092 and P¼0·022, respectively) (Table 3). Separate correlation analyses according to sex showed no differences (data not shown).
Table 1.Biological characteristics of the study population*
(Mean values and standard deviations)
Mean SD
Age (years) 46·10 13·41
Sex
Men 227
Women 429
BMI (kg/m2) 28·31 5·22
Waist:hip ratio 0·89 0·11
Cholesterol (mmol/l) 6·53 1·40
TAG (mmol/l) 1·25 0·87
HDL-cholesterol (mmol/l) 1·75 0·42 Glycaemia baseline (mmol/l) 5·67a 1·01 Glycaemia 120 min (mmol/l) 6·00a 2·42
Insulin baseline (mU/ml) 8·38b 6·72
Insulin 120 min (mU/ml) 45·44b 44·91
Uric acid baseline (mmol/l) 281·93c 92·19
Uric acid 120 min (mmol/l) 267·48c 90·40 Total plasma proteins baseline (g/l) 68·5 8·80 Total plasma proteins 120 min (g/l) 68 8·70
HOMA-IR 2·18 2·03
HOMA-IS 91·40 93·60
* For details of subjects and procedures, see Materials and methods.
a,b,cMean values were significantly different between before and after
oral glucose tolerance test (P,0·0001).
IR, homeostasis model assessment insulin resistance; HOMA-IS, homeostasis model assessment insulin secretion.
Uric acid and insulin resistance 45
British
Journal
of
Table 2. Distribution of the biological variables studied according to the 75th percentile (dP75) of the difference in plasma uric acid levels before and after oral glucose tolerance test and grouped according to sex (Studentttest)*
(Mean values and standard deviations)
All Men (n227) Women (n429)
,dP75 (n492) .dP75 (n164) ,dP75 (n156) .dP75 (n71) ,dP75 (n336) .dP75 (n93)
Mean SD Mean SD Mean SD Mean SD Mean SD Mean SD
Age (years) 45·82 13·6 46·9 12·6 46·68 13·96 48·90 12·14 45·54 13·57 45·58 12·93
Sex
Men 156 71 – – – –
Women 336 93 – – – –
TAG (mmol/l) 1·17a 0·73 1·53a 1·14 1·44e 0·84 1·87e 1·48 1·04f 0·64 1·27f 0·71
HDL-cholesterol (mmol/l) 1·76 0·42 1·73 0·43 1·65 0·35 1·70 0·34 1·80 0·44 1·76 0·49
LDL-cholesterol (mmol/l) 4·17 1·14 4·16 1·14 4·24 1·29 4·19 1·39 4·15 1·07 4·15 0·99
BMI (kg/m2) 28·3 5·20 28·24 5·068 28·41 4·12 28·3 4·021 28·26 5·579 28·19 5·68
Waist:hip ratio 0·88 0·107 0·89 0·10 0·97 0·073 0·97 0·06 0·84 0·09 0·84 0·08
Insulin baseline (mU/ml) 8·10b 5·6 9·55b 9·8 8·8 5·90 9·2 6·78 7·7g 5·4 9·8g 11·7
Systolic BP (mg Hg) 131·47 64·9 134·52 74·10 137·58 18·80 138·36 20·30 128·14 56·60 134·71 94·70
Diastolic BP (mg Hg) 81·90 65·80 84·7 76·10 83·86 11·28 84·3 11·60 79·32 56·2 86·7 98·00
HOMA-IS 1·2c 3·10 1·99c 5·0 1·39 3·10 1·66 3·60 1·12h 3·20 2·2h 5·90
HOMA-IR 2·12d 1·60 2·53d 2·99 2·45 1·80 2·5 2·0 1·9i 1·50 2·54i 3·50
* For details of subjects and procedures, see Materials and methods.
P,0·05 significant differences:a,e,fP,0·0001;b,g,hP¼0·02;c,d,iP,0·05. No significant differences were detected according to sex.
HOMA, homeostasis model assessment; IR insulin resistance; IS insulin secretion; BP blood pressure.
Table 3. Correlation analysis of the biological variables studied (Pearson r)†
HOMA-IS HOMA-IR insulin 120 insulin bas Gly bas Gly 1200 Uric acid TG Chol HDL-chol W-H BMI Age
HOMA IR 0·710*
Insulin 120 0·463* 0.565*
Insulin bas 0·935* 0·902* 0·525*
Gly bas 0·015 0·588* 0·300* 0·287*
Gly 120’ 0·224* 0·334* 0·584* 0·292* 0·342*
U´ ric acid 0·208* 0·233* 0·225* 0·252* 0·194* 0·193*
TG 0·184* 0·304* 0·316* 0·272* 0·307* 0·267* 0·420*
Chol 20·010 0·051 0·139* 0·033 0·120* 0·111* 0·161* 0·314*
HDL col. 20·109* 20·067* 0·0001 20·097* 20·006 0·009 20·089* 20·050 0·359*
W-H 0·317* 0·409* 0·337* 0·399* 0·340* 0·285* 0·377* 0·297* 0·253* 20·046
BMI 0·393* 0·401* 0·370* 0·436* 0·274* 0·269* 0·320* 0·213* 0·167* 20·087* 0·526*
Age 0·159* 0·290* 0·292* 0·249* 0·331* 0·288* 0·180* 0·161* 0·285* 0·030 0·604* 0·378*
dUA 0·032 0·057 20·044 0·049 0·047 0·092* 0·444* 0·232* 0·108* 20·007 0·045 0·024 0·055
Statistical significance: *P,0·05. No significant differences were detected according to sex. † For details of subjects and procedures, see Materials and methods.
dUA, difference uric acid; Chol, cholesterol; insulin bas, insulin baseline; HOMA, homeostasis model assessment; IR, insulin resistance; IS, insulin secretion; W-H, waist:hip ratio; Gly bas, glycaemia basal; Gly 120, glycaemia 120.
F.
J.
Tinahones
et
al.
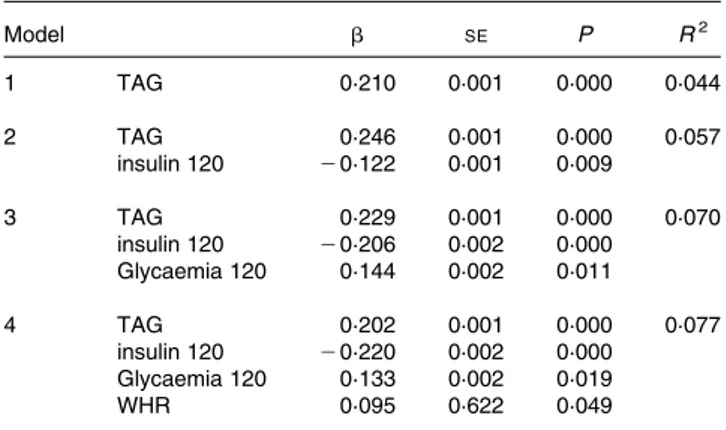
Multiple regression analysis with the difference in the uric acid levels between baseline and 120 min after the OGTT as the depen-dent variable showed that the TAG levels, insulin 120 min, glycaemia 120 min and waist:hip ratio significantly predicted the variance in the uric acid difference (r2 0·077) (Table 4). The following variables failed to enter the model: baseline insulin; baseline and 120-min glycaemia; HDL-cholesterol; cholesterol; HOMA-IS; HOMA-IR. Separate analysis showed no difference according to sex.
Discussion
The main finding in the present study was that uric acid levels drop after a glucose challenge and this change is dependent on TAG levels and insulin resistance. The reasons for this reduction may include reduced synthesis of uric acid after a glucose challenge; increasing renal excretion of urates, although this is physiologically unlikely as uric acid excretion in 2 h is not enough to produce a drop in plasma levels of uric acid; a reduction due to the effect of dilution in serum after the glucose challenge, which again is unlikely as no change was seen in levels of total plasma proteins. A final possibility is that this reduction is due to the consumption of uric acid as it carries out its antioxidant function. In line with our hypoth-esis, the latter option is most likely. The reduction in uric acid levels after an OGTT with 75 g glucose may have an import-ant biological meaning, since it highlights the role of uric acid as an antioxidant in plasma in a situation that increases oxi-dative stress, as is a glucose challenge.
An increase in oxidative stress occurs after an OGTT in per-sons with and without diabetes15,16. Several studies in patients with type 2 diabetes have reported the generation of oxidative stress during the postprandial period. These observations suggest that control of glucose excursions, and accompanying oxidative stress, during the postprandial period may be important in the prevention of potential long-term diabetes complications16,25,26. This increase potentially influences the
urate levels by two different mechanisms: 1) the reduction of the plasma level of uric acid after a glucose challenge is due to the consumption of uric acid after its sudden participation in antioxidant reactions. Allantoin is formed from the non-enzy-matic oxidation of urate and it is a marker of the antioxidant effect of uric acid27. Thus, the reduction in plasma levels of uric acid may be at the expense of increased levels of allantoin, after carrying out its antioxidant function; 2) experimental and clinical studies have shown that uric acid levels rise in response to chronic oxidative stress28,29.
The drop in plasma levels of uric acid may be due to less synthesis, as a result of the inhibition of xanthine oxidase by the high degree of postprandial oxidative stress as a conse-quence of high levels of free radicals30,31. We therefore propose a hypothesis according to which situations of acute stress produce a small decrease in the levels of uric acid, due to the consumption of uric acid as it carries out its antiox-idant function and conversely that chronic stress would induce a permanent increase in uric acid levels.
The association between hyperuricaemia and hypertriacyl-glycerolaemia has been known for some time. Two different phenotypes exist, pure hyperuricaemic persons and persons with both hyperuricaemia and hypertriacylglycerolaemia32. Fox et al. found that environmental factors such as diet were responsible for this association of hypertriacylglycero-laemia and hyperuricaemia33. Furthermore, our group has detected this association of hypertriacylglycerolaemia and hyperuricaemia even in the absence of these environmental factors34and evidence exists for genetic associations between these two metabolic disorders and several genes4 – 6. The results of the present study show that the decrease in uric acid levels after a glucose challenge is closely associated with baseline TAG levels and with variables associated with insulin resistance in the general population and support the association between hypertriacylglycerolaemia and hyperuri-caemia found previously7. A possible explanation for this is that persons with hypertriacylglycerolaemia and insulin resist-ance have greater oxidative stress, with the consequent greater consumption of uric acid. Hypertriacylglycerolaemia produces a rise in oxidative stress via an increase in free radicals, par-ticularly in superoxide anions proceeding from the increased proton gradient in the mitochondria as a result of excess acetyl CoA after b-oxidation of NEFA derived from the TAG; an increase that is reverted with antioxidants35,36.
In conclusion, this study showed that in a situation that increases oxidative stress, as is an OGTT, there is an acute drop in levels of uric acid and that those persons who experi-ence the greatest reduction have greater insulin resistance and higher TAG levels. Whether this reduction in uric acid con-centration is associated with the antioxidant effect of uric acid remains to be shown.
Acknowledgements
The authors wish to thank all the subjects for their collabor-ation and IMABIS. We also gratefully acknowledge the help of Ian Johnstone for his expertise in preparing this manuscript. This study was undertaken with finance from the Fondo de Investigacio´n Sanitaria ‘Centros de Investigacio´n En Red’ (CIBER, CB06/03/0018) of the ‘Instituto de Salud Carlos III’, SAF 2006/12 894 of the MCYT and FIS 05/1307 of the
Table 4.Multiple regression analysis*
Model b SE P R2
1 TAG 0·210 0·001 0·000 0·044
2 TAG 0·246 0·001 0·000 0·057
insulin 120 20·122 0·001 0·009
3 TAG 0·229 0·001 0·000 0·070
insulin 120 20·206 0·002 0·000 Glycaemia 120 0·144 0·002 0·011
4 TAG 0·202 0·001 0·000 0·077
insulin 120 20·220 0·002 0·000 Glycaemia 120 0·133 0·002 0·019
WHR 0·095 0·622 0·049
* For details of subjects and procedures, see Materials and methods.
Dependent variable: difference uric acid (dUA); independent variables: cholesterol, uric acid, age, BMI, LDL-cholesterol, homeostasis model assessment insulin resistance (HOMA-IR), homeostasis model assessment insulin secretion (HOMA-IS), insulin, insulin 120 min, glucose, glucose 120 min.
Statistical significance:P,0·05.
Variables not entering the model: baseline insulin, baseline glycaemia, HDL-choles-terol, cholesHDL-choles-terol, BMI, age, HOMA-IS and HOMA-IR. No significant differences were detected according to sex.
WHR, waist:hip ratio.
Uric acid and insulin resistance 47
British
Journal
of
‘Instituto de Salud Carlos III’, Madrid, Spain. The investi-gation group belongs to the ‘Red de Diabetes y Metabolismo’ (RD06/0015/0008) of the Instituto de Salud Carlos III.
References
1. Zavaroni I, Mazza S, Fantuzzi M, Dall’Aglio E, Bonora E, Del-signore R, Passeri M & Reaven GM (1993) Changes in insulin and lipid metabolism in males with asymptomatic hyperuricae-mia.J Intern Med234, 25 – 30.
2. Rathman W, Funkhouser E, Dyer AR & Roseman JM (1998) Relations of hyperuricemia with the various components of the insulin resistance syndrome in young black and white adults: The Cardia Study.Ann Epidemiol8, 250 – 261. 3. Culleton BF, Larson MG, Kannel WB & Levy D (1999) Serum
uric acid and risk for cardiovascular disease and death: the Fra-mingham Heart Study.Ann Intern Med131, 7 – 13.
4. Cardona F, Tinahones FJ, Collantes E, Escudero A, Garcia-Fuentes E & Soriguer FJ (2005) Contribution of polymorphisms in the apolipoprotein AI- CIII-AIV cluster to hyperlipidaemia in patients with gout.Ann Rheum Dis64, 85 – 88.
5. Cardona F, Tinahones FJ, Collantes E, Escudero A, Garcia-Fuentes E & Soriguer FJ (2003) The elevated prevalence of apo-lipoprotein E2 in patients with gout is associated with reduced renal excretion of urates.Rheumatology(Oxford)42, 468 – 472. 6. Cardona F, Tinahones FJ, Collantes E, Garcia-Fuentes E, Escu-dero A & Soriguer F (2005) Response to a urate-lowering diet according to polymorphisms in the apolipoprotein AI-CIII-AIV cluster.J Rheumatol32, 903 – 905.
7. Tinahones JF, Pe´rez-Lindon G, C-Soriguer FJ, Pareja A, Sa´n-chez-Guijo P & Collantes E (1997) Dietary alterations in plasma very low density lipoprotein levels modify renal excretion of urates in hyperuricemic-hypertriglyceridemic patients.J Clin Endocrinol Metab82, 1188 – 1191.
8. Facchini F, Chen YD, Hollenbeck CB & Reaven GM (1991) Relationship between resistance to insulin-mediated glucose uptake, urinary uric acid clearance, and plasma uric acid con-centration.JAMA266, 3008 – 3011.
9. Quinones Galvan A, Natali A, Baldi S, Frascerra S, Sanna G, Ciociaro D & Ferrannini E (1995) Effect of insulin on uric acid excretion in humans.Am J Physiol268, E1 – E5. 10. Cardona F & Tinahones FJ (2006) The missing link in the
meta-bolic syndrome: Postprandial hyperlipidemia and oxidative stress.Endocrinologı´a53, 345 – 352.
11. Berry CE & Hare JM (2004) Xanthine oxidoreductase and cardiovascular disease: molecular mechanisms and pathophysio-logical implications.J Physiol16, 589 – 606.
12. Farquharson CA, Butler R, Hill A, Belch JJ & Struthers AD (2002) Allopurinol improves endothelial dysfunction in chronic heart failure.Circulation106, 221 – 226.
13. Waring WS, Webb DJ & Maxwell SR (2001) Systemic uric acid administration increases serum antioxidant capacity in healthy volunteers.J Cardiovasc Pharmacol38, 365 – 371.
14. Waring WS, Convery A, Mishra V, Shenkin A, Webb DJ & Maxwell SR (2003) Uric acid reduces exercise-induced oxidative stress in healthy adults.Clin Sci(Lond)105, 425 – 430. 15. Ceriello A (1997) Acute hyperglycaemia and oxidative stress
generation.Diabet Med14, S45 – S49.
16. Ceriello A, Bortolotti N, Motz E, Crescentini A, Lizzio S, Russo A, Tonutti L & Taboga C (1998) Meal-generated oxidative stress in type 2 diabetic patients.Diabetes Care21, 1529 – 1533. 17. Brownlee M (2001) Biochemistry and molecular cell biology of
diabetic complications.Nature414, 813 – 820.
18. Ceriello A, Bortolotti N, Crescentini A, Motz E, Lizzio S, Russo A, Ezsol Z, Tonutti L & Taboga C (1998) Antioxidant defenses are
reduced during oral glucose tolerance test in normal and non-insulin dependent diabetic subjects.Eur J Clin Invest28, 329–333. 19. Tessier D, Khalil A & Fulop T (1999) Effects of an oral glucose
challenge on free radicals/antioxidants balance in an older popu-lation with type II diabetes.J Gerontol54, 541 – 545. 20. Konukoglu D, Hatemi H, Ozer EM, Gonen S & Akcay T (1997)
The erythrocyte glutathione levels during oral glucose tolerance test.J Endocrinol Invest20, 471 – 475.
21. Zou MH, Shi C & Cohen RA (2002) Oxidation of the zinc-thio-late complex and uncoupling of endothelial nitric oxide synthase by peroxynitrite.J Clin Invest109, 817 – 826.
22. Rojo-Martinez G, Esteva I, Ruiz de Adana MS, Garcia-Almeida JM, Tinahones F, Cardona F, Morcillo S, Garcia-Escobar E, Garcia-Fuentes E & Soriguer F (2006) Dietary fatty acids and insulin secretion: a population-based study. Eur J Clin Nutr
60, 1195 – 1200.
23. Andalusian Statistics Institute (1996) Municipal information system of Andalusia. Seville: Andalusian Parliament.
24. Matthews DR, Hosker JP, Rudenski AS, Naylor BA, Treacher DF & Turner RC (1985) Homeostasis model assessment: insulin resistance and beta-cell function from fasting plasma glucose and insulin concentrations in man.Diabetologia28, 412 – 419. 25. Ceriello A, Bortolotti N, Motz E, Pieri C, Marra M, Tonutti L,
Lizzio S, Feletto F, Catone B & Taboga C (1999) Meal-induced oxidative stress and low-density lipoprotein oxidation in diabetes: the possible role of hyperglycemia.Metabolism48, 1503 – 1508. 26. Ceriello A (2003) The possible role of postprandial
hyperglycaemia in the pathogenesis of diabetic complications.
Diabetologia46, M9 – M16.
27. Benzie IF, Chung W & Tomlinson B (1999) Simultaneous measurement of allantoin and urate in plasma: analytical evalu-ation and potential clinical applicevalu-ation in oxidant:antioxidant balance studies.Clin Chem45, 901 – 904.
28. Ozguner F, Armagan A, Koyu A, Caliskan S & Koylu H (2005) A novel antioxidant agent caffeic acid phenethyl ester prevents shock wave-induced renal tubular oxidative stress.Urol Res33, 239 – 243.
29. Elmas O, Aslan M, Caglar S, Derin N, Agar A, Aliciguzel Y & Yargicoglu P (2005) The prooxidant effect of sodium metabisul-fite in rat liver and kidney.Regul Toxicol Pharmacol42, 77 – 82. 30. McNally JS, Saxena A, Cai H, Dikalov S & Harrison DG (2005) Regulation of xanthine oxidoreductase protein expression by hydrogen peroxide and calcium. Arterioscler Thromb Vasc Biol25, 1623 – 1628.
31. Mueller CF, Laude K, McNally JS & Harrison DG (2005) ATVB in focus: redox mechanisms in blood vessels. Arterios-cler Thromb Vasc Biol25, 274 – 278.
32. Collantes E, Tinahones FJ, Cisnal A, Anon J & Sanchez-Guijo P (1994) Variability of lipid phenotypes in hyperuricaemic-hyper-lipidemic patients.Clin Rheumatol13, 244 – 247.
33. Fox IH, John D, DeBruyne S, Dwosh I & Marliss EB (1985) Hyperuricemia and hypertriglyceridemia: Metabolic basis for the association.Metabolism34, 741 – 746.
34. Collantes Estevez E, Pineda Priego M, Anon Barbudo J & Sanchez Guijo P (1990) Hyperuricemia-Hyperlipemia associ-ation in the absence of obesity and alcohol abuse.Clin Rheuma-tol9, 28 – 31.
35. Ceriello A, Assaloni R, Da Ros R, Maier A, Piconi L, Quagliaro L, Esposito K & Giugliano D (2005) Effect of atorvastatin and irbesartan, alone and in combination, on postprandial endo-thelial dysfunction, oxidative stress, and inflammation in type 2 diabetic patients.Circulation111, 2518 – 2524.
36. Ceriello A & Motz E (2004) Is oxidative stress the pathogenic mechanism underlying insulin resistance, diabetes, and cardio-vascular disease? The common soil hypothesis revisited. Arter-ioscler Thromb Vasc Biol24, 816 – 823.