ContentslistsavailableatSciVerseScienceDirect
Ecological
Indicators
jo u rn a l h o m e pa g e :w w w . e l s e v i e r . c o m / l o c a t e / e c o l i n d
Surveillance
of
habitats
and
plant
diversity
indicators
across
a
regional
gradient
in
the
Iberian
Peninsula
M.
Ortega
a,∗,
C.
Guerra
b,c,
J.P.
Honrado
d,
M.J.
Metzger
e,
R.G.H.
Bunce
f,g,
R.H.G.
Jongman
gaDepartmentofEcology,FacultaddeCienciasBiológicas,UniversidadComplutensedeMadrid,JoséAntonioNovaisn◦2,CiudadUniversitaria,28040Madrid,Spain
bInstitutoPolitécnicodeVianadoCastelo–EscolaSuperiorAgrária,4990-706PontedeLima,Portugal cInstituteofMediterraneanAgriculturalandEnvironmentalSciences,CampusdaMitra,Évora,Portugal
dCIBIO-CentrodeInvestigac¸ãoemBiodiversidadeeRecursosGenéticos&FaculdadedeCiências,UniversidadedoPorto,RuadoCampoAlegre,s/n,4169-007Porto,Portugal eCentrefortheStudyofEnvironmentalChangeandSustainability(CECS),SchoolofGeosciences,UniversityofEdinburgh,DrummondStreet,EdinburghEH89XP,UnitedKingdom fEstonianUniversityofLifeSciences,51014,Estonia
gAlterra,WageningenUR,P.O.Box47,6700AA,Wageningen,TheNetherlands
a
r
t
i
c
l
e
i
n
f
o
Articlehistory:
Received28September2012 Accepted3December2012
Keywords: Fieldsurvey Monitoring Observationnetworks Samplingefficiency Speciesandhabitatindicators
a
b
s
t
r
a
c
t
LocatedinthewestoftheMediterraneanandwithhighenvironmentalheterogeneity,theIberian Penin-sularepresentsachallengingregionfordesigningandimplementingobservationsystemsforlandscape, habitatandspeciesdiversityindicators.WithintheframeworkofaprojectdesignedtosetupaEuropean BiodiversityObservationNetwork(EBONE),astandardizedprotocolforfieldsurveywasusedinpilot siteslocatedacrossamajorgradientinPortugalandSpain.Resultsarepresentedandcomparedtoassess theefficiencyofthemethodindetectingpatternsalongthisgradient.Thesesitesrepresentdifferent typesofIberianlandscapesselectedusingastratifiedrandomprocedureimplementedintheMadrid province(Spain)andinthenorthofPortugal.Speciesandhabitatrichnessanddiversity(aswellastheir components)arecomparedintheirrelationtoenvironmentalgradientsandsurveyarea.Resultsfrom spatialanalysesoflandscapeheterogeneityarealsopresentedanddiscussedinrelationtoappropriate indicators.Theimplicationsforsettingupcost-efficientobservationschemesthatcapturethekey indi-catorseffectivelyarediscussed.Perspectivesforintegrationwithcomplementarymonitoringschemes targetedatkeyspecies,habitatandlandscapeindicatorsarealsodiscussedinordertooptimizethepower andefficiencyoftheseobservationnetworks.
© 2012 Elsevier Ltd. All rights reserved.
1. Introduction
Inaneraofglobalenvironmentalchange,theneedfor accu-rateestimatesofbiodiversitylossaroundtheworldhasbecome acoreobjectiveinordertomeettheinternationalconservation goalsfor2020(EuropeanCommission,2011).Previousestimates totacklethe2010targetshavebeenbasedonlocalmeasuresand ontheuseoftheStreamliningEuropeanBiodiversityIndicators (SEBI).Howeveralackofharmonizationhasbeennotedinthe sur-veysbehindseveralestimates(Bunceetal.,2008;Lengyeletal., 2008;Schmeller,2008).Therefore,sofaronlypartialestimateshave beenobtainedwhichsuggestthatrapidbiodiversitylossisactually
∗Correspondingauthor.Tel.:+34913944421;fax:+34913945081.
E-mailaddresses:[email protected](M.Ortega),[email protected] (C.Guerra),[email protected](J.P.Honrado),[email protected]
(M.J.Metzger),[email protected](R.G.H.Bunce),[email protected] (R.H.G.Jongman).
ongoing,buttheextentofthedeclineisunknown(Scholesetal., 2008;Butchartetal.,2010;Pereiraetal.,2010).
Designing thescientific and institutional framework as well asthetoolstosupportsuchglobalassessmentis atthecoreof several initiativesat global and sub-global level e.g. GEO BON, Intergovernmental Science-Policy Platform on Biodiversity and EcosystemServices(IPBES) ortheEuropeanUnion(EU) funded European Biodiversity Network (EBONE) project (Halada et al., 2009;LarigauderieandMooney,2010;GEOBON,2011).The objec-tiveof thelatteris theprovisionofa sound scientificbasis for theproductionofstatisticalestimatesofstockandchangeofkey indicatorsthatcanthenbeinterpretedbypolicymakers respon-dingtoEUDirectivesregardingthreatenedecosystemsandspecies (Metzgeretal.,2010).Themainoutputwasthedevelopmentof asystemforestimatingpastchangebutalsoforforecastingand testingpolicyoptionsandsupportingthedesignofmitigating man-agementstrategiesforthreatenedecosystemsandspecies.Inthis context EBONEhasdeveloped a Europeansystemforrecording habitatsandassociateddatasuitableforinsiturecording(Bunce etal.,2011)whichalsoallowsexchangeandintegrationbetween
existingnationalprojects.Theprotocolincludesthewholeland surfaceandisexchangeablewiththeFAO(FoodandAgriculture Organization)LandCoverClassificationSystem(DiGregorioand Jansen,2000).
Amongtherelevant achievements fromEBONE hasbeenan evaluation of the Environmental Stratification of Europe (EnS; Metzgeretal.,2005)asamethodforselectionofstratifiedsamples, throughastatisticalcomparisonwithnationalenvironmental clas-sificationssuchastheGreatBritainCountrysideSurvey(Firbank etal.,2003;SheailandBunce,2003),theSwedishNational Inven-toryofLandscapes(Esseenetal., 2006), theAustrianSurvey of AgriculturalLandscapes(Wrbkaetal.,1999)andtheSpanish Sur-veyofHabitats(Elena-Rossellóetal.,1997,2005).Ingeneral,the EnSwasfoundtobecomparablewithregionalstratificationsand toresolve bordereffects wheredivergentenvironmental condi-tionsarecombinedintodominantstrata(Ortegaetal.,2012).The test ofa Europe-widesamplingstrategy basedon theEnS and ofasurveyprotocolforhabitatsandspeciesbasedonlifeforms andgeneralhabitatcategories(GHCs)hasbeenachievedinEBONE (Bunce etal.,2008; Hazeuet al.,2011).Thisprotocolhasbeen testedinthefieldincontrastingenvironments,fromborealconifer foreststohotdeserts,butaformaltestonitseffectivenessinthe assessmentofspeciesandhabitatdiversitypatternsacrossamajor environmentalgradienthasnotyetbeencarriedout.Inaddition,its effectivenessinrecordingrelevantindicatorshasnotbeen deter-mined.
TheIberian Peninsulais animportant reservoir ofEuropean biodiversity (Morillo and Gomez-Campo, 2000), and is usually includedinthe“MediterraneanRegion”hotspotofglobal biodi-versity(Myersetal.,2000).However,thepeninsulaalsopresents challengesforsetting upanecologicalmonitoringprogram due to its high environmental and social-ecological heterogeneity (Rey-Benayas and Scheiner, 2002;Rescia etal., 2008).Previous assessment and monitoringprogrammes in Spain and Portugal have ranged from national forest inventories and land cover mappingtolandscapeinventoriesfrombothstructural(e.g. Elena-Rosselló et al., 1997, 2005 in Spain; and Caetano et al., 2008, inPortugal)andfunctional(e.g.Alcaraz-Seguraetal.,2009) per-spectives.However,due totheirspecificgoalstheseapproaches havenotbeenabletoidentifyhabitatandbiodiversityindicators withtheenoughdetail to supportregionalmanagement needs whilst meeting the requirements of national and international reporting,e.g.ontheapplicationoftheEUHabitatsDirectiveand theimplementationoftheNatura 2000network (Evans, 2006). Thereis thereforearequirementtotesta commonIberian sys-temforhabitatandbiodiversitymonitoringthatcancontributeto cross-bordermanagementandpolicy,aswellastointernational goals.
Thispaperthereforepresentsanddiscussesresultsofapilot surveyofhabitatsandbiodiversityacrossamajorenvironmental gradientintheIberianPeninsula,includingtestsitesinSpainand Portugal.Thepilotinvolvedtheselectionandsurveyof10siteswith landscapemosaicsintworegionsofthepeninsulawithcontrasting climates,vegetation,landusesandlandscapestructure.Dataon habitatandplantdiversitydatafromthose10sitewereusedto addressthefollowingthreeobjectives:(i)toassessthe effective-nessoftheEBONEprotocolinidentifyingindicatorsofhabitatsand plantbiodiversityatthelandscapescale;(ii)totestpossibleeffects ofsurveyareaontheeffectivenessoftheprotocol,andtodiscuss implicationsforimprovingtheefficiencyoftheapproach;and(iii) todescribeandanalysehabitatandbiodiversityindicatorsacrossa majorenvironmentalandsocial-ecologicalgradientintheIberian Peninsula(Metzgeretal.,2005,2010).Finally,guidelinesare pro-posedforthedesignandimplementationofanIberianmonitoring programforhabitatsandbiodiversity,asaregionalcontributionto apan-Europeanobservationnetwork.
2. Methods
2.1. Testregionsandsites
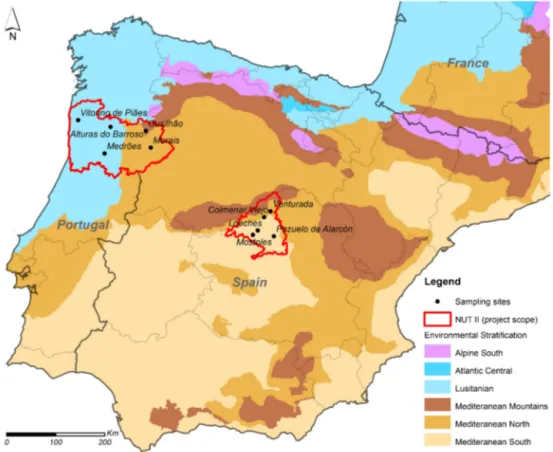
Thesamplingstrategyandfieldmethodologyforsurveillance ofhabitatsandplantspeciesrichnessusedwasdescribedbyBunce etal.(2008,2011).Themethodwastestedin10sitesacrossamajor environmentalgradientintheIberianPeninsula,fiveofwhichwere locatedinSpainandtheremainingfiveinPortugal.Thesesiteswere selectedwithintwocontrastingtestregions:theMadridprovince (NUTScodeES30)and theNorth ofPortugal(NUTScodePT11). Insideeachofthesetworegions,fiveINSPIRE1km2gridcellswere
selectedunderastratifiedrandomsamplingdesignbasedonthe EnS(Metzgeretal.,2005).Theunderlyingenvironmentalgradient discriminatingthesetof10sitesisrelatedtodecreasing tempera-turesandcontinentalinfluenceonthegradientfromthesouthern Mediterraneantowardsthenorthernandmountainous Mediter-raneanareasandfurtherintotheAtlantic(“Lusitanian”)zonein thenorth-westofthePeninsula(Fig.1).Thisclimaticgradienthas beensummarizedinthesystemusedforstratifyingtheallocation ofsamples(Metzgeretal.,2005).
TheEnSidentifiesrelativelyhomogeneousregionsin Europe suitable for strategic random sampling of ecological resources (Metzgeretal.,2010).Itprovidesagenericclassificationthatcan beadaptedforaspecificobjective,whilstprovidingsuitablezones for environmental reporting (Hazeu et al., 2011).The EnS was createdusingtried-and-testedstatisticalclusteringprocedureson 20primaryphysicalenvironmentalvariables.Thesewere(1) cli-matevariablesfromtheClimaticResearchUnit(CRU)TS1.2dataset (Mitchell etal.,2004);(2)elevationdatafromtheUnitedStates GeologicalSurveyHYDRO1kdigitalterrainmodel;and(3) indi-catorsforoceanicityandnorthing.Principalcomponentsanalysis (PCA) was used to compress 88% of the variation of these 20 environmentalcharacteristicsintothreedimensions,whichwere subsequently clustered using theIterative Self-Organizing Data Analysis(ISODATA)clusteringroutine.Thescoresofeachgridcell alongthesethreePCAdimensionsthereforerepresentkey envi-ronmentalfeaturesinrelationtothemaingradientsacrossEurope (temperatureforPCA1,oceanicityforPCA2,andprecipitationfor PCA3;Metzgeretal.,2005).Theclassificationprocedurehasbeen describedindetailbyMetzgeretal.(2005).
TheEnScomprises84strata,aggregatedinto13environmental zones(EnZs)withadataresolutionof1km2.TheIberian
Penin-sula has six EnZs and four are included in the test areas. The SpanishtestregionwasintheMadridprovincewithanareaof 8.021km2.Fivesiteswererandomlyselectedwithinstrata,using
anarea-proportionalallocation,threeinthenumber1stratumof theMediterraneanSouthzone(MDS1)andtwointhenumber6 stratumoftheMediterraneanNorthzone(MDN6)oftheEnS.In Portugal,thetestregionwasinthenorthofthecountrywithanarea of21,278km2.Fivesiteswerealsoselectedrandomlywithinstrata,
inthesamearea-proportionalway,twointhenumber4stratum oftheLusitanianzone(LUS4),oneinthenumber1stratumofthe samezone(LUS1),oneinthenumber5stratumofthe Mediter-raneanMountainszone(MDM5),andfinallyoneinthenumber3 stratumoftheMediterraneanNorthzone(MDN3).Thedistribution ofthesitesinthesestrataandEnZsisshowninFig.1.Thissampling designtriestosimulateabasicnetworkNomenclatureofTerritorial UnitsforStatistics(NUTS)areathatcouldbeproposedtoinclude inapan-Europeanbiodiversityobservationnetwork.
NearMadrid,thegentlerelieftogetherwiththedry Mediter-ranean climate has produced a dominance of extensive land useswithlowspatialheterogeneityandcoarse-grainedlandscape mosaics.Therefore,inthefiveSpanishsites1km2gridcells(from
Fig.1.RepresentationoftheselectedsamplingsiteswithintheclimaticgradientoftheEnvironmentalStratificationofEuropeaggregatedbyenvironmentalzones(Metzger etal.,2005).ThingreylinesindicateNUTS-IIregionsintheIberianPeninsula.ThicklinesindicatestudyregionsinnorthernPortugalandcentralSpain.(Forinterpretationof thereferencestocolorinthisfigurelegend,thereaderisreferredtothewebversionofthearticle.)
Conversely,intheNorthofPortugal,thecomplexphysiographyand terrain,withahumidAtlanticclimate,togetherwithalonghistory ofintensivelanduse,hasledtofine-grainedlandscapes.Forthe fivePortuguesesitesasurveyareaof0.25km2wasthereforeused
(basedona0.5km×0.5kmgridcellresultingfroma disaggrega-tionoftheINSPIRE1km2gridcells).Thiscellsizefollowsprevious
examplesundercomparableconditionselsewhere(Cooperetal., 2009;Rogersetal.,2012).Thisapproachallowedthefieldsurvey beadaptedtothefeaturesofthetestlandscapeswhilstprovidingan opportunitytoaddressthepossibleconsequencesofthisprocedure ontheoveralleffectivenessofthemethod.
2.2. Fieldsurveysforhabitatsandplantdiversity
Ineachsite,allGHCswererecordedandmapped,including lin-earfeatures,followingtheEBONEprotocolasdescribedinBunce etal.(2011).ThebasisfortheGHCtypologyistheclassical classi-ficationofplantlifeformsdevisedbyRaunkiaerintheearly20th century.Theselifeforms(fromannualsandherbaceous perenni-als,totallshrubsandtrees)transcendthedescriptionofspecies. Theyarebasedonthescientifichypothesisthathabitatstructureis relatedtotheenvironment.Thesystemdefines160general habi-tatcategories(GHCs),asdescribedbyBunceetal.(2011).Variation withinagivenGHCisthenexpressedbyenvironmentalandglobal qualifiers,whicharecombinationsofsoilhumidity,nutrient sta-tus,acidityandotherhabitatcharacteristics.Importantadditional informationisgivenbyaddingcodesfrompredefinedlistsof quali-fiersdescribinghumanmanagementandothersitefeatures.Finally fulllistsofGHCsineachunitareadded,togetherwithinformation ondominantspecies.Inthisparticularstudy,thesevariationsare expressedasdiversityof“habitattypes”.
Vegetation plots to estimate plant diversity in GHCs were selectedrandomlywithineachGHC,followingthreecriteria:(i)one
vegetationplotperGHCorlinearelementcategoryandper envi-ronmentalqualifierordominantspecies;(ii)novegetationplotsin urban,waterbodiestoodeeptosampleordangerousterrain;(iii) ifthereweremorethanoneelementofacertainGHC,thanselect randomlyoneofthemandselectalsorandomlythelocationofthe plotinsidetheGHCavoidingedgeeffectwithabufferofatleast 3m(Bunceet al.,2011).Thesizeand shapeofvegetationplots areshowninTable1.Vascularplantswereusedasafocalgroup sincetheyareconsideredassuitableindicatorsofbiodiversityand arerelativelyrapidtosurveyandidentify.Also,asprimary pro-ducerstheyplayacriticalroleinsupplyingecosystemgoodsand services,andarethesinglemostimportantgroupoforganismsin shapinghabitatsforotherspecies(Lughadhaetal.,2005;Pereira andCooper,2006).Fieldworkforhabitatrecordingandvegetation plotsextendedfortwoorthreevisitspersitedependingonthe spatialheterogeneityandspeciesdiversity.
2.3. Dataanalysis
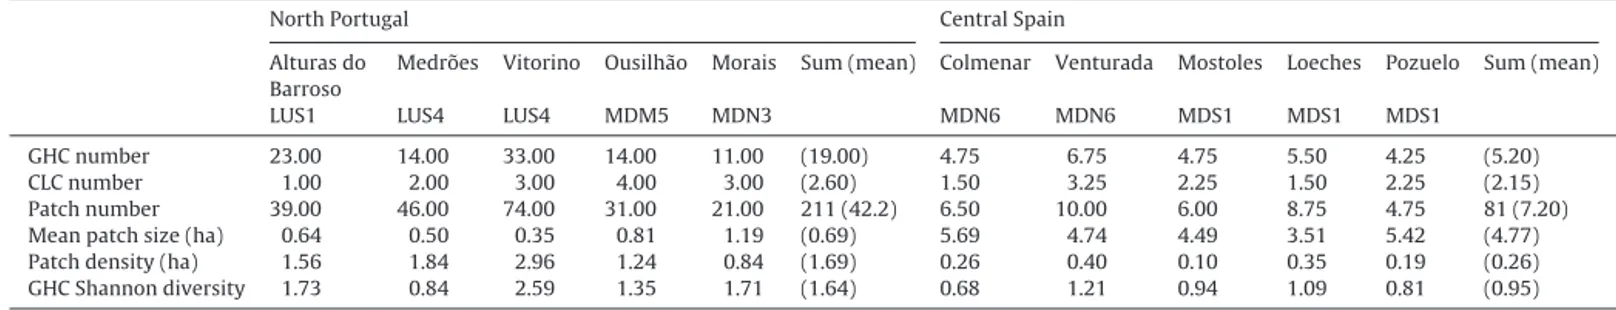
Withthecollecteddata,threetypeofanalysiswerecarriedout. First, forthelandscapespatialanalysis,landscapemetrics were calculatedtosummarizespatialpatternsofhabitatsandmain land-scapetraitsofeachsurveyedgridcell.ThenumberofGHCs,number ofpatches,meanpatchsize,patchdensityandGHCShannon diver-sitywere calculatedat landscapelevel. Together,thesemetrics coverseveralkeyfeaturesoflandscapeheterogeneity,from com-positiontoconfiguration.Inordertocomparelandscapemetrics across sites, each Spanish site was divided into four zones of 0.25km2.ThenumberofCorineLandCoverMaplevel3classes
Table1
Vegetationplotscharacteristics(adaptedfromBunceetal.,2011).
Code Name Where Size No.persite
X Arealplots Centroidatrandompointsinpolygons 10m×10m Variable
L Linearsplots Centroidatrandomalonglinearfeatures 10m×1m Variable
Plantspeciesrichnessanalyseswerealsoperformed,usingall vegetationplotscollectedduringthesurveytotestfordifferences intherelativesizeofbiodiversitypools(andtheiradditivealpha andbetacomponents)foreachsiteandenvironmentalstrataas wellas toassess therelative effectiveness of theimplemented samplingstrategies.Thisanalysiswasaimedtoaddressthe pos-sibleareaeffectsontheeffectivenessofthefieldprotocol.Finally, anEnS-basedevaluationwasdonebyplottingandcomparingthe contrastsbetweensitesinthedifferentenvironmentalstrata.
Theeffectivenessofthefieldsurveystocapturethepatterns of species diversity was assessed through randomized species accumulationcurves, orsample-based rarefactioncurves inthe terminologyofGotelliandColwell(2001),usingEstimateSv8.2.0 (Colwell,2009).Thesecurvesarecalculatedwith95%confidence intervals,usingthemathematicalapproachproposedbyColwell etal.(2004),andtheirasymptoticshapeisconsideredindicative of survey effectiveness (Magurran, 2004). Specifically,thetotal numberofspecieswasusedineach ofthepooledsamplesasa preferentialestimatortoestablishthecomparisonsbetweensites. Asrichnessestimationoption,EstimateScomputestheasymptotic function most commonly used, theMichaelis–Menten function (Colwell and Coddington, 1994)and Bootstrap incidence-based estimatorofspeciesrichness(SmithandvanBelle,1984)between others.Inthisworktheseestimatorswereusedbecausethey rep-resentedthemaximum andtheminimumpredictionof species richness.Theyarethereforeindicativeofeffectiveness,evenifthey arebasedinpredictionsofspeciesnotpresentinanysample.
3. Results
3.1. Habitatpatternsacrosstestregionsandenvironmentalstrata
ThemeannumberofGHCspersitewassignificantlyhigherin thePortuguesesitesthanintheSpanishsites(Mann–WhitneyU test=2.61,p<0.01;Table2).ThePortuguesesitesshowahigher spatial heterogeneity and complexity, expressed as higher val-ues for GHC Shannon diversity (Mann–Whitney U test=1.98, p<0.05),highernumberofpatches(Mann–WhitneyUtest=2.61, p<0.01), higher patch density (Mann–Whitney U test=2.61, p<0.01)andconsequentlylowermeanpatchsize(Mann–Whitney Utest=−2.61,p<0.01).
Whencomparingtheresultsattheenvironmentalstratumlevel, dissimilaritiesbetweenstratawerealsofound,althoughalarger numberofsamplingsiteswouldbeneededtoobtainastronger statisticalrepresentation.Thesurveyedsitesshowedthatthe Lusi-tanianstratawerecharacterizedbyatendencytohavealarger numberofGHCsandahigherspatialheterogeneityand complex-ity,with more patches and a small mean patchsize (Table2). Fromalandscapeperspective,thisindicatesagradientof complex-ityfromstratawithcomplex,fine-grainedmosaics(Lusitanian)to morehomogeneouslandscapes(MediterraneanSouth)withlarger patchesandfewerGHCs.
ThenumberoflandcoverclassesdetectedfromtheCorineLand Cover(CLC)2006datasetforthesamesiteswas,asexpected, signif-icantlylowerinthetworegionsthanthenumberofGHCsbecause themaphasaminimummappableareaof25haaswellasfewer classes(Wilcoxonmatchedpairs test=2.80,p<0.01)andin this casenodifferenceswerefoundbetweenregions(Mann–Whitney Utest=0.52,p=0.60;Table2).
3.2. EffectivenessoftheEBONEfieldprotocolinthetestregions andstrata
Intotal,262specieswererecordedinthefiveSpanishsites(from 33plots),comparedwith284speciesrecordedinthePortuguese sites(from47plots),withatotalof470speciesrecordedinthe 80plotsfromall10sites(Fig.2(a)).Thecomparisonofthespecies accumulationcurvesforthefivesitesintheMadridprovincewith thevalues of two estimators (Bootstrap and Michaelis–Menten richnessestimatedfor33plotswere300and352species, respec-tively) suggest that the surveys captured plant diversity with effectivenessbetween87%(usingBootstrapestimation)and74% (usingMichaelis–Mentenestimation). ForPortuguese sites, sur-vey effectiveness rangedbetween 82% and 59% (Bootstrap and Michaelis–Mentenrichnessestimatedfor47plotswere345and 481species,respectively).A visualcomparisonof species accu-mulationcurvesbetweenSpanishandPortuguesesitesrevealed amoreasymptoticshapeofSpanishcurvescomparedwiththeir Portuguesecounterparts,highlightingthehigherheterogeneityof thelatterlandscapes.
Thecomparisonofspecies accumulationcurves per environ-mentalstratumindicatedthatthetwoLusitanianstratashowed atendencytoaccumulatespeciesslowerthantheMediterranean strata(Fig.2(b))aconsequenceofthehighermeanspecies rich-nessofMediterraneanplots(seebelow).Themeaneffectiveness ofsurveyperstratuminMadridwas85.5±0.5%and64.5±4.5%, andinPortugalitwasof81±2%and47±10%(usingBootstrapand Michaelis–Mentenestimation,respectively).
3.3. Plantdiversitypatternsacrosstheregionalenvironmental gradient
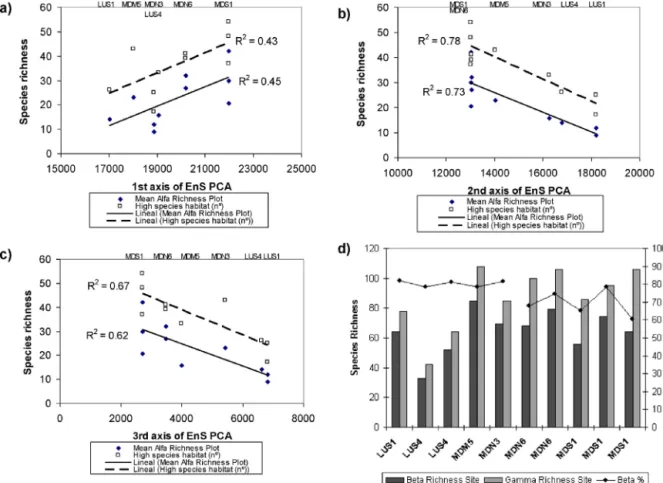
AlphaspeciesrichnessperplotandspeciesrichnessoftheGHC hostingthehighestnumberofspeciespersiteexhibited signifi-cantcorrelationswiththethreefirstaxesofthePCAoftheEnS strata(Fig.3(a)–(c);seeSection2.1).Thefirstaxisreflectsa tem-peraturegradientandwaspositivelycorrelatedwithbothvariables (R2=0.45,F=6.62,p<0.05andR2=0.43,F=5.91,p<0.05),
there-foreincreasingtemperaturestendtopromotespeciesrichnessper plot.Thesecondand thirdaxes,thatreflectoceanicity and pre-cipitationgradientsrespectively,werenegativelycorrelatedwith both species richness variables (R2=0.73, F=21.14,p<0.01 and
R2=0.78,F=28.28,p<0.001forsecondaxisandR2=0.62,F=12.83,
p<0.01andR2=0.67, F=16.13p<0.01forthird axis),indicating
thatseasonalbufferingbyproximitytotheoceanandincreaseof precipitationarerelatedtolowerplantspeciesrichnessattheplot level.
Whilstthepatternofgammarichnesspersitecouldbe influ-encedbythedifferentsizesofsampleunits(0.25km2inPortugal,
against1km2inMadrid),thesamedoesnotapplytoalpharichness,
Table2
NumberofGHCs,numberofCorineLandCover2006(CLC)level3classes,numberofpatches,meanpatchsize,patchdensityandGHCShannondiversityforthe10surveyed sites.The10sitesareidentifiedbytheirenvironmentalstratumoftheEnS(Metzgeretal.,2005).Inordertocomparelandscapemetricsacrosssites,theSpanishsites weredividedintofoursquaresof0.25km2,andmeansareshownforeachsite.LUS,Lusitanianzone;MDM,MediterraneanMountains;MDN,MediterraneanNorth;MDS, MediterraneanSouth.
NorthPortugal CentralSpain
Alturasdo Barroso
Medrões Vitorino Ousilhão Morais Sum(mean) Colmenar Venturada Mostoles Loeches Pozuelo Sum(mean)
LUS1 LUS4 LUS4 MDM5 MDN3 MDN6 MDN6 MDS1 MDS1 MDS1
GHCnumber 23.00 14.00 33.00 14.00 11.00 (19.00) 4.75 6.75 4.75 5.50 4.25 (5.20)
CLCnumber 1.00 2.00 3.00 4.00 3.00 (2.60) 1.50 3.25 2.25 1.50 2.25 (2.15)
Patchnumber 39.00 46.00 74.00 31.00 21.00 211(42.2) 6.50 10.00 6.00 8.75 4.75 81(7.20)
Meanpatchsize(ha) 0.64 0.50 0.35 0.81 1.19 (0.69) 5.69 4.74 4.49 3.51 5.42 (4.77)
Patchdensity(ha) 1.56 1.84 2.96 1.24 0.84 (1.69) 0.26 0.40 0.10 0.35 0.19 (0.26)
GHCShannondiversity 1.73 0.84 2.59 1.35 1.71 (1.64) 0.68 1.21 0.94 1.09 0.81 (0.95)
0 50 100 150 200 250 300 350 400 450 500
1 5 9 13 17 21 25 29 33 37 41 45
Plots
Sp
ec
ies
ri
chne
ss
Central Spain North Portugal
Michaelis-Menten Central Spain Michaelis-Menten North Portugal Bootstrap Central Spain Bootstrap North Portugal
a)
b)
0 50 100 150 200 250
1 5 9 13 17 21
Plots
Sp
ec
ies
ri
chne
ss
MDS1 MDN6 MDM5 MDN3 LUS4 LUS1
Fig.2.Randomizedaccumulationcurvesforplantspeciesrichnessinthesetof10sites.(a)NumberofspeciesasafunctionofthenumberofplotsforSpanishandPortuguese regions;a95%confidenceintervalisindicatedineachcurve;maximumrichnessestimatedwithBootstrapandMichaelis–Mentenwas300and352species,respectively,for CentralSpain,and345and481species,respectively,forNorthernPortugal.(b)Numberofspeciesasafunctionofthenumberofplotsperenvironmentalstratum.
FocusingonthemostspeciesrichGHCineachsite,therewasa tendencyforspeciesrichnesstoexhibitvariationsalongthesame environmentalgradients(Fig.3(a)–(c)).However,notalwaysthe GHCwiththemostspecieswastheoneoccupyingalargerarea inthecorrespondingsite(Table3).IntheSpanishsites,themost speciesrichGHC(54speciesin10m2)wasalinearplotoftallscrub
dominatedbyQuercusilex.Thishabitatwasintheedgesof foot-pathsthatcrossa similarGHCbutwithsomedifferencesinits life-formcomposition.ThelatterGHCwastheonecoveringthe largestareainthatsite(“Pozuelo”;Table3),whichislocatedinthe
MDS1environmentalstratum,thedriestofall10sites,onasandy soil and with somecattle grazing but almostsemi-abandoned. Amongareal plots(100m2), theGHChostingthehighest
num-berofplantspecieswasascrubpatchcomposedofevergreentall shrubs,locatedalsointheMDS1environmentalstratum.Inmore humidenvironments,suchasthosepresentintheMDN6stratum, the mostspecies rich GHCwas similarbut contained 20% less speciesthaninMDS1.InPortugal,thenumberofspeciespresentin themostdiverseGHCwassmallerthaninSpain(Mann–Whitney Utest=1.98,p<0.05)(Table3).Overall,theGHCwiththemost
Table3
RelationsbetweenGHCsandplantspeciesrichnessforthe10surveyedsites:GHCoccupyingmostarea,GHChostingmostplantspecies,andspeciesrichnessofthelatter. The10sitesareidentifiedbytheirenvironmentalstratumoftheEnS(Metzgeretal.,2005).LUS,LusitanianZone;MDM,MediterraneanMountains;MDN,Mediterranean North;MDS,MediterraneanSouth.CHE/LHE,CaespitoseHemicryptophytes/LeafyHemicryptophytes;CRO,herbaceouscrop;FPH/EVR,ForestPhanerophytesEvergreen;STR, herbaceousstrip;LSC,lineofscrub;LTR,lineoftrees;MPH/EVR,MidPhanerophytesEvergreen;TPH/EVR,TallPhanerophytesEvergreen;THE,Therophytes;WOC,woody crop.
NorthPortugal CentralSpain
Alturasdo Barroso
Medrões Vitorino Ousilhão Morais Mean Colmenar Venturada Mostoles Loeches Pozuelo Mean
LUS1 LUS4 LUS4 MDM5 MDN3 MDN6 MDN6 MDS1 MDS1 MDS1
GHCoccupyingmostarea CHE/LHE WOC/SPA CRO CHE/LHE FPH/EVR THE FPH/EVR CRO CRO MPH/EVR
GHChostingmostplantspecies LTR WOC/CHE HST WOC THE TPH/EVR FPH/EVR MPH/EVR MPH/EVR LSC SpeciesrichnessoftheGHC
hostingmostspecies
26 17 25 43 33 26.6 41 39 48 37 54 43.8
Meanalphaspeciesrichnessplot 14 9 12 23 16 32 27 30 21 42
Linealplotsnumber 3 1 3 2 1 2 2 3 3 1
Fig.3.Patternsandenvironmentalcorrelationsofplantspeciesrichnesscomponentsinthe10surveyedsites.(a–c)Variationofmeanalpharichnessperplotandofspecies richnessofthemostdiversehabitatagainstthefirst(a),second(b)andthird(c)axesoftheEnSPCA.(d)Total(gamma)speciesrichnessanditsbetaadditivecomponent (absoluteandrelativevalues)persite.The10sitesareidentifiedbytheirenvironmentalstratumoftheEnS(Metzgeretal.,2005).LUS,LusitanianZone;MDM,Mediterranean Mountains;MDN,MediterraneanNorth;MDS,MediterraneanSouth.
specieswas anold chestnut(Castaneasativa) grove(actually a woodycropinGHCterms),with43speciesin100m2(Table3),
recordedinthe“Ousilhão”site(MDM5stratum).Linearelements suchasherbaceousstripsandlinesoftreeswerealsoamongthe GHCshostingthemostspeciespersite(Table3).
4. Discussion
4.1. EffectivenessoftheEBONEprotocolinthesurveyofhabitats, speciesandindicatorsoflandscapeheterogeneity
Designing observation networks for the assessment of land cover,habitatsandbiodiversitygloballywillrequiretheanalysisof theperformanceofsuchnetworksattheirseveralhierarchical lev-elsandoftheirresponsestochangesofscale(Manderetal.,2003). Overall,themethodusedinthisstudy(Bunceetal.,2008,2011)was foundtobesuccessfulinthesurveyofindicatorsrelatedtohabitats andplantspeciesrichnessinlandscapemosaicsdifferingin compo-sitionandspatialheterogeneity(cf.Table2).Themethodwasable tocapturethehighheterogeneityofspeciescompositionacross habitattypesthat characterizesIberian rurallandscapes(Rescia etal.,2008).Furthermore,themethodwaseffectiveincapturing therichnessofplantspeciespresentinthesamplesasderivedfrom accumulationcurves(cf.Fig.2).Finally,thehigherspeciesrichness thatcharacterizesMediterraneanhabitatsandlandscapes(Myers etal.,2000)wasalsoconfirmed,evenalthoughtheAtlanticsites usuallycontainedmoreGHCsandhabitattypes(cf.Tables2and3 andFig.2).
Comparableresults have beenobtained in theGreat Britain CountrysideSurveysincethe1970s(Firbank etal.,2003;Sheail
andBunce,2003).However,furtherdatafromotherregionsare requiredtoconfirmtheseconclusionsandtoconverttheminto policyrecommendations.Althoughwithdifferentsamplingareas, resultingfromanadaptationtolocalconditionsandcostefficiency, theresultsindicatethatinMediterraneanandLusitanian environ-mentsthesamehabitatmappingprotocolandvegetationsampling designworkswithcomparableeffectivenessintheestimationof biodiversityindicators.Themoremoderateasymptoticshapeof accumulationcurves forPortuguese test sites(see Fig.2)likely resultsfromtheirhigherdispersionacrossenvironmentalzones andstrata(seeSection2.1;Metzgeretal.,2005).Overall,theresults thereforeindicatethattheEBONEmethodology,supportedbya statisticallyrobustenvironmentalstratificationandsuitable sta-tisticalanalysis,canabsorbdifferencesinsamplingareaswithout significantlossesofeffectivenessandwithgainsofcost-efficiency. The landscape mosaics described in the field methodology beingtestedwereingeneralagreementwiththeprevious knowl-edge of each site, with thecharacteristic landscape features of each environmentalstratum reflecting interactions with social-ecologicalfactorsandtheunderlyingclimaticgradient(seeSection 2.1;Rey-Benayasand Scheiner,2002;Metzgeretal.,2010).The Portuguesesiteswereconfirmedasfine-grain(“small-scale”) land-scapes (Lomba et al., 2010, 2012), with mean patch size well belowone hectare(cf.Table 2)andwitha dominanceofcrops and grasslands, with various proportions of forest. The Span-ishsiteswerealsoconfirmedas coarse-grainmosaics(“mid-to large-scalelandscapes”),withmeanpatchsizeoverfivehectares andwithadominanceofextensivelandusee.g.annualpasture and woody crops together with open woodlands of evergreen
area was nearly three times higher in Portugal than in Spain. However,theCorineLandcoverClassificationwasnotableto cap-turethedifferences betweenIberian regions (cf.Table2), once again highlighting the effectiveness of the methodology being tested.
4.2. Improvedefficiencyofsurveillanceandmonitoringandarea effects
The key resultsdiscussed in theprevious section yield two mainimplications.First,theLusitaniansitesoftheNorthernIberian Peninsulaowetheirhighspeciesdiversitytothehighspatial het-erogeneity,expressedinhighdiversityofhabitattypesandinthe highlevelsofinter-habitatdifferencesinspeciescomposition(i.e. thebetaadditivecomponentofspeciesrichness).Conversely,the Mediterraneansitessupporthighspeciesrichnessmostlydueto highvalues of species richness per habitat type (i.e. the alpha additivecomponentofspeciesrichness;cf.Fig.3).IntheIberian Peninsula,highspeciesandlandusediversityhavebeen associ-atedwithforestcovermeasuredatcoarsescale(50km×50km) byLoboetal.(2001).Oceanicityandotherclimaticvariableshave alsobeenrelatedtospeciesrichnessinthesamesensebythese authors.Rey-BenayasandScheiner,2002havealsorelatedlocal andregionalpatternsofplantspeciesrichnesstoenvironmental gradientsandheterogeneityatseveralscalesintheIberian Penin-sula.
Althoughsurveyingmoresiteswouldbenecessarytoconfirm theresults,thepresent datasuggestthat highspecies diversity isassociatedwiththeextentofforestcoverand environmental gradientsatfinerscales.Forestareasoftencontainmorediverse assemblagesofspecies(Margalef,1974;ScheinerandRey-Benayas, 1994),butedgesareoftenasimportant.TheEBONEprotocol(Bunce etal., 2008,2011)recognizesarealand linear featuresof land-scapes asstructural elementsofhighimportancefor landscape functionality.Insomeofthesites,linearelementscontainedmore plantspeciesthanthenopenlandscape(Table3).Thefunctional importanceof linearfeatures ascorridorsfor individuals, seeds andgenesiswellknown(SaundersandHobbs,1991),andasis theirimportanceforbiodiversityinMediterraneanareas(García DelBarrioetal.,2006).Inotherenvironments,linearfeaturessuch ashedgerowssharemanyspecieswiththenearbywoodland habi-tats(McCollinetal.,2000)andalsocontain“weedyplants”that invade theneighbouring woods(Honnayet al.,2002).Riparian zonesarealsoknownfortheirrichnessandfortheinvasive capac-ityoftheirspecies(Planty-Tabacchietal.,1996).Inaddition,many oftheinteractionsbetweenthevariouscommunitiesofthe land-scapearereflectedinthecontactzonesbetweenthem.Themost dynamic zonefor “speciesflow”isreportedtobewhere linear elementsproviderefuges for plantspecies ofenclosed habitats (FaganandCosner,1999).InmanynorthernEuropeanagricultural landscapes,fieldmarginscomprisethemajorityofsemi-natural habitats(MarshallandMoonen,2002).Inareasofintensivefarming themajorityofnativespeciesarefoundinsmallwoodlandpatches (Dumortieretal.,2002;Lombaetal.,2010,2011)andinhedgerows aroundfields(Wagneretal.,2000).
The secondmajor implication of the resultsrelatesto cost-efficiencyofhabitatandbiodiversitymonitoringinthecontextofan IberiancontributionforEuropeanorglobalobservationnetworks. Inthecoarse-grainlandscapesofMediterraneanSpain,asin south-ernEnglandandelsewhere,ecologicalheterogeneityisexpressed atmediumtolargespatialscales.1km2surveyareasaretherefore
needed,asdiscussedinFirbanketal.(2003),tocapture ecolog-icalheterogeneityandbiologicaldiversity.Fortheselandscapes, the1km2 sampleareaproposedbytheEBONEmethodhasbeen
tested acrossEuropeand elsewhere (Bunce et al.,2011). How-ever,insmall-scalelandscapesoftheLusitanianzoneandmany
mountainfarmlandareas,thespatialheterogeneityofabiotic con-ditions,habitattypesand speciesdiversityis expressedatfiner scalesandacrosssmallerspatialunits(e.g.Lombaetal.,2012).The resultsfromthePortuguesesitesprovideevidencethatundersuch conditions0.25km2areasaresuitabletoobtainrobustestimatesof
ecologicaldiversity.Smallersampleunitsreducesurveyeffortand contributetohighercost-efficiencybyincreasingthetotalnumber ofsamplesandthefrequencyofcampaigns.
4.3. Perspectivesforamulti-purposeIberianbiodiversity observationnetwork
Besidesservingnationalandregionalmanagementneeds,the designofanIberianBiodiversityObservationNetwork(BON)based on the EBONEframework could have positive implications for reportingoninternationalindicatorsandontheimplementation ofconservationpolicy.TheIberianBONshouldbeimplementedin thecontextofthe“RegionalBONs”proposedintheGEOBON strate-gicimplementationplan(GEOBON,2010)andwouldrepresentan importantcontributionfromIberiancountriestosupportthe repor-tingoninternationalindicatorse.g.thoseestablishedinthecontext oftheConventiononBiologicalDiversity(CBD;MaceandBaillie, 2007)andthoseproposedforreportingintheEuropeancontext (SEBI;EEA,2007).Anotherkeycontributionwouldbeforreporting ontheimplementationoftheEUHabitatsandBirdsDirectivesin SpainandPortugal,evenifcomplementarysurveyswouldhaveto beconductedtocapturerarespeciesandhabitattypes.Thedatato becollectedwouldalsoboostimportantresearchonbiodiversity responsestomultipleenvironmentalpressuresanddrivers,from climatechangeandinvasiveexoticspecies(e.g.Vicenteetal.,2011) tolandusechangeorenvironmentalpolicy,byprovidingfielddata formodelcalibrationandscenarioanalysis(e.g.Pereiraetal.,2010; Lombaetal.,2012).
Inthiscontext,notonlyabiodiversityandhabitatsmonitoring networkwillbenefitfromtheimplementedstandardized proto-col,butalsoothernationallyand/orregionally basedsurveys.A structuredsamplingprogramasdescribedabovecouldprovidethe necessaryinformationonindicatorsrelatedtohabitatsandspecies whichcouldleadtothedevelopmentofpoliciesforconservation, butitcouldalsoprovidedatavaluableforassessingthenational implementationofEuropeanDirectives,e.g.theWaterFramework Directive,orfor integrationwithdatafromagro-environmental surveys, e.g. the Land Use/Cover Area frame statistical Survey (LUCAS)andrelatedsetsofindicators(e.g.IRENA;EEA,2005)
The implementation of an Iberian BON could also benefit from comparable initiatives by being able to integrate results fromothersurveysrelatedtoenvironmentalassessment.Suchan integrated developmentframeworkwould necessarily leadtoa standardizationofcollectionproceduresandopenopportunities forcost-efficiencyandintegratedenvironmentalanalysis.Although there aresome importantchallenges toconsider (data integra-tion, different reference systems, different representations and semantics,differentontologies,etc.;e.g.Henryetal.,2008),this integrationof systems andthe harmonizationofprocesses and toolscouldrepresenta landmarkforenvironmentalmonitoring effortsinthePeninsulaandelsewhere.
Acknowledgements
References
Alcaraz-Segura,D.,Cabello,J.,Paruelo,J.M.,Delibes,M.,2009.Useofdescriptorsof ecosystemfunctioningformonitoringanationalparknetwork:aremotesensing approach.Environ.Manage.43,38–48.
Bunce,R.G.H.,Metzger,M.J.,Jongman,R.H.G.,Brandt,J.,Elena-Rossello,R.,Groom, G.B.,Halada,L.,Hofer,G.,Howard,D.C.,Kovár,P.,Mücher,C.A.,Padoa-Schioppa, E.,Paelinx,D.,Palo,A.,Pérez-Soba,M.,Ramos,I.L.,Roche,P.,Skånes,H.,Wrbka, T.,2008.AstandardizedprocedureforsurveillanceandmonitoringEuropean habitatsandprovisionofspatialdata.LandscapeEcol.23(1),11–25. Bunce,R.G.H.,Bogers,M.M.B.,Roche,P.,Walczak,M.,Geijzendorffer,I.R.,Jongman,
R.H.G.,2011.ManualforHabitatandVegetationSurveillanceandMonitoring, Temperate,MediterraneanandDesertBiomes.AlterraReport2154. Wagenin-genUR,TheNetherlands.
Butchart,S.H.M.,Walpole,M.,Collen,B.,vanStrien,A.,Scharlemann,J.P.W.,Almond, R.E.A.,Baillie,J.E.M.,Bomhard,B.,Brown,C.,Bruno,J.,Carpenter,K.E.,Carr,G.M., Chanson,J.,Chenery,A.M.,Csirke,J.,Davidson,N.C.,Dentener,F.,Foster,M.,Galli, A.,Galloway,J.N.,Genovesi,P.,Gregory,R.D.,Hockings,M.,Kapos,V.,Lamarque, J.F.,Leverington,F.,Loh,J.,McGeoch,M.A.,McRae,L.,Minasyan,A.,Morcillo,M.H., Oldfield,T.E.E.,Pauly,D.,Quader,S.,Revenga,C.,Sauer,J.R.,Skolnik,B.,Spear, D.,Stanwell-Smith,D.,Stuart,S.N.,Symes,A.,Tierney,M.,Tyrrell,T.D.,Vié,J.C., Watson,R.,2010.Globalbiodiversity:indicatorsofrecentdecline.Science328, 1164–1168.
Caetano,M.,Pereira,M.,Carrão,H.,Araújo,A.,Nunes,A.,Nunes,V.,2008.Cartografia temáticadeocupac¸ão/usodosolodoInstitutoGeográficoPortuguês.Mapp.Rev. Int.Cienc.Tierra126,78–87.
Colwell,R.K.,Coddington,J.A.,1994.Estimatingterrestrialbiodiversitythrough extrapolation.Philos.Trans.R.Soc.Ser.B345,101–118.
Colwell,R.K.,Mao,C.X.,Chang,J.,2004.Interpolating,extrapolating,andcomparing incidence-basedspeciesaccumulationcurves.Ecology85,2717–2727. Colwell,R.K.,2009.EstimateS,Version8.2:StatisticalEstimationofSpeciesRichness
andSharedSpeciesfromSamples.
Cooper,A.,McCann,T.,Rogers,D.,2009.NorthernIrelandCountrysideSurvey2007: BroadHabitatChange1998–2007.NorthernIrelandEnvironmentAgency, Re-searchandDevelopmentSeries09/06.Belfast.
DiGregorio,A.,Jansen,L.J.M.,2000.TheLandCoverClassificationSystem(LCCS): Classification Conceptsand User Manual.FAO/UNEP/Cooperazione italiana Roma,177pp.
Dumortier,M.,Butaye,J.,Jacquemyn,H.,VanCamp,N.,Lust,N.,Hermy,M.,2002. Predictingvascularplantspeciesrichnessoffragmentedforestsinagricultural landscapesincentralBelgium.For.Ecol.Manage.158,85–102.
EEA,2005.AgricultureandenvironmentinEU-15—theIRENAindicatorreport.EEA Report6/2005.
EEA,2007.Haltingthelossofbiodiversityby2010:proposalforafirstsetof indica-torstomonitorprogressinEurope.EEATechnicalReport11/2007.
Elena-Rosselló,R.,Tella,G.,Castejón,M.,1997.ClasificaciónBiogeoclimáticade Espa ˜naPeninsularyBalear.MinisteriodeAgricultura,PescayAlimentación, Madrid.
Elena-Rosselló,R.,Bola ˜nos,F.,Gómez,V.,González,S.,Ortega,M.,Garcíadel-Barrio, J.M.,2005.TheSISPARES(SpanishRuralLandscapeMonitoringSystem) expe-rience.In:Bunce,R.G.H.,Jongman,R.H.G.(Eds.),LandscapeEcology inthe Mediterranean:InsideandOutsideApproaches,ProceedingsofEuropeanIALE Conference.Faro,Portugal.
Esseen,P.A.,Glimskar,A.,Ståhl,G.,Sundquist,S.,2006.FieldSamplingProtocolfor NationalInventoryofLandscapesinSweden.Dept.ofForestResource Manage-ment,SwedishUniversityofAgriculturalSciences,Umeå.
EuropeanCommission,2011.OurLifeInsurance,OurNaturalCapital:AnEU Biodi-versityStrategyto2020.
Evans,D.,2006.ThehabitatsoftheEuropeanUnionHabitatsDirective.In:Biology andEnvironment:ProceedingsoftheRoyalIrishAcademy,vol.106b.No.3,pp. 167–173.
Fagan,W.F.S.,Cosner,C.,1999.Howhabitatedgeschangespeciesinteractions.Am. Nat.153,165–182.
Firbank,L.G.,Barr,C.J.,Bunce,R.G.H.,Furse,M.T.,Haines-Young,R.H.,Hornung,M., Howard,D.C.,Sheail,J.,Sier,A.,Smart,S.M.,2003.Assessingstockandchangein landcoverandbiodiversityinGB:anintroductiontoCountrysideSurvey2000. J.Environ.Manage.67,207–218.
GarcíaDelBarrio,J.M.,Ortega,M.,VázquezDeLaCueva,A.,Elena-Rosselló,R.,2006. TheInfluenceoflinearelementsonplantspeciesdiversityofMediterranean rurallandscapes:assessmentofdifferentindicesandstatisticalapproaches. Environ.Monit.Assess.119,137–159.
GEOBON,2010.GrouponEarthObservationsBiodiversityObservationNetwork DetailedImplementationPlan.
GEOBON,2011.AdequacyofBiodiversityObservationSystemstosupporttheCBD 2020Targets.AreportpreparedbytheGrouponEarthObservationsBiodiversity ObservationNetwork(GEOBON),fortheConventiononBiologicalDiversity. GEOBONOffice,Pretoria,SouthAfrica.
Gotelli,N.,Colwell,R.K.,2001.Quantifyingbiodiversity:proceduresandpitfallsin themeasurementandcomparisonofspeciesrichness.Ecol.Lett.4,379–391. Halada,L.,Jongman,R.H.G.,Gerard,F.,Whittaker,L.,Bunce, R.H.G.,Bauch,B.,
Schmeller,D.S.,2009.EuropeanBiodiversityObservationNetwork–EBONE.In: ProceedingsoftheEuropeanConferenceoftheCzechPresidencyoftheCouncil oftheEUTowardsEnvironment,MasarykUniversity,Prague,CzechRepublic. Hazeu,G.W.,Metzger,M.J.,Mücher,C.A.,Perez-Soba,M.,RenetzederChAndersen,
E.,2011.Europeanenvironmentalstratifications:anoverview.Agric.Ecosyst. Environ.142,29–39.
Henry,P.H., Lengyel,S., Nowicki, P., Julliard, R., Clobert,J., Celik, T., Gruber, B., Schmeller, D.S., Babij, V., Henle, K., 2008. Integrating ongoing biodi-versitymonitoring:potentialbenefitsandmethods.Biodivers.Conserv.17, 3357–3382.
Honnay,O.,Verheyen,K.,Hermy,M.,2002.Permeabilityofancientforestedgesfor weedyplantspeciesinvasion.For.Ecol.Manage.161,109–122.
Larigauderie,A.,Mooney,H.A.,2010.TheIntergovernmentalScience-Policy Plat-formonBiodiversityand EcosystemServices:movinga stepcloserto an IPCC-like mechanism for biodiversity. Curr. Opin. Environ. Sustainability, http://dx.doi.org/10.1016/j.cosust.2010.02.006.
Lengyel,S.,Deri,E.,Vagra,Z.,Horváth,R.,Tóthmérész,B.,Henry,P.Y.,Kobler,A., Kut-nar,L.,Babij,V.,Selˇiskar,A.,Christia,C.,Papastergiadou,E.,Gruber,B.,Henle,K., 2008.HabitatmonitoringinEurope:adescriptionofcurrentpractices.Biodivers. Conserv.17,3327–3339.
Lobo,J.M.,Castro,I.,Moreno,J.C.,2001.Spatialandenvironmentaldeterminantsof vascularplantspeciesrichnessdistributionintheIberianPeninsulaandBalearic Islands.Biol.J.Linn.Soc.73,233–253.
Lomba,A.,Bunce,R.G.H.,Jongman,R.H.G.,Moreira,F.,Honrado,J.,2010.Interactions betweenabioticfilters,landscapestructureandspeciestraitsasdeterminants ofdairyfarmlandplantdiversity.LandscapeUrbanPlann.99,248–258. Lomba,A.,Vicente,J.,Moreira,F.,Honrado,J.,2011.Effectsofmultiplefactorson
plantdiversityofforestfragmentsinintensivefarmlandofNorthernPortugal. For.Ecol.Manage.262,2219–2228.
Lomba,A.,Gonc¸alves,J.,Moreira,F.,Honrado,J.,2012.Simulatinglong-termeffects ofabandonmentonplantdiversityinMediterraneanmountainfarmland.Plant Biosyst.,http://dx.doi.org/10.1080/11263504.2012.716794.
Lughadha,E.N.,Baillie,J.,Barthlott,W.,Brummitt,N.A.,Cheek,M.R.,Farjon,A., Gov-aerts,R.,Hardwick,K.A.,Hilton-Taylor,C.,Meagher,T.R.,Moat,J.,Mutke,J.,Paton, A.J.,Pleasants,L.J.,Savolainen,V.,Schatz,G.E.,Smith,P.,Turner,I.,Wyse-Jackson, P.,Crane,P.R.,2005.Measuringthefateofplantdiversity:towardsafoundation forfuturemonitoringandopportunitiesforurgentaction.Philos.Trans.R.Soc. Lond.Ser.B:Biol.Sci.360,359–372.
Mace,G.M.,Baillie,J.E.M.,2007.The2010biodiversityindicators:challengesfor scienceandpolicy.Conserv.Biol.21(6),1406–1413.
Magurran,A.E.,2004.MeasuringBiologicalDiversity.Blackwell,Oxford.
Mander,Ü.,Külvik,M.,Jongman,R.,2003.Scalinginterritorialecologicalnetworks. Landschap20(2),113–127.
Margalef,R.,1974.Ecología.Omega,Barcelona.
Marshall,E.J.P.,Moonen,A.C.,2002.FieldmarginsinnorthernEurope:theirfunctions andinteractionswithagriculture.Agric.Ecosyst.Environ.89,5–21.
McCollin,D.,Jackson,J.I.,Bunce,R.G.H.,Barr,C.J.,Stuart,R.,2000.Hedgerowsas habitatforwoodlandplants.J.Environ.Manage.60,77–90.
Metzger,M.J.,Bunce,R.G.H.,Jongman,R.H.G.,Mucher,C.A.,Watkins,J.W.,2005.A climaticstratificationoftheenvironmentofEurope.GlobalEcol.Biogeogr.14, 549–563.
Metzger,M.J.,Bunce,R.G.H.,vanEupen,M.,Mirtl,M.,2010.Anassessmentoflong termecosystemresearchactivitiesacrossEuropeansocio-ecologicalgradients. J.Environ.Manage.91,1357–1365.
Mitchell,T.D.,Carter,T.R.,Jones,P.D.,Hulme,M.,New,M.,2004.Acomprehensive setofhigh-resolutiongridsofmonthlyclimateforEuropeandtheglobe:the observedrecord(1901–2000)and16scenarios(2001–2100).TyndallCentre WorkingPaperno.55.TyndallCentreforClimateChangeResearch,University ofEastAnglia,Norwich,UK.
Morillo,C.,Gomez-Campo,C.,2000.ConservationinSpain,1980–2000.Biol. Con-serv.95(2),165–174.
Myers,N.,Mittermeier,R.A.,Mittermeier,C.G.,daFonseca,G.A.B.,Kent,J.,2000. Biodiversityhotspotsforconservationpriorities.Nature403,853–858. Ortega,M.,Metzger,M.J.,Bunce,R.G.H.,Wrbka,T.,Allard,A.,Jongman,R.H.G.,
Elena-Rosselló,R.,2012.Thepotentialforintegrationofenvironmentaldatafrom regionalstratificationsintoaEuropeanmonitoringframework.J.Environ.Plann. Manage.55,39–57.
Planty-Tabacchi,A.M.,Tabacchi,E.,Naiman,R.J.,Deferreri,C.,Décamps,H.,1996. Invasibilityofspecies-richcommunitiesinRiparianzones.Conserv.Biol.10, 598–607.
Pereira,H.M.,Cooper,H.D.,2006.Towardstheglobalmonitoringofbiodiversity change.TrendsEcol.Evol.21(3),123–129.
Pereira,H.M.,Leadley,P.,Proenc¸a,V.,Alkemade,R.,Scharlemann,J.P., Fernandez-Manjarrés,J.,Araújo,M.B.,Balvanera, P.,Biggs,R.,Cheung,W.,Cooper,D., Gilman,E.L.,Guénette,S., Hurtt,G.C.,Huntington, H.P.,Mace,G.M., Ober-dorff,T.,Revenga,C.,Rodrigues,P.,Scholes,R.J.,Sumaila,R.U.,Walpole,M., 2010.Scenariosforglobalbiodiversityinthe21stcentury.Science330(6010), 1496–1501.
Rescia,A.J.,Pons,A.,Lomba,I.,Esteban,C.,Dover,J.W.,2008.Reformulatingthe social–ecologicalsysteminaculturalruralmountainlandscapeinthePicosde Europaregion(northernSpain).LandscapeUrbanPlann.88,23–33.
ReyBenayas,J.M.,Scheiner,S.M.,2002.Plantdiversity,biogeographyand envi-ronment in Iberia: patterns and possible causal factors. J. Veg. Sci. 13, 245–258.
Rogers,D.,Cooper,A.,McKenzie,P.,McCann,T.,2012.Assessingregionalscale habi-tatareawithathreedimensionalmeasure.Ecol.Inform.7,1–6.
Saunders,D.A.,Hobbs,R.,1991.NatureConservation2:TheRoleofCorridors.Surrey Beatty&Sons,ChippingNorton,NewSouthWales.
Scheiner,S.M.,Rey-Benayas,J.M.,1994.Globalpatternsofplantdiversity.Evol.Ecol. 8,331–347.
Scholes,R.J.,Mace,G.M.,Turner,W.,Geller,G.N., Jürgens,N.,Larigauderie, A., Muchoney,D.,Walther,B.A.,Mooney,H.A.,2008.Towardsaglobalbiodiversity observingsystem.Science321,1044–1045.
Sheail,J.,Bunce,R.G.H.,2003.Thedevelopmentandscientificprinciplesofan envi-ronmentalclassificationforstrategicecologicalsurveyintheUnitedKingdom. Environ.Conserv.30,147–159.
Smith,E.P.,vanBelle,G.,1984.Nonparametricestimationofspeciesrichness. Bio-metrics40,119–129.
Vicente,J.,Randin,C.F.,Gonc¸alves,J.,Metzger,M.,Lomba,A.,Honrado,J.,Guisan,A., 2011.Wherewillconflictsbetweenalienandrarespeciesoccurafterclimate
andland-usechange?Atestwithanovelcombinedmodelingapproach.Biol. Invasions13,1209–1227.
Wagner, H.H., Wildi, O., Ewald, K.C., 2000. Additive partitioning of plant species diversityin an agriculturalmosaic landscape. LandscapeEcol. 15, 219–227.