Strength and porosity evolution of two cement mortar
submerged in pig slurry
E. Sánchez
1), A. Moragues
2), J. Massana
3), R. Antón
2), J. López
3), M.A.
Garcimartín
3)1) Polytechnic University of Madrid (UPM) Department of Applied Science and Technology. Ciudad Universitaria s/n. 28040 Madrid. Spain. [email protected].
2) UPM. Department of Civil Engineering: Construction. Spain. [email protected]. 3) UPM. Department of Construction and Rural Roads. Av. Complutense s/n. 28040 Madrid. Spain.
[email protected], [email protected], [email protected]. Abstract
Pig slurry is an agricultural by-product used chiefly to fertilize cultivated fields. The demand for fertilizer depends on crop cycles. So, the slurry must be stored over long periods of time. In Spain, the lagoons of different depths generally used for such storage are made of brick
covered with plain or reinforced concrete. Also, the slurry is in contact with other precast concrete structural members. The degradation of these structures may entail substantial economic loss, in patterned flooring especially, where deterioration-induced collapse can
cause severe injury to the animals.
The paper presents two aspects related to the durability of the mortar cements. In it addresses the variations observed in porosity and flexural and compressive strength in two types of cement mortar when submerged in pig slurry. The tests were conducted in a 100 m3
experimental lagoon. The mortars were exposed to three types of environments for 36 months: one outside the test lagoon and two submerged in it, at two different depths. Bending and compression measurements were taken after 3, 12, 24 and 36 months. In
addition, 3, 24 and 36 month specimens were tested for total porosity and pore-size distribution.
1. Introduction
Pig slurry is an agricultural by-product used chiefly to fertilize cultivated fields. The demand for fertilizer depends on crop cycles. So, the slurry must be stored over long periods of time. In Spain, the lagoons of different depths generally used for such storage are made of brick
covered with plain or reinforced concrete. These lagoons are not watertight due to the appearance of cracks or leaks, with the concomitant risk of environmental damage in the form of the pollution of underground or runoff water [1]. In farm enclosures slurry is also in
patterned flooring especially, where deterioration-induced collapse can cause severe injury
to the animals [2-3].
Slurry composition depends on many factors, including animal physiology, type of feed, facility typology and management and so forth. Its complex chemical composition, with organic and inorganic compounds, varied over time. The three main groups of organic
components were: organic acid (acetic, propionic, isovaleric), nitrogenous compounds (primarily ammonia-based) and a number of hydrosulphide compounds deriving from urea denaturation. The result is a compound with a pH ranging from 7 to 8. The Spanish structural
concrete code, EHE [4], regards substances with a pH of over 6.5 to be non-aggressive from the standpoint of acid damage. Nonetheless, research has shown that concrete and mortar in contact with such slurries deteriorate systematically, with a decline in their load capacity
[5]. Clearly, then, degradation is the outcome of the synergies between various factors. Some researchers have attempted to reproduce this sort of concrete degradation in the laboratory [6], by testing different types of cements after exposure to specific organic salts
with varying pH values or analyzing the mechanism involved in cement matrix alterations caused by a combination of acids [7].
The use of sulphate-resistant Portland cement and pozzolanic cements with silica fume or fly ash additions is standard practice in concrete farm buildings in a number of countries [3]. In
Spain, the cements most commonly used in rural environments are type I Portland and Portland with additions, particularly fly ash. The use of the former is based on its availability and suitability for works of all kinds. The latter is used due to its lower cost, and the added
advantage that replacing part of the Portland cement with fly ash improves mortar and concrete durability by enhancing resistance to chemical agents and reducing permeability [8-10].
This paper reports on research conducted to ascertain the impact of pig slurry on mortars
made with different types of cement. The values found for flexural and compressive strength, total porosity and pore size distribution at different test times are given.
2. Materials and methods
2.1. Cements
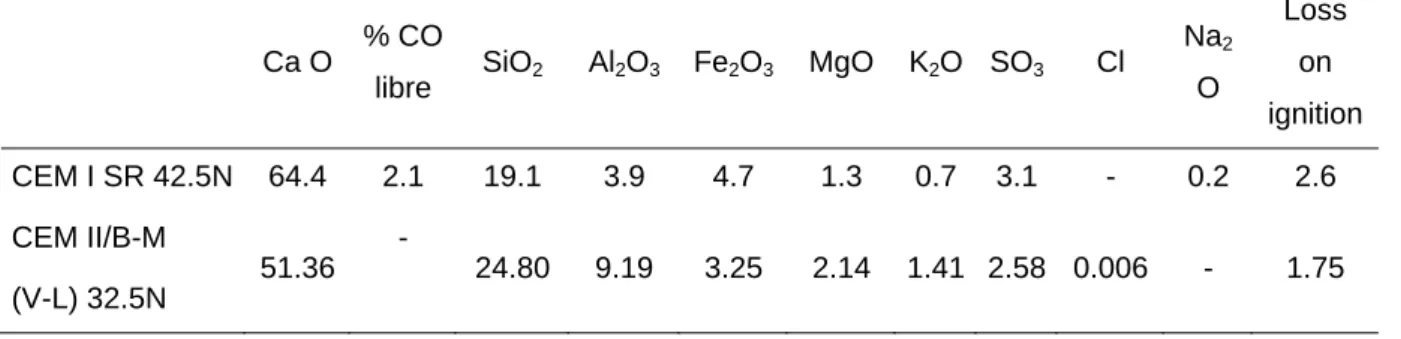
The study was conducted with two types of cement: a sulphate-resistant Portland cement, CEM I SR 42.5 N, and a blended cement with fly ash and limestone filler, CEM II / B-M (V-L)
32.5 N. The chemical and mineralogical compositions of the two cements are given in Table 1.
Ca O % CO
libre SiO2 Al2O3 Fe2O3 MgO K2O SO3 Cl
Na2
O
Loss
on
ignition
CEM I SR 42.5N 64.4 2.1 19.1 3.9 4.7 1.3 0.7 3.1 - 0.2 2.6
CEM II/B-M
(V-L) 32.5N
51.36 -
24.80 9.19 3.25 2.14 1.41 2.58 0.006 - 1.75
Three prismatic specimens (40 x 40 x 160 cm) with a water/cement ratio of 0.5 and a sand/cement ratio of 3/1 were prepared for each cement type, environment and exposure time. The specimens were made to European standard EN 196-1:194 requirements. They
were de-moulded 24 hours later and cured in water for 28 days at 22ºC. Zero time tests were conducted on three samples of each mortar type, while the others were placed in the respective aggressive environments.
2.2. Aggressive medium
The aggressive medium used was pig slurry from a farm storage lagoon at Etreros in the
Spanish province of Segovia.
The farm is located in central Spain, where the mean summertime relative humidity is 48% and the mean temperature is 20ºC. The values for the rest of the year are 75% and 9ºC, respectively. The area has 56 frost days per year.
The slurry composition is variable. It depend a many factors than changed along time. Therefore, the slurry was sampled and analyzed after 3, 6, 12, 18, 24 and 36 months. The
minimum, maximum and mean values are shown in Table 2.
The highest content values were found for ammonia nitrogen, sulphides, chlorides and acetic and propionic acid. The maximum value of ammonia nitrogen present (0.25%), taking NH4+
separately, was sufficiently high to classify the slurry as a medium or highly aggressive
substance, according to Spanish structural concrete code EHE [4]. The maximum chloride content, whose origin is to be found in the cleaning water used to hose the facility, generated salinity similar to the values observed in seawater (1472 mg/l in aerobic, and 780 mg/l in
anaerobic environments). Moreover, the acetic acid content was high enough to cause acid attack. Another potentially aggressive agent was the pH, which at values ranging from 7.21 to 8.13 was much lower than the mortar pore solution pH (12.7) [11]. Inasmuch as this pH
gradient may lead to the dissolution of the much more basic portlandite, slurry can be regarded to be an aggressive substance.
Aerobic Environment Anaerobic Environment
Min. Aver. Max. Min. Aver. Max.
pH 7.30 7.67 8.10 7.21 7.52 8.13
Total nitrogen (%) 0.06 0.19 0.28 0.06 0.22 0.38
Ammoniac nitrogen (%) 0.05 0.10 0.12 0.05 0.13 0.25
Sulphurs (mg/l) 5.36 81.24 115.00 4.80 90.32 162.87
Bicarbonates (mg/l) 3.38 5.85 10.55 3.37 7.13 11.66
Anions
Sulphurs (mg/l) 0.00 7.35 12.79 0.00 23.55 177.95
Chlorides
(mg/l) 61.00 462.42 1427.00 209.00 445.83 780.00
Acids
Acetic (mg/l) 32.55 153.79 286.70 7.86 89.13 192.00
Propionic
(mg/l) 0.00 48.96 124.60 0.00 27.85 93.890
Isovaleric
(mg/l) 0.00 2.13 3.50 0.00 0.56 1.20
2.3. Experimental procedures
The tests were conducted in an experimental lagoon located near the farm’s own storage lagoon. Its two basins measured 4x8 m with depths of one and three metres, inter-connected by a canal to facilitate the filling process. A detailed sketch of the experimental facility is
given in E. Sánchez et al. [12].
The specimens were placed on the bottom of the basins, where conditions were aerobic at a depth of one and anaerobic at a depth of three metres. These conditions reproduced the environments prevailing on pig farms (lagoons from 1 to 1.5 m deep and tanks or deep
lagoons 2 to 4 m deep). Control specimens were placed in the open air alongside the canal connecting the two basins. Consequently, three aggressive environments were studied:
• A natural environment (I) with full oxygen and carbon dioxide availability.
• An aerobic environment (II) in slurry one metre deep, with medium to low oxygen
content and aerobic fermentation.
• An anaerobic environment (III) with specimens submerged in 3-m deep slurry, with
Three specimens were withdrawn from each environment after 3, 12, 24 and 36 months,
washed and submerged in water for 48 hours. Compressive and flexural strength tests were subsequently conducted to European standard EN196-1:1994 at INTEMAC‘s (Instituto Técnico de Materiales y Construcciones) central laboratory.
Mortar microstructure was characterized after 24 and 36 months of exposure to the
aggressive medium.
Mercury intrusion porosity (MIP) trials were run on a Micromeritics Autopore IV 9500
porosimeter that operates at pressures of up to 33,000 psi (228 MPa) and covers pore
diameters of from 175 to 0.006 µm. Each 3-g specimen was dried for 48 hours at a temperature of 22 ± 2 ºC and a relative humidity of 50%. The samples were taken from one
of the exposed sides of the specimen and tested after reaching a constant weight, to an accuracy of 0.01 g. Sample weight was stabilized in an oven at 40 ºC.
3. Results and discussion
3.1. Mechanical strength
An ANOVA was run on the strength values. This entailed, for both compressive and flexural
strength, verifying the normal distribution fitting of the residual values, finding the difference, for each data item in a given group, between that value and the mean value for the group. The analysis showed that there were no systematic errors attributable to measurements or
specimen manufacture.
3.1.1. Flexural strength
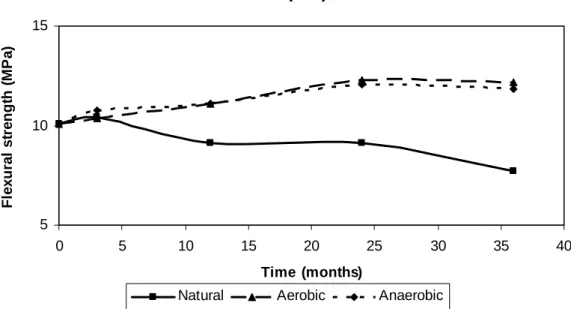
Figures 1 and 2 show the flexural strength results in the three environments for mortars made with cements CEM I and CEM II. Performance was similar in the two cements, although with slight differences. In CEM I bending strength remained essentially unchanged
up to 12 months in all three environments, with a slight rise in strength at 24 months and a decline after 36. CEM II performed nearly identically in the two submerged environments, but exhibited a steady decline in strength in the natural environment. In the natural environment,
the flexural strength was similar in the two cements, with insignificant differences. Differences in flexural strength were found, however, between natural and submerged environment specimens. The values obtained for submerged specimens were significantly
CEM I-SR 42.5N
5 10 15
0 5 10 15 20 25 30 35 40
Time (months)
Fl
e
x
ur
a
l s
tr
e
ngt
h (
M
P
a
)
Natural Aerobic Anaerobic
Figure 1. Variation of flexural strength for the CEM I in the three environments.
CEM II/B-M (V-L) 32.5N
5 10 15
0 5 10 15 20 25 30 35 40
Time (months)
Fl
e
x
ur
a
l s
tr
e
ngt
h (
M
P
a
)
Natural Aerobic Anaerobic
Figure 2. Variation of flexural strength for the CEM II in the three environments.
The two cements performed similar in both submerged environments. After 24 months the flexural strength values for the two cements differed by less than 2 MPa. After 36 months these differences increased to around 3 MPa. The decline in CEM I flexural strength between
24 and 36 months was 12% in the aerobic environment and 25% in the anaerobic environment. CEM II strength values did not differ significantly between 24 and 36 months.
despite its lower strength class (32.5 N compared to 42.5 N for CEM I). The authors believe
that this is due to the increased hydration resulting from the fly ash-mediated pozzolanic reactions taking place in cement CEM II [10, 12-14].
3.1.2. Compressive strength
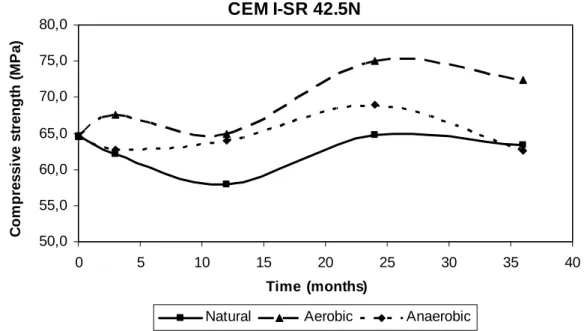
Figures 3 and 4 show the compressive strength findings for cements CEM I and CEM II in the three environments.
CEM I-SR 42.5N
50,0 55,0 60,0 65,0 70,0 75,0 80,0
0 5 10 15 20 25 30 35 40
Time (months) C o m p re s s iv e s tr e ngt h ( M P a )
Natural Aerobic Anaerobic
Figure 3. Variation of compressive strength for the CEM I in the three environments.
CEM II/B-M (V-L) 32.5N
50,0 55,0 60,0 65,0 70,0 75,0 80,0
0 5 10 15 20 25 30 35 40
Time (months) C o m p re s s iv e s tr e ngt h ( M P a )
Natural Aerobic Anaerobic
In the natural environment, cement CEM I declined steadily by a total of 10% during the first
12 months of exposure. The initial value was recovered between 12 and 24 months, and then maintained up through the end of the trial (36 months). CEM II followed a pattern typical of Portland cement with fly ash additions, i.e., a steady increase of 17% in the first 12 months
followed by a slight increase subsequently maintained through the end of the 36-month trial period [12-15].
In submerged environments, strength tended to increase in both cements up to 24 months, and decline after 36 months of exposure. In the aerobic environment, CEM I maintained its
compressive strength with no significant variations up to the twelfth month of exposure, and showed an increase of around 16% after 24 months. This increase was 7% in the anaerobic environment. Strength declined in this cement after 36 months in both environments, by
about 3.5% in the aerobic and 9.5% in the anaerobic medium.
No significant differences were recorded in cement CEM II performance in the two submerged environments, a finding that concurred with earlier results obtained by E. Sánchez et al. [12]. Strength increased steadily in this cement by a total of around 36% up to
24 months of exposure. The strength declined in both environments after 36 months, by about 8.5% and 3% in the aerobic and anaerobic media, respectively.
The increase in compressive strength in the natural environment was on the order of one half of the rise found in the submerged environments. After 36 months, however, strength values tended to converge, with no significant differences between the natural and aerobic
environments.
Significant differences were found between the cements in the anaerobic environment, with CEM II exhibiting consistently higher strength than CEM I. In the aerobic environment, however, the CEM I values were significantly higher after both 24 and 36 months.
3.2. Porosity tests
Figure 5 shows the total porosity for the two cements studied at different test ages and in
different environments. Porosity was observed to decline in all cases after 24 months of exposure. The greatest decline, at around 30%, was recorded for cement CEM I in the aerobic environment (I) and CEM II in the anaerobic environment (II). After 36 months,
0 2 4 6 8 10 12 14
I II III I II III
CEM I-SR 42.5N CEM II/B-M(V-L) 32.5N
Tot
a
l por
os
it
y
(
v
ol
um
e
n
%
)
28 days 24 months 36 months
Figure 5. Total porosity by mercury intrusion porosimetry expressed in volume percentage.
Total porosity and compressive strength values in specimens exposed to slurry attack an
inverse relationship, which is in line with findings reported by other authors [16-18].
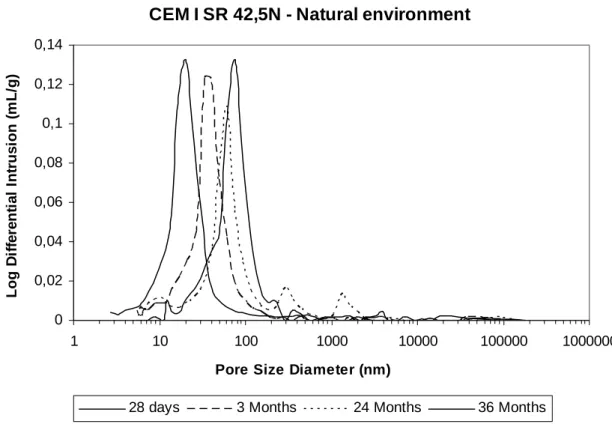
Figures 6 and 7 show pore size distribution for cements CEM I and CEM II, respectively,
after 28 days of curing and 3, 24 and 36 months in a natural environment.
After 28 days of curing, the porosity results for the two cements studied were similar, because at first the fly ash behaves like an inert material [19]. The variations in distribution in a natural medium differed widely, however. In cement CEM I, the 24-month findings showed
a clear shift toward larger radii, with a reduction in porosity. The mean pore radius rose slightly in cement CEM II, in conjunction with a decline in total porosity.
These findings are consistent with leaching processes associated, in the case of CEM II, with a reduction in total porosity due to the pozzolanic reaction generated by the fly ash. In
principle, no other mechanism appears to be involved [8].
Figures 8 and 9 show pore size distribution for cements CEM I and CEM II, respectively,
after 28 days of curing and 3, 24 and 36 months in an aerobic environment.
CEM I SR 42,5N - Natural environment
0 0,02 0,04 0,06 0,08 0,1 0,12 0,14
1 10 100 1000 10000 100000 1000000
Pore Size Diameter (nm)
Log D
if
fe
re
nt
ia
l I
n
tr
us
ion (
m
L/
g)
28 days 3 Months 24 Months 36 Months
Figure 6. Pore-size distribution for the CEM I cement in the natural environment.
CEM II/B-M (V-L) 32,5N - Natural environment
0 0,01 0,02 0,03 0,04 0,05 0,06 0,07 0,08 0,09 0,1
1 10 100 1000 10000 100000 1000000
Pore Size Diameter (nm)
Log D
if
fe
re
n
ti
a
l I
n
tr
us
ion (
m
L/
g)
28 days 3 Months 24 Months 36 Months
CEM I SR 42,5N - Aerobic environment
0 0,02 0,04 0,06 0,08 0,1 0,12 0,14
1 10 100 1000 10000 100000 1000000
Pore Size Diameter (nm)
Log
D
if
fe
re
nt
ia
l I
n
tr
us
io
n
(m
L
/g
)
28 days 3 Months 24 Months 36 Months
Figure 8. Pore-size distribution for the CEM I cement in the aerobic environment.
CEM II/B-M (V-L) 32,5N - Aerobic environment
0 0,02 0,04 0,06 0,08 0,1 0,12
1 10 100 1000 10000 100000 1000000
Pore Size Diameter (nm)
Log D
if
fe
re
nt
ia
l I
n
tr
us
ion (
m
L/
g)
28 days 3 Months 24 Months 36 Months
Likewise in both cements, the shift toward smaller pore sizes was less perceptible than in the
natural medium.
These changes in pore size distribution illustrate the alterations taking place in the specimens. The natural environment clearly prompted leaching in both cements and an increase in the mean radius, more significantly in CEM I.
Pore size underwent less change in submerged environments, with a reduction in pore radius recorded for CEM II. That decline was consistent with the presence of fly ash in its
composition [20].
4 Conclusions
Since the strength studies showed that the load capacity attained by the two cements was similar after 36 months. The more expensive 42.5 sulphate-resistant cement is not justified to use. After 36 months, both cements showed signs of declining strength in submerged
environments. Moreover, both had shown increased strength in submerged environments at earlier ages, presumably due to intensified hydration. These increases disappeared
altogether after 36 months.
The following conclusions may be drawn from the above findings:
• Since the 36-month load capacity of the cements studied was similar, the use of a
higher strength, sulphate-resistant cement is not justified. Lower strength class cement with fly ash additions performed equally well, at a lower price.
• In submerged environments, the two cements exhibited greater strength at the
various ages. In such media, the decline recorded after 36 months was never smaller than the variation observed in the natural environment.
• The increase in the mean pore size observed in the natural environment did not lead
to lower strength in the test period. The changes in pore size distribution and mean
pore size values were scantly significant in submerged environments.
• Although up to the age of 24 months, porosity declined in submerged environments,
after that age and up to 36 months, this parameter was observed to increase. This
may indicate the onset of mortar degradation. In CEM II, where the changes were less significant, the degradation process could be expected to proceed at a slower pace.
• The slurry used can be regarded to be an aggressive agent for cement mortars after
Acknowledgements
The authors gratefully acknowledge the financial support by the Minister of Science and Technology (Project Nº MAT2002-03945 and Project Nº BIA2006-15188-C03-03). Also they
wish to express their thanks for the financial support given by the Spanish Institute of Cement and its Applications (IECA).
References
[1] D.Q. Daudén, et al., Pig slurry application and irrigation effects on nitrate leaching in Mediterranean soil lysimeters, Journal of Environmental Quality 33 (6) (2004) 2290-2295.
[2] J. Calleja, The aggresive agents for concrete in agricultural livestock and agroalimentary industries. IVth Int. Symposium Concrete for a Sustainable Agriculture, -Agro, -Aqua and Community Applications Proceeding, San Lorenzo de El Escorial, Madrid, (2005) 139-152.
[3] N. De Belie, et al., Attack of concrete floors in pig houses by feed acids: influence of fly ash addition and cement-bound surface layers, J. Agric. Engng. Res. 68 (1997) 101-108.
[4] MOPU, Instrucción de Hormigón Estructural. EHE, Ministerio de Fomento, Madrid, Spain (1999). [5] N. De Belie, et al, Durability of building materials and components in the agricultural environment Par III:
Concrete Structures, J. of Agricultural Engineering Research 76 (2000) 3-16.
[6] A. Bertron, et al., Cement pastes alteration by liquid manure organic acids: Chemical and mineralogical characterization, Cement and Concrete Research 35 (2005) 155-166.
[7] A. Bertron, et al., Accelerated test of hardened cement pastes alteration by organic acids: analysis of the pH effect. Cement and Concrete Research; 34 (2004) 1823-1835.
[8] Manmohan, D. Y Mehta, P.K. Influence of Pozzolanic, Slag, and Chemical Admixture on Pore Size Distribution and Permeability of Hardened Cement Pastes. Cement, Concrete and Aggregates, 3 (1981) 1 63–67. [9] M. Fernandez, Hormigón. Colegio de Ingenieros de Caminos, Canales y Puertos. Madrid, Spain (2004). [10] M. Cyr, et al., Efficiency of mineral admixtures in mortars: quantification of the physical and chemicals effects
of fine admixtures in relation with compressive strength. Cement and Concrete Research 36 (2006) 264-277.
[11] A. Moragues, et al., Equilibria of the chemical composition of the pore concrete solution. Part I. Calculation of equilibria constant of synthetic solution, Cement and Concrete Research 17 (1988) 173-189.
[12] E. Sánchez, et al., Mechanical strength and microstructure evolution of fly ash cement mortar submerged in pig slurry, Cement and Concrete Research (2007), doi:10.1016/j.cemconres.2007.09.021.
[13] P. Huang, et al., Influence of HCL corrosion on the mechanical properties of concrete, Cement and Concrete Research 35 (2005) 584-589.
[14] Li Yong-Xin, et al., A study on the relationship between porosity of the cement paste with mineral additives and compressive strength of mortar based on this paste, Cement and Concrete Research 36 (2006) 1740-1743.
[15] S.P. Pandey, et al., The influence of mineral additives on the strength and porosity of OPC mortar, Cement and Concrete Research 30 (2000) 19-23.
[16] J.J. Beaudoin et al., Handbook of Analytical Techniques in Concrete Science and Technology, National Research Council of Canada, Noyes Publications 2001, pp. 528-628
[18] B.Lothenbach, et al., Thermodynamic modelling of the effect of temperature on the hydation and porosity of Portland cement, Cement and Concrete Research (2007), doi:10.1016/j.cemconres.2007.08.017. [19] Fraay, A., et al., The Reaction of Fly Ash in Concrete: a Critical Examination, Cement and Concrete
Composites, 19 (1989) 235–246.