ORIGINAL REPORT
The Use of Medication by the Spanish Population
M. CARMEN DEL RIO MD, CARLOS PRADA MD AND F. JAVIER ALVAREZ MD
Department of Pharmacology and Therapeutics, Faculty of Medicine, University of Valladolid, Valladolid, Spain
SUMMARY
The aim of the study was to assess patterns of the use of medicines by the general population older than 0 years. The study was based on the information contained in the computerized database from the 1993 Spanish Household Health Survey. A representative sample of the population older than 0 was identi-®ed, and a survey of 26,334 persons was carried out. Of the population 45.3% had taken some medicine in the last 2 weeks prior to the carrying out of the survey. The proportion was greater for women (50.6%) than for men (39.6%). With increasing age, the frequency and amount of medication use increased. A little over 20% of the medicines used were not prescribed by a doctor (self-medication). Data show the frequency of the use of medicines by the Spanish population. # 1997 by John Wiley & Sons, Ltd.
Pharmacoepidemiology and Drug Safety6: 41±48, 1997 No. of Figures: 2 No. of Tables: 3 No. of Refs: 22
KEY WORDSÐ drug utilization trends; self-medication; age factors; sex factors; adult; child;
general population
INTRODUCTION
The vast number of commercialized drugs, the great amount of medication used, and the ration-ality of such use have become major concerns for the public health authorities in many industrialized countries in the last few years.1±3 Related to
medication use, qualitative aspects are as impor-tant as quantitative ones: how are these medicines used? What positive or negative eects do they have on health in the community? etc.
Qualitative drug utilization studies provide useful information allowing us to develop strate-gies leading to a more rational use of medications. However, the majority of published drug utiliza-tion studies are based on informautiliza-tion derived from sales and prescriptions;1±3 drug utilization studies
based on a consumer approach are rare, despite the
great amount of information they provide. The need for standard methodology in drug utilization studies has already been acknowledged.4 In recent
years, it has been pointed out that a complete assessment of drug use should also take the social aspects into account.5
Consequently, the aim of this study has been the characterization of the use of medicines among the population from zero years of age onwards, the basis being the 1993 Spanish Household Health Survey.
Spain has a population of about 38 million, and the National Health Service covers nearly all of the population.6 Since the 1970s, the Drug
Regulatory Authority has reviewed Spanish pharmaceutical products, thus ensuring the e-cacy, safety and quality of the available medicines as a ®rst step towards the rational use of drugs. One of the activities developed was the `Prosereme programme', through which all pharmaceutical products were reviewed and many medicines were withdrawn or their formulations altered.6A study
carried out in 19817 showed that 41% of the Addressee for correspondence: F. Javier Alvarez,
Depart-ment of Pharmacology and Therapeutics, Faculty of Medi-cine, University of Valladolid, 47005 Valladolid, Spain, fax:(34 83) 423073 and(34 83) 423022.
medication used in that year was of high potential value; 12% of relative value; 25.5% of doubtful or no value, and 21.4% was rated as unacceptable. Fortunately, in our opinion, the present situation has largely changed.
In the last few years special eorts have been made to reduce medication costs to the National Health Service, as well as promoting rational medication use.8The latest ®gures show that
medi-cation costs have increased year by year, from 178,348 in 1984 to 641,701 in 1994 (®gures in million pesetas, 125 pesetas about 1 US dollar). The number of prescriptions increased between 1984 (432 million prescriptions) and 1992 (519), and then decreased in 1993 (506) and 1994 (494). Several databases, basically related to the prescribed drugs throughout the National Health Service and their cost, are currently available in our country.6These have been used in the performance
of drug utilization studies. However, assessment of the social aspects of medication use by Spaniards has not undergone the same amount of research.
METHODS
The study was based on information contained in the computerized database of the Spanish House-hold Health Survey carried out by the Spanish Ministry of Health in 1993.9 The work was under
the auspices of the SubdireccioÂn General de InformacioÂn Sanitaria y EstadõÂsticas Sanitarias. The ®eld work and recording of the information was carried out by the Centro de Investigaciones SocioloÂgicas. The aim of the survey was to obtain information concerning the aspects related to health and the use of health resources, including the use of medications.
A survey of 26,334 people (21,084 adults and 5,250 children under 16 years of age) who were a representative sample of the non-institutionalized Spanish population older than 0 years, was carried out. The sample was designed to be representative both at national and Autonomous Community (Regional) level. The sampling error, with a con®-dence level of 95.5%, was 0.8%, 0.9% in the case of adults and 1.8% in the case of children.
A complex multistage sample design was used. It was designed as follows: ®rst, by the Spanish communities (there are 17 Autonomous Comm-unities plus Ceuta and Melilla, comprising a total of 52 provinces); second, by seven stages according to the number of inhabitants: 52000
(n2249), 2001±10,000 (n4510), 10,001±50,000 (n6110), 50,001±100,000 (n2231), 100,001± 400,000 (n6160), 400,001±1,000,000 (n1715) and41,000,000 (n3329), (missingn29); third, by cities in each one of the communities, and ®nally, by age group: 1±10 years (n3350), 11±20 (n4176), 21±30 (n4228), 31±40 (n3564), 41±50 (n3147), 51±60 (n2971), 61±70 (n2805), 470 (n1745) (missing n 348), and by gender (males, n12,862; females,
n13,416; missingn56).
Questionnaires were completed by direct inter-view with selected people. The questionnaires were administered by trained interviewers. Regarding the children, the questionnaire was answered by their father, mother or guardian. When a person selected was unavailable or unwilling to be inter-viewed a replacement was chosen.
Although the questionnaires were dierent in both age groups (adults and children), they both included items relating to medication use. Those surveyed were asked: (i) if they had taken any kind of medicine in the last 2 weeks, (ii) if so, what kind of medicine they had taken (using 17 dier-ent therapeutics categories among adults, and 11 in the case of children), (iii) for each type of medication, if the medicine used was prescribed by a doctor or not (the latter case, was considered as self-medication).
Analysis of the data was carried out in the Data Processing Centre at Valladolid University, using the statistical package SAS (Version 6.07).
p Values 40.05 were considered to show signi®-cant dierences.
RESULTS
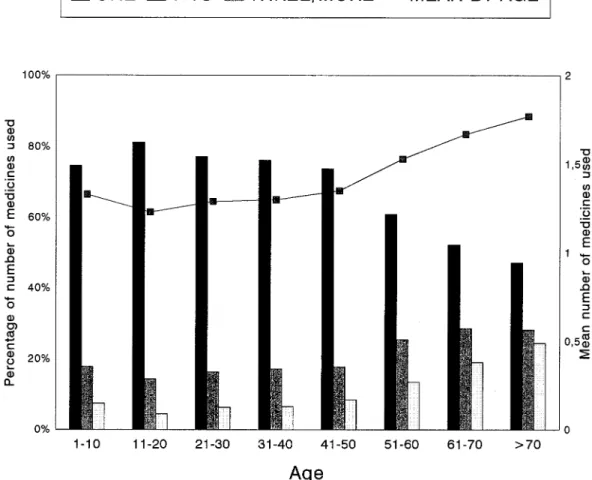
Of the Spanish population 45.3% had used some kind of medication in the two previous weeks (Fig. 1), 39.6% were men and 50.6% women 2
1314.10, p<0.0001). These dierences also
exist in the adult group (40.5% of men and 53.2% of women, 2
1332:71, p<0.0001), but
not in the children's age group (516 years of age): 36.4% for boys and 39.8% for girls2
16.25, p>0.05). From the 11±20 age group, the frequency of medicines used increased with age (Fig. 1). This trend was observed in both men and women.
three or more) per age group (Fig. 2), it is clear that, from the 11±20 age group, the taking of only one medicine decreased with age, with the taking of two, three or more medicines increasing in a parallel way. With regard to sex, dierences were observed (2
284.59, p<0.0001): men take only
one medicine (71.4%) more frequently than women (63.8%), while women take two (22.6%), three or more (13.7%) medicines at a greater rate percentage-wise than men (19.4% and 9.2%).
There were dierences in medicine used among adults depending on certain sociodemographic variables (Table 1): medicine use was more frequent the greater the size of the population; use was also more frequent among those who were widows, people with no schooling and the retired. These trends are found among both sexes.
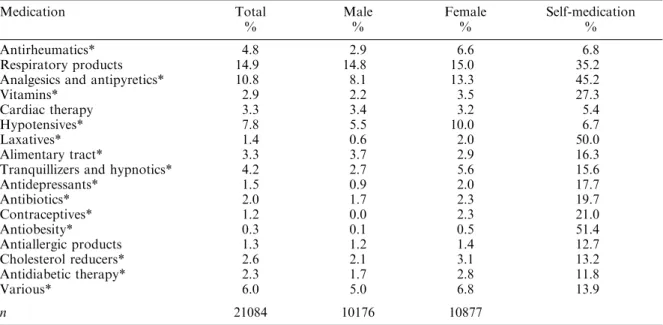
In the adult population surveyed (Table 2), the most frequent groups of drugs taken were res-piratory products (14.9%), analgesics/antipyretics (10.8%) and hypotensives (7.8%). In most
groups, the use of medicine was more common among women. Gastrointestinal preparations were more frequently used by men. No dierences existed between the sexes in respect of respiratory products, cardiac therapy, and antiallergic pro-ducts. Of the medicines used 23.4% were not prescribed by a doctor (self-medication). For men this percentage was 25.7% and for women 21.9% (2
128.50, p<0.0001). The groups of drugs in
which self medication was greater were: anti-obesity, laxatives, analgesics/antipyretics, and respiratory products (Table 2).
One out of four children polled, had used respiratory products (Table 3). There were dier-ences between sexes only in the respiratory products, which were more frequently used by boys (4.9%) than girls (4.2%). Among children 20.6% of the medicines used were not prescribed by a doctor (self-medication), 20.1% for boys and 21.1% for girls (2
10.38, p>0.05). The
more frequent were the analgesics, antipyretics, laxatives, tranquillizers and hypnotics.
DISCUSSION
The results obtained show the frequency of the use of medicines among the population. About 45% of those surveyed had used some kind of medicine during the previous 2 weeks.
One of the most important factors in¯uencing the level of drug use is age. Data10;11 consistently
indicate that the elderly use more drugs than younger age groups. Starting from the 11±20 age group, a progressive increase in frequency and number of medicines used is observed, because morbidity increases with age.
Another in¯uencing factor, although less important than age, is sex. Women not only use medicines more frequently than men, but also take more of them. Visits to the doctor are also more common among women than men. Similar data are found in other studies.10;12
The impact of socio-economic status on the taking of drugs is also evident.11
Other studies10 have shown that the accessibility
of health services, reimbursement systems, etc., may also play a part in the level of drug use. The availability of a doctor is essential in obtaining a prescription, and most consultations lead to a prescription.
As regards the therapeutic groups used, our data should be accepted with caution, mainly because: (i) during the period of the survey (February), the use of certain medicines was more frequent, and (ii) those surveyed were asked only about certain classes of drugs used, in some cases about very speci®c therapeutic groups (e.g. laxatives) and in others about a wide range of drugs (e.g. medication for the alimentary tract). This is due to the fact that, in order to make it easy for the user to understand, colloquial language has been used, and questions have been asked regarding thera-peutic categories which can be identi®ed easily.
Undoubtedly, information obtained from other sources, such as wholesale data, may be more accurate. Figures from wholesale data for 1991 show that the most frequently prescribed drugs were: central nervous system drugs (17.8%), respiratory products (16.8%), alimentary tract (16.4%), and cardiac therapy (9.7%). In addition, there are dierences in the prescription of certain medicines between countries (e.g. benzodiaze-pines).13
According to our data, one out of ®ve medicines used in the previous 2 weeks, both among adults and children, was not prescribed by a doctor. One of the groups of drugs in which self-medication is greatest is that of analgesics and antipyretics. These data accord with those obtained in other studies.14
Two completely dierent situations are involved in self-medication. Firstly, the use of medicines which, the Spanish legislation stipulates, should be medically prescribed, but which those surveyed obtained without medical prescription: this is the case of tranquillizers and hypnotics, anti-depressants, contraceptives, hypotensives, etc. This type of self-medication is frequent among the Spaniards as far as our study is concerned, and shows that in our society the regulations dealing with the dispensing of medication are not strictly adhered to. In addition, there exists the use of over-the-counter preparations, such as certain laxatives, vitamins, analgesics and antipyretics, etc. Logically, these two types of self-medication have completely dierent consequences from the health point of view.
The increasing over-the-counter drugs and the implication for patients, general practitioners and pharmacists, have been greatly discussed in the last few years,15 and emphasis has been placed on the
need to promote adequate and proper use of these preparations.
This study is subject to certain limitations when it comes to characterizing patterns concerning medication use. Apart from the above-mentioned therapeutic groups selected, there is no informa-tion available with regard to the type of substance used, nor the reason for its prescription. Further-more, there is no knowledge of how long the sub-stance was used for, nor the doses administered. Certain of these limitations are common to other studies in the general population.16
In addition, comparison with ®gures from other countries is dicult, since in the National Health Surveys, there is either no inclusion of questions Table 1 Ð Drug use by adults: sociodemographic
characteristics
Total Male Female
(%) (%) (%)
Population size*
52000 40.8 34.0 47.2
2001±10,000 43.5 35.5 50.9
10,001±50,000 45.9 40.0 51.7
50,001±100,000 46.5 39.9 52.8 100,001±400,000 46.8 40.3 52.9 400,001±1,000,000 53.1 47.4 58.5
41,000,000 55.9 50.4 60.8
Marital status*
Single 35.4 30.6 41.7
Married 49.5 45.2 53.6
Divorcee 48.6 44.8 50.8
Widowed 74.1 62.2 76.6
Educational status*
No schooling 66.8 56.5 72.9
Primary 45.9 39.5 51.5
Secundary 37.3 33.3 42.2
High 41.4 39.4 43.8
University 42.9 41.8 44.3
Occupational status*
Work 36.8 33.6 43.8
Retired 72.5 68.9 77.6
Unemployed 39.3 33.7 46.4
Student 34.0 30.3 37.8
Housewife 55.4 38.0 55.5
regarding medication, or these refer to speci®c therapeutic groups. For example, in Canada's Health Promotion Survey,17 those surveyed were
asked if in the past 12 months they had used (i) sleeping pills (ii) pep pills, stimulants, or (iii) tranquilizers such as valium; in the 1993 Swiss
Health Survey,18 questions were asked about the
use of sleeping pills and tranquilizers in the 7 days preceding the interview. However, in the Health Survey for England,19 (a series of annual surveys
designed to monitor trends in the nation's health), as part of the nurse-visit, information was collected Table 2 Ð Class of medication used by the Spanish adult population
Medication Total Male Female Self-medication
% % % %
Antirheumatics* 4.8 2.9 6.6 6.8
Respiratory products 14.9 14.8 15.0 35.2
Analgesics and antipyretics* 10.8 8.1 13.3 45.2
Vitamins* 2.9 2.2 3.5 27.3
Cardiac therapy 3.3 3.4 3.2 5.4
Hypotensives* 7.8 5.5 10.0 6.7
Laxatives* 1.4 0.6 2.0 50.0
Alimentary tract* 3.3 3.7 2.9 16.3
Tranquillizers and hypnotics* 4.2 2.7 5.6 15.6
Antidepressants* 1.5 0.9 2.0 17.7
Antibiotics* 2.0 1.7 2.3 19.7
Contraceptives* 1.2 0.0 2.3 21.0
Antiobesity* 0.3 0.1 0.5 51.4
Antiallergic products 1.3 1.2 1.4 12.7
Cholesterol reducers* 2.6 2.1 3.1 13.2
Antidiabetic therapy* 2.3 1.7 2.8 11.8
Various* 6.0 5.0 6.8 13.9
n 21084 10176 10877
*p<0.005 (2).
Figures for self-medication (non-medical prescription) refer to each class of medication.
Please note some patients use more than one class of medication and hence the individual classes cannot be added up to reach the total.
Table 3 Ð Class of medication used by Spanish children
Medication Total Male Female Self-medication
% % % %
Respiratory products* 24.4 22.8 26.3 15.1
Analgesics 5.6 5.6 5.6 48.2
Antipyretics 4.6 4.9 4.2 18.0
Vitamins 3.1 2.7 3.5 28.4
Antiemetics 0.6 0.6 0.5 20.5
Antidiarrhoeals 0.8 0.6 1.0 26.0
Laxatives 0.1 0.1 0.1 40.0
Tranquillizers and hypnotics 0.4 0.4 0.4 29.9
Antibiotics 4.5 4.0 4.9 15.7
Antiallergic products 1.9 2.2 1.7 14.9
Various 2.7 2.9 2.6 17.0
n 5250 2686 2539
*p<0.005 (2).
Figures for self-medication (non-medical prescription) refer to each class of medication.
about any prescribed medication the respondent was taking at the time (last 7 days). The nurses recorded details of all medicines being taken from the medicine containers. The trends observed were similar to those found by us. About 38% of adults (over 16) were taking at least one prescribed medicine, and their use was related to sex and age, as well as to reported general health and reported long-standing illness or disabilities. Although there are methodological guidelines for surveys on health,20;21these are lacking in the ®eld
of medication use by the population.
Provided these limitations are recognized, it can be accepted that attempts, such as this to carry out a survey on medication use levels among the population oer important information which complements other drug utilization studies; for instance, sales and prescriptions. To give examples, such studies enable us to understand the ever-inceasing use of drugs, the sociodemograpic factors which relate to their use, the joint use of drugs and alcohol,22 the magnitude of self-medication, etc.
The freqent use of medicines has led to the need to devise strategies encouraging rational use. It is, therefore, necessary to have reliable information, not only concerning pharmaceutical needs in the community and their cost, but also regarding the use of medicines. In fact, there are few studies at general population level, like the one presented here, which oer important useful information on the use of medicines by the public.
ACKNOWLEDGEMENTS
We thank the Ministerio de Sanidad y Consumo (Subdireccion General de Informacion Sanitaria y EstadõÂsticas Sanitarias) for providing us with the 1993 National Household Health Survey compu-terized database.
REFERENCES
1. WHO Expert Committee.The Selection of Essential Drugs, Technical Report Series No 615. World Health Organization, Geneva, 1977.
2. Lee, D. and Bergman, U. Studies of drug utilization. In: Pharmacoepidemiology, 2nd edn. Storm, B. L. (Ed.). John Wiley & Sons, Chichester, 1994, pp. 379± 393.
3. CapellaÁ, D. Descriptive tools and analysis. In:Drug Utilization studies: Methods and Uses. Dukes, M. N. G. (Ed.). WHO Regional Publications, European Series No. 45, Copenhagen, 1993, pp. 55±78.
4. Bergman, U., Grimsson, A., Wahba, A. H. W. and Westerholm, B. (Eds). Studies in Drug Utilization. Methods and Applications. World Health Organiza-tion, Regional Oce for Europe, Copenhagen, 1979. 5. Haaijer-Ruskamp, F. M. and Hemminki, E. The social aspects of drug use. In: Drug Utilization Studies: Methods and Uses. Dukes, M. N. G. (Ed.). WHO Regional Publications, European Series No. 45, Copenhagen, 1993, pp. 97±124.
6. Garcia, F., Scott, A. I., Stika, L. and Westerholm, B. Health authorities and drug utilization studies. In: Drug Utilization Studies: Methods and Uses. Dukes, M. N. G. (Ed.). WHO Regional Publications, Euro-pean Series No. 45, Copenhagen, 1993, pp. 147±167. 7. Laporte, J. R., Porta, M. and CapellaÁ, D. Drug utilization studies: a tool for determining the eectiveness of drug use.British Journal of Clinical Pharmacology1983;16: 301±304.
8. Sanchez-Eznarriaga, C. and Guerra, F. J. EvolucioÂn de la prestacioÂn farmaceÂutica en el Sistema Nacional de Salud (perõÂodo 1984±1994). (Evolution of free pharmaceutical provision in the national health service (1984 to 1994 period)). Atencion Primaria 1995;16: 546±550.
9. Ministerio de Sanidad y Consumo.Encuesta Nacio-nal de Salud de EspanÄa 1993. Ministerio de Sanidad y Consumo, Madrid, 1995.
10. Nordic Statistics on Medicines 1990±1992. NLN Publication No 34. Nordiska LaÈkemedelsnaÈmnden. Nordic Council on Medicines, Uppsala, 1993. 11. Leufkens, H. G. and Urquhart, J. Variability in
patterns of drug usage. Journal of Pharmacy and Pharmacology1994;46(Suppl. 1): 433±437. 12. Baum, C., Kennedy, D. L., Forbes, M. B. and
Jones, J. K. Drug use in the United States in 1981. Journal of the American Medical Association 1984; 251: 1293±1297.
13. Woods, J. H., Katz, J. L. and Winger, G. Benzodiazepines: use, abuse, and consequences. Pharmacological Reviews1992;44: 151±347. 14. Kogan, M. D., Pappas, G., Yu, S. M. and
Kotel-chuck, M. Over-the-counter medication use among US preschool-age children.Journal of the American Medical Association1994;272: 1025±1030.
15. Editorial. Over-the-counter drugs. Lancet 1994; 343: 1374±1375.
16. Olfson, M. and Pincus, H. A. Use of benzo-diazepines in the community. Archives of Internal Medicine1994;154: 1235±1240.
17. Health and Welfare Canada. Canada's Health Promotion Survey, Technical Report. Ministry of Supply and Services Canada. Ottawa, 1988. 18. Swiss Federal Statistical Oce.Swiss Health Survey.
Swiss Federal Statistical Oce, Berne, 1994. 19. Oce of Population Censuses & Surveys. Health
20. United Nations. Guidelines for Household Surveys on Health. United Nations Department for Econ-omic and Social Information and Policy Analysis, Statistical Division, New York, 1995.
21. Third Consultation to Develop Common Methods and Instruments for Health Interview Surveys. Report on a WHO Meeting. World Health
Organ-ization, Regional Oce for Europe, and the Netherlands Central Bureau of Statistics, Voorburg, 1993 (EUR/ICP/HST 124).