Types of measures
This report addresses the state of the environment in Barcelona through eleven thematic chapters.
Each chapter defines the future vision of the city in terms of each specific theme, providing a background picture
and the current situation with a series of indicators. The
measures implemented over the past five years and which have contributed to the current position are also outlined, as are those already planned or which are ex
-pected to be applied in the near future, enabling us to
move towards our vision for the future.
The aim of this report is not to provide an exhaustive compilation of all the activities carried out but to high
-light the most significant ones over the past five years, either because this allows us to understand the current situation and how we intend to achieve the objectives set, because they have led to progress in environmental matters, because they are innovative or because they have had a big impact and led to good practices. These include original, unique and flagship measures that can
also serve as an inspiration to other cities. Maintaining
the format of the previous report, the measures are
Planning and management
Cooperation, international work and the exchange of experiences
Tools and actions in general
Improving knowledge, information, participation and empowerment
Introduction
presented in different ways, depending on the type of measure in question.
The information corresponds primarily to the activities
of Barcelona City Council, although, given many aspects
of the environment are outside the City Council’s
pow-ers, actions involving other public authorities such as the Barcelona Metropolitan Area, the Barcelona Provin -cial Council or the Government of Catalonia have also
2017 Barometer
02º 07’ 31’’ E longitude
2,607.9 hours
of sun per year41º 25’ 10’’ N
latitude9 m high
16.4 ºC annual average
22,5% foreign population
9.4 death rate (2016)
8.5 birth rate (2016)
9,065,650 tourists
19,162,580 overnight stays
4,793,592 inhabitants in the
metropolitan area (2016)
84.3 anys
life expectancy (2016)1,620,809 inhabitants
969.6 hPa on average
518 mm total
100.2 mm/day
maximum precipitation123 days of rain
17 days of storms
73% relative humidity
33.8 ºC maximum
985.6 hPa maximum
-0.8 ºC minimum
941.3 hPa minimum
158.7 inhab./ha
density
4,780 m of beaches
102,158,777 m
2of surface area
28.35 km
2of green space Territory
Climate
Social indicators
Economic indicators
Environmental indicators
19,335 €/year
disposable household income per capita47,600
GDP per capita Base 2010
17.45 m
2/inhab.
of green space799,981 tonnes
of solid urban waste (2018)42 micrograms/m
3of NO2 on average per year
2013 – 18,1 m2/inhab.
2013 – 730.285 tonnes
2013 – 40 micrograms/m3
2013 - 16.609 GWh
2013 – 36,2%
2013 – 24 micrograms/m3
2013 – 108,4 l/inhab./day
15,614 GWh
total power consumption (2016)
36%
selective waste collection
25 micrograms/m
3 of particles (PM10) on average per year108.3 l/inhab./day
domestic water consumption8.2 million
journeys per day64,2% internal journeys
74,4% ecomobility (public transport + bicycle + on foot)
83,1%
ecomobility 59% ecomobility Public transport
Bicycle On foot Private vehicle
35,8% connecting journeys
19.2%
at risk of poverty
11.6%
unemployment rate91.2%
finish secondary education (2015-2016)80.2%
activity rate (4th quarter)85.4%
homes with Internet accessContents
Energy and climate change mitigation
6
Resilience and adapting to climate change
19
Mobility and urban transport
32
Urban greenery and biodiversity
47
Local air quality
77
Sustainable land use
63
Acoustic quality 89
Waste prevention and management
100
Water Cycle
115
Co-responsibility
143 Greening municipal
activities
Barcelona tackles climate change
7 Summary infographic
8 1.1 Vision, challenges and opportunities
9 1.2 General context and current situation
9 1.2.1 Reduction in energy consumption, despite current stabilisation
10 1.2.2 Continued growth in the generation of local renewable and residual energy
11 1.2.3 Reduction of emissions throughout all sectors
11 1.2.4 More climate change, more energy poverty, more climate justice
12 1.3 Measures adopted to move towards the energy transition and mitigate climate change
12 1.3.1 Commitment and planning in the transition towards carbon neutral cities
13 1.3.2 Tools for facilitating the rational use of energy in buildings, homes and public space
15 1.3.3 Promoting the generation of local, green energy
15 1.3.4 Extending the energy culture to involve citizens in the change
17 1.4 Future goals and measures
Energy and climate
Energy and
climate
change
mitigation
Vision of the
future
Becoming
a carbon
neutral city
Final energy
consumption
(2016)
15,614
GWh
CO
2-e
emissions
Commitment to becoming a carbon neutral city “Adhesion to the
Covenant of Mayors for Climate & Energy” “Climate Plan” “Barcelona Climate Commitment”
Energy saving and efficiency “Home renovations” “Renewal of lighting” “Electric vehicles”
Generation of renewable, local energy “Public
electricity distributor” “Solar generation for municipal buildings and public spaces”
Energy culture “Citizen
climate projects” “Map of energy resources” “Energy advice points” “Energy saving marathon”
Current
situation
Lines of
action
9.71
MWh per capita
2012
2.08 %
20162.65 %
Self-sufficiency
2012
2.28
tCO
2-e
per capita2016
2.18
1.1 Vision, challenges and opportunities
Vision of the future
Barcelona wants to become a carbon neutral city by 2050 and, as part of this transition, it has set the goal of reducing greenhouse gas (GHG) emissions per capita between 2005 and 2030 by 45%. To this end, the city is promoting its own energy model based on savings, efficiency and harnessing renewable, local resources to pro-gress towards self-sufficiency and energy sovereignty, reducing its external energy dependency and improving the environmental qual-ity of the urban area. Furthermore, it places residents at the centre of energy and climate change policies and provides them with more de-cision-making capacity and power, particularly in terms of self-suffi-ciency.
In the transition towards a sustainable energy model that makes it possible to mitigate climate change, Barcelona has harnessed the opportunities provided by certain aspects inherent to the city, such as its mild climate, but it still faces outstanding and emerging
challenges.
Barcelona, a compact, dense and Mediterranean city. On the one hand, these characteristics facilitate low ratios of energy consumption per inhabitant compared to other cities. On the other, given the lack of large spaces, the use of roofs and terraces is key in generating renewable, local energy.
The low renewability of Barcelona’s energy mix. Almost all the primary energy consumed in the city is from fossil or nuclear
fuels, and renewable energy accounts for just 7.83% of all energy. This energy model therefore has obvious limits: economic (high energy prices, existing limitation on resources), social (inequality and energy poverty) and environmental (air pollution and GHG
emissions that cause climate change) limits.
Emissions remain high. Total energy consumption and GHG emissions in Barcelona have decreased in recent years, in large part due to the economic crisis and the increase in energy prices. However, as the 2015 and 2016 data shows, energy consump
-tion and the genera-tion of emissions have increased again as a result of the economic recovery and, in particular, on account of the upturn in mobility, a trend that is expected to increase in the coming years. There is therefore a need to spread a new energy
culture that uncouples economic growth from energy consumption.
Climate justice: more vulnerable individuals and more energy poverty. Climate change and its effects can lead to an increase in the price of basic supplies and change energy and water consumption patterns, which may enhance vulnerability in terms of energy poverty. In addition, given the demographic and socio-economic dynamics in the city, the vulnerable population is expected to increase because there will be more households with dependent children and more single-person households, while migratory movements will grow and the ageing process will be more evident.
Municipal action in terms of energy is limited. Given the framework of local government powers, municipal action is fo
-cussed mainly on aspects related with local energy management (promoting energy saving, energy efficiency and demand man
1.2 General context and current situation
For many years Barcelona has worked to combat and respond to the effects of climate change. Efforts have therefore been made to adopt international and local
commitments such as approving strategic measures
and plans that seek to mitigate the effects of climate
change.
With the Barcelona Energy, Climate Change and Air Qual
-ity Plan (2011-2020) X , the city established a roadmap to reduce GHG emissions by 23% per capita between 2008 and 2020. The Climate Plan goes even further and seeks to reduce emissions by 45% per capita by 2030. However, to achieve this objective we need to reduce
energy consumption further still and minimise fossil fuel
dependency, as only 7.83% of the primary energy con
-sumed in the city is from renewable sources. Thus, the energy transition towards clean, renewable and local en -ergy sources is essential.
1.2.1 Reduction in energy
consumption, despite current
stabilisation
Final energy consumption in Barcelona has decreased by
19% in recent years, from 19,263 GWh in 2005 to 15,614 GWh in 2016, returning to the 1999 value of 15,943 GWh. However, it is worth pointing out the increase between 1999 and 2005, when consumption levels peaked. The economic crisis and the rise in energy prices have contrib -uted in a large measure to the implementation of ener-gy-saving actions and good practices previously not
con-sidered. This shows there is a clear correlation between energy consumption and the socio-economic context.
The evolution of energy intensity in Barcelona
demon-strates that the city has been capable of consuming less energy per euro generated, from 261.56 Wh/€ in 1999, to
10.000
4,00
2000
1999 2001 200220032004200520062007 200820092010 2011 2012 201320142015 2016
0 0,00 12.000 6,00 2.000 14.000 8,00 4.000 16.000 10,00 6.000 18.000 12,00 20.000 14,00
Total emissions (thousand tonnes CO2-e) Emissions per capita ( tonnes CO2-e/inhab.) Total consumption (GWh)
Consumption per capita (MWh/inhab.)
8.000 2,00 Energy consumption and emissions G W h a nd t ho us an
d t
205.19 Wh/€ in 2016. Furthermore, there have been signs
that energy consumption and economic growth are not
as closely associated as they used to be.
Likewise, it is expected to increase in the coming years on account of the economic recovery. In fact, energy consumption increased again in 2015 and 2016, reach
-ing 15,842 GWh and 15,614 GWh, respectively. There is
therefore a need to spread a new energy culture that uncouples economic growth from energy consumption.
The sectors that consumed most energy in the city (2016)
were commerce and services (34.02%), followed closely by the transport (27.30%) and domestic (27.17%) sectors, then industry (10.85%) and other sectors (0.65%).
Fossil fuels accounted for 67.81% of the total primary en
-ergy consumption in 2016, nuclear for a further 24.36%
and renewables for just 7.83%. As regards the form, 41.23% of the energy consumed in Barcelona was elec
-tricity, 30.62% natural gas, 27.29% automotive fuel and 0.86% liquefied petroleum gas (LGP). With regard to the source of electricity, 56.29% of what we consume comes from nuclear power, 25.62% from fossil fuels and the re
-maining 18.09% from renewable sources.
A total of 27,624 GWh of primary energy were required to provide the 15,614 GWh of final energy that Barcelona consumed in 2016. That means only 57% of the primary energy was transformed into useful final energy. Or, to put it another way, 43% of the primary energy was lost in generation and transport. Therefore, we also need to increase the efficiency of these processes with more suit
-able technologies, an aspect that directly depends on the big power stations.
1.2.2 Continued growth in the
generation of local renewable and
residual energy
In 2016, 413.37 GWh were generated using renewa
-ble sources and harnessing local residual energy. This amount of energy accounted for 2.65% of all energy consumed in the city that year (15,614 GWh). However, this is not enough: the energy self-sufficient index has grown significantly since 2003 and each year it grows
even more.
The main source of renewable and residual energy is the recovery of solid urban waste at the Sant Adrià de Besòs plant (53.0%) and thermal solar power (20.1%).
Total primary energy consumption in 2016
Fossil fuels 67,81%
Nuclear
24,36%
Renewables 7,83%
Hydropower and other renewables 4,65%
Wind
2,48%
Solar
0,45%
Municipal and industrial waste
Currently, Barcelona has photovoltaic generation sys
-tems in public buildings and on pergolas and dividing walls, which means an installed power of 2,078 kWp that generates almost 2,570 MWh/year, equivalent to the consumption of 1,116 households and a saving of 825
tonnes of CO2-e emissions.
1.2.3 Reduction of emissions
throughout all sectors
In 2016, Barcelona emitted a total of 3,512,512 tonnes
of CO2-e, which comes to 2.18 tonnes of CO2-e per
capita, well below the emissions recorded in 1999,
which came to 3.20 tonnes of CO2-e. From then on, there was an upward trend until 2005, when it reached
3.14 tonnes of CO2-e, after which we saw the start of a
downward trend.
These emissions are mainly generated by the trans
-port sector (30%), followed by the commerce and ser
-vices sector (19%) and the domestic sector (19%). The remainder is split between the port and airport (13%), municipal waste treatment (10%), industry (8%) and
others.
However, since 1999, emissions in the various sectors
have not followed the same trend. While they have
in-creased in the commercial and service sectors (above
all due to the increase in the share of tourism
consump-tion and commercial activity linked to that), they have remained very stable in the domestic and transport sec
-tors, while falling in industry.
1.2.4. More climate change, more
energy poverty, more climate justice
Currently, 10.6% of Barcelona’s population suffers from energy poverty, which translates to around 69,500 homes. That means 9.4% of the population cannot main
-tain their household at an adequate temperature during the cold months, while 14.5% say they are behind with utility payments and 9.2% say the have leaks and damp
in their home.
Furthermore, it is expected that climate change will see an increase in the cost of water, energy and foodstuffs, which will make access to these basic resources even more difficult. Given the demographic and socio-eco
-nomic dynamics in the city, the vulnerable population is also expected to increase because there will be more
households with dependent children and more
sin-gle-person households, while migratory movements will grow and the ageing process will be more evident.
As a result, these factors may lead to an increase in energy poverty and make the situation worse. Climate justice must therefore be encouraged and the most vul
-nerable placed at the centre of climate policies in order to ensure everybody can keep their homes at a healthy temperature (18-20ºC in winter and 25ºC in summer) and has access to minimum amounts of drinking water
(100 litres per person per day). Transport
30,6%
Services
19,5%
Domestic
19%
Port and airport 12,6%
Municipal waste treatment
9,9%
Industry
8,1%
Other
0,3%
1.3 Measures adopted to move towards the
energy transition and mitigate climate change
Barcelona, on the way to becoming a carbon neutral city, has implemented energy saving and efficiency measures, promoted renewable, local energy genera
-tion and encouraged public participa-tion.
1.3.1 Commitment and planning
in the transition towards carbon
neutral cities
Adhesion to the Covenant of Mayors for Climate & Energy
On 31 March 2017, Barcelona adhered to the new cov -enant that merged previous European climate change
mitigation and adaptation initiatives, known as the Cov
-enant of Mayors, signed in 2008, and the Mayors Adapt,
signed in 2014.
Following its adhesion, Barcelona City Council has been
committed to reducing greenhouse gas emissions per
capita 40% by 2030, compared to 2005, and draw up a sustainable energy and climate action plan (SECAP). However, on account of the Catalan Climate Change Act,
Barcelona has gone even further and committed to
re-ducing its emissions by 45%.
Beyond the European Union, the two main global initia
-tives at a city and local government level have been com
-bined to make progress with the transition towards a low-carbon and climate-resilient economy, and demon
-strate the global impact of local action: the Compact of Mayors, signed in 2015 and the Covenant of Mayors. Bar
-celona signed up to the Global Covenant of Mayors for Climate and Energy in 2016, and has recently obtained the stamp of absolute approval in terms of all objectives.
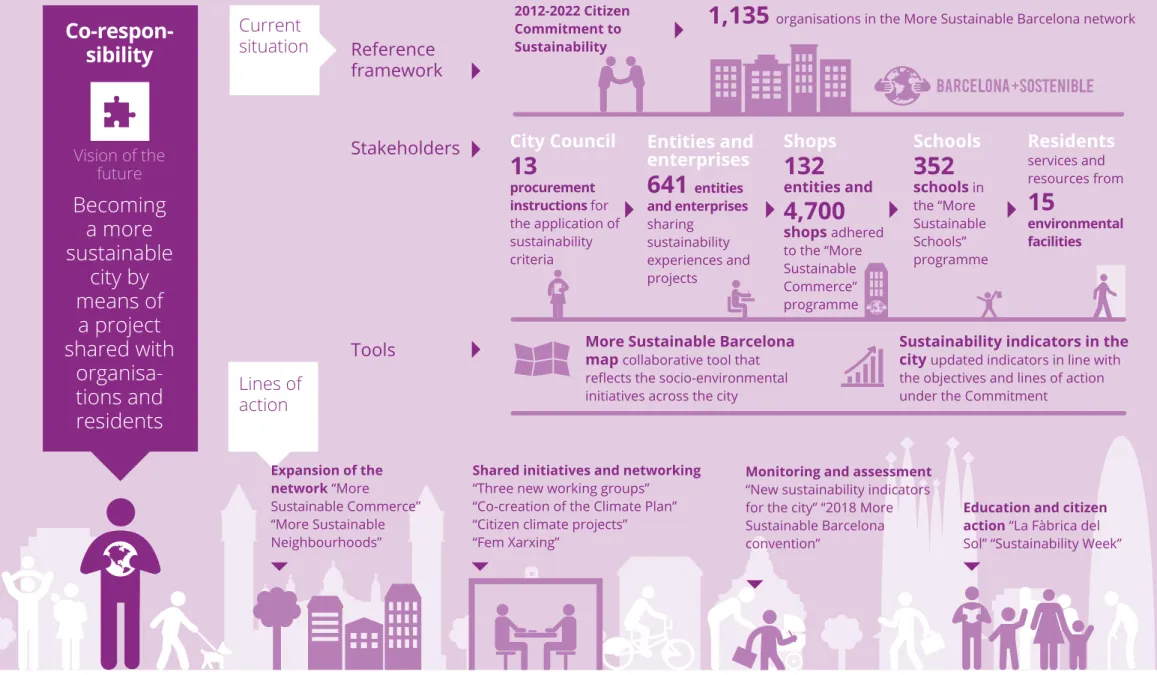
Barcelona Climate Commitment
Coinciding with the Paris United Nations Climate Change Conference, at the end of 2015 Barcelona presented its
collective action commitment X, supported by more than one thousand companies, citizen organisations and schools associated with the More Sustainable Bar
-celona network and the City Council itself, to help re -duce emissions and adapt to climate change with the
following targets for 2030:
With regard to mitigation, to reduce levels of CO2-e by 40% per capita compared to the levels of 2005.
With regard to adaptation, to increase the urban green space by 1.6 km2, in other words, 1 m2 per resident.
Transition to energy sovereignty
In 2016, Barcelona presented the government measure “Transition towards Energy Sovereignty” X , as part of which it set out its commitment to making progress to
-wards all energy being renewable, with zero emissions and democratically accessible to everybody.
This energy transition is based on implementing energy saving and efficiency measures, such as building reno
-vation; measures to increase local, renewable energy generation, such as taking advantage of roofs and roof terraces; and measures to ensure energy supplies, such as setting up a public electricity distributor. Actions have also been established to promote the energy culture amongst the players involved and educate the public to
get them involved in the change.
1.3.2 Tools for facilitating the rational
use of energy in buildings, homes
and public space
Housing renovation grant programme
As part of the 2016-2019 Urban Renovation Strategy,
the 2017 call for housing renovation grant applications promoted actions aimed at power generation and
ener-gy saving, subsidising up to 60% of the cost of installing photovoltaic or thermal solar panels and 50% of the cost
of actions to improve energy overall. Along the same
lines, the 2018 call promoted actions aimed at increasing energy efficiency and energy production, with grants of up to 50%.
Plan for Energy Saving and Improvements in Municipal Buildings (PEMEEM)
Energy consumption associated with municipal build
-ings and facilities accounts for 56% of the consumption associated with municipal activities (282 GWh/year). So taking action there is key. Actions to reduce energy con
-sumption, increase energy efficiency and include renew
-able energy in municipal buildings are included in this
plan.
The PEMEEM also monitors public space development projects to ensure they take advantage of local renewa
-ble and residual energy sources.
2018 -2020 Comprehensive Lighting Renovation Plan
In recent years, efforts have been made to improve light
-ing levels, energy efficiency and functional intelligence. Electricity consumption by the public lighting system has decreased by focussing on 10% of the system, which translates to around 13,000 light points and promoting autonomous lighting, which generates its own electrici
-ty. Traffic lights have also been replaced and the network has been renovated by installing LED technology. Under this new plan, work is planned on 200 streets and 10,000 new LED lights are due to be installed, which represents energy saving of approximately 3,620 MWh/year, equiv
-alent to the electricity consumption of 1,550 families.
Vehicle energy diversification
Barcelona City Council is committed to vehicle energy
diversification and, more specifically, the use of electric vehicles in the city. To that end, Barcelona has 450 free public charging stations, of which 125 are specifically for motorbikes and 17 are fast charging stations. Likewise, free parking is also available in green and blue zones for electric vehicle users in addition to a 75% rebate on motor vehicle tax.
This commitment is reflected internally in the council’s own fleet: 24% are electric vehicles (703), 20% are gas powered (584) and 7% are hybrid (208). That means 51% The measures implemented in 2017 generated
of the total fleet is made up of low-emission vehicles. As regards the city’s buses, 35% run on natural gas, 19% are hybrid and 4 are electric (2018 data).
Technical instructions for the application of sustainability criteria
As part of the “More Sustainable City Council” pro
-gramme, in 2015 the Council drew up 12 sets of technical
instructions X that must be followed in the acquisition
and procurement of groups of goods and services
de-fined as priorities, in response to and in compliance with the Government Measure on Responsible Public Pro -curement with Social and Environmental Criteria (2013).
The following environmental criteria have also been es
-tablished with regard to energy:
100% of electricity supplied must be certified as green
electricity with a guarantee of origin.
For organising events, criteria have been established to promote sustainable mobility and energy efficiency.
For public works projects, both in public spaces and construction, maximum energy self-sufficiency crite
-ria have been established. In the case of buildings, cri
-teria have been established in accordance with an en
-ergy protocol so that all new municipal buildings and large-scale renovations must be designed to consume low amounts of energy (minimum demand) and max
-imise generation. In the case of public spaces, both new developments and redevelopments, minimum demand is required for power consuming elements
(minimum consumption) and power generating
ele-ments, such as solar panel pergolas, must be included as far as possible provided that resources are availa
-ble.
As regards vehicles, procuring electric vehicles has been made a priority.
First Barcelona energy saving marathon
In February 2018, a total of 47 public buildings and in
-frastructures in Barcelona took part in the first energy
saving marathon X to make people more aware of the
need to reduce energy consumption under the “More
Sustainable City Council” programme and the Plan for
Energy Saving and Improvements in Municipal Buildings.
Thanks to the actions carried out over the course of the month, such as using half the volume of toilet tanks, tak -ing stairs instead of us-ing lifts or sett-ing a heat-ing
sys-tem sys-temperature in advance, participating infrastruc
-tures and buildings managed to reduce gas expenditure by 20.21%, water expenditure by 14.77% and electricity expenditure by 5.74%. This is equivalent to the monthly energy consumption of 1,083 four-person families and
almost two Olympic swimming pools.
1.3.3 Promoting the generation of
local, green energy
Creating a public electricity distributor
Barcelona Energia X has supplied 100% renewable en
-ergy from nearby sources (with a certificate of origin) to the City Council’s buildings, infrastructures and facilities and those of its dependent bodies, in addition to the city’s public lighting system, since July 2018. From 2019, facilities
in the Barcelona Metropolitan Area and the residents of the city and the Metropolitan Area as a whole are also due
to be offered this service, covering up to a maximum of 20,000 homes.
Programme to promote solar power generation in Barcelona
In order to achieve the objective of doubling solar power generation in municipal buildings and increase private generation by 10%, as established in the “Transition to
-wards Energy Sovereignty” measure, the Programme to Promote Solar Power Generation in Barcelona sets out activities to be performed between 2017 and 2019. They focus on putting solar panels on public and private roofs and terraces across the city and in public spaces, on converting or installing urban features that can be converted into power generators, through public and
There are currently around 60 municipal buildings with
photovoltaic generation systems and 16 pergola
gener-ators have been installed in parks and squares. Solar power systems have also been installed in sports facil
-ities such as Can Ricart and Can Caralleu. In addition, 10 more infrastructures are being installed on existing buildings and a further 17 are about to be tendered.
The Map of photovoltaic energy generation X in
mu-nicipal buildings and spaces makes it possible to con
-sult municipal buildings, pergolas and dividing walls that generate solar power, in addition to the energy they pro
-duce, the number of homes they are capable of power
-ing, CO2-e savings, etc.
1.3.4 Extending the energy culture
to involve citizens in the change
City residents climate projects
As a result of the Barcelona Climate Commitment, teams comprising different organisations participating in More Sustainable Barcelona were created, with a view to im
-plementing citizen projects that promote the reduc
-tion of GHG emissions, the city’s adapta-tion to climate change and climate justice. The new projects associated with the Commitment are:
E4: Plug into energy saving and efficiency
Passive reform and active awareness for combating
energy poverty
Mosaic roofs. Making our roof terraces sustainable
Safe school paths
Cycling to work Green Point 2.0 Sarrià zero waste
Let’s Stand Together Against Climate Change
#CompromísPelClima campaign
To continue stimulating citizen action, a call for subsi
-dies for citizen projects that fight climate change was launched in 2018. These subsidies seek to support pro
-jects that promote mitigating and adapting to climate
change and provide them with funds through energy
efficiency and saving actions, increasing the use of re
-newable energy, sustainable mobility, agricultural and green spaces, waste prevention, etc. and that contribute
to achieving the Commitment goals.
A total of 49 projects were submitted to this first call, with the 11 most noteworthy receiving total subsidy of €200,000.
Energy resource map
Many of Barcelona’s buildings have suitable conditions for installing power generation equipment on their roof terraces. To raise awareness of all this potential, the
City Council has created the Barcelona energy resource
map X , where it is possible to consult energy potential based on the resource in question (photovoltaic solar,
thermal solar or mini wind) and information is provided
on the potential power that can be generated, savings
in terms of greenhouse gas emissions and the
estimat-ed installation cost. Thus, people can consult the ener
-gy resource that would be best suited to their roof. The Practical Self-Consumption Installations Guide X has
also been published.
Creation of energy advice points
Barcelona has ten energy advice points (PAEs) X spread
across the city. These points offer the information, assis
-tance and advice needed for people to exercise their en
-ergy rights. In addition, advice is offered to the general
public on processing social bonds, grants for improving energy efficiency in the home and cutting utility bills.
Tools and resources for increasing the energy culture
As part of the “Carrega’t d’energia” X programme, the
Council has set up a virtual tool to calculate how much energy is consumed in the home and how to reduce
consumption and improve energy efficiency in the home: the energy calculator X . The Fàbrica del Sol environmental education centre also holds workshops to educate the public on the energy transition, such as “Breaking down gas and electricity bills”, “Measures for improving energy in the home” and “Renewable energy
in the home”.
1.4 Future goals and measures
In response to the commitment the city made by adher -ing to the Covenant of Mayors for Climate & Energy in
2017, Barcelona has drawn up a Climate Plan X , a new roadmap to tackle climate change up to 2030.
2018-2030 Barcelona Climate Plan
To analyse the future evolution of energy consumption
and emissions in Barcelona to 2030, two scenarios have been defined: the trend scenario, which takes into ac
-count the expected performance of different contextual factors (population, GDP, mobility, distribution and up
-date of the mobile park, etc.) and the electric mix pro
-posed by the Catalan Climate Change Act; and the action scenario, which also takes into account the application of Climate Plan measures.
In the trend scenario, energy consumption is expected to increase by 0.14% per year. However, given the expected increase in population, it is expected that consumption per inhabitant will reduce from 9.71 to 9.52 MWh/inhab. In contrast, by applying the Climate Plan measures it is hoped that consumption per inhabitant will be reduced by 29.48%, which is equivalent to an annual fall in energy consumption of 2.46%.
In terms of emissions, the trend scenario takes into ac -count the decommissioning of nuclear power plants and
a significant increase in renewable energy, as established by the Catalan Climate Change Act. This would result in
the emission factor associated with electricity generation
increasing and GHG emissions growing by 17.70% to 2.52
tonnes CO2-e/inhab. In 2030. In contrast, by applying the Climate Plan actions, it is expected that per capita emis
-sions will be reduced by 18.22% compared to the figures recorded for 2016 (and 45% compared to 2005).
By applying the measures set out in the Climate Plan, it will be possible to break the present consumption and emis
-2045 2040
2035 2050
2005 2010 2015 2020 2025 2030 4
3
2
1
tCO
2
-e
/in
hab
./y
ear
3.14
2.14 2.52
2030
50% Renewables
-27% less energy consumption
2024-2027
Closure of nuclear stations
1.75
1.75
In the action
scenario, we
achieve the reduction targets 20 years earlier than in the trend
scenario 0.62
Trend
sion dynamic and reach 2050 with neutral levels. If the
Climate Plan is not implemented, in 2050 the trend sce
-nario would put us in the situation we foresee being in by rolling it out in 2030. In other words, we advance 20 years. Also, not implementing the Plan would mean the efforts required would be greater, more costly and less fair.
The Climate Plan establishes strategic goals and measures in the short-term (2018-2020) and in the medium to long term (2021-2030) structured around four strategic pillars: mitigation, adaptation and resilience, climate justice and promoting citizen actions. To achieve these, the Plan fea
-tures eighteen lines of action divided into five different areas:
People first: the well-being of residents.
Starting at home: improving efficiency in buildings.
Transforming communal spaces: transforming
public spaces into healthy, biodiverse, efficient and in -clusive settings.
Climate economy: uncoupling the quality of people’s lives from economic growth, with a circular vision that makes the most of resources and avoids generating
waste and emissions.
Building together: in collaboration with an informed, critical, proactive and empowered citizenry.
In terms of energy and mitigation, joint action seeks to make Barcelona a completely carbon neutral city by 2050 and reduce GHG emissions per capita by 45% compared to 2005 by:
Reducing travel by private motor vehicles by 20%.
Increasing solar power generation fivefold.
Carrying out energy renovation in 20% of residential buildings that are more than 40 years old and renovat
-ing 94,000 homes, prioritis-ing those belong-ing to vul
-nerable families and those at risk of social exclusion.
Reducing the 7% of GHG emissions associated with the energy consumption of municipal buildings and
facilities.
Procuring 100% low-carbon public transport buses, taxis and municipal fleets by 2025.
Having 95% of the population at less than 300 m from a bike lane by 2018.
Saving 130,000 tonnes of CO2-e in the collection and treatment of waste.
The Plan also sets the target of zero energy poverty and achieving 100% of net financing.
To achieve these goals, the Plan defines energy saving, effi
-ciency and self-generation measures in buildings, facilities and developed spaces; low-emission transport and mobil
Barcelona adapts to the risks and
impacts of climate change
20 Summary infographic
21 2.1 Vision, challenges and opportunities
22 2.2 General context and current situation
22 2.2.1 What will Barcelona’s climate be like in the future? 23 2.2.2 The main effects of climate change on Barcelona
24 2.2.3 Other impacts that climate change has
25 2.2.4 The Barcelona resilience model
26 2.3 Measures implemented to make progress on resilience and adapting to climate change
26 2.3.1 Improving knowledge and governance
27 2.3.2 Working with city networks to exchange experiences
27 2.3.3 Planning to minimise impacts caused by climate change
29 2.3.4 Progressing with the Climate Plan in terms of rolling out adaptation actions
30 2.4 Future goals and measures
Resilience
Current
situation
Main
challenges
Climate change
Main
impacts
Planning “Climate
Plan” “Urban resilience strategy”
Adaptation
“Climate refuges”
Lines of
action
Resilience
and
adapting to
climate
change
Vision of the
future
Becoming a
resilient city
capable of
overcoming
current
and future
challenges
Minimising the impacts of climate change
“Protocol for heat waves” “Guaranteed supply of resources” “Flood management” “Conservation of vulnerable species”
+ 1.6 ºC
by 2050+ 1.7 ºC
by 2100- 14 %
rainfall Sea level
+ 46-115
cm by 2100Heat waves Committed scenario
Heat island effect
Droughts Floods
Fires Shrinking beaches
Worse air
quality consumption patternsChange in energy biodiversityLoss of
+ 2 ºC
by 2050+ 3 ºC
by 2100- 26 %
rainfall
Sea level
+ 64-133
cm2.1 Vision, challenges and opportunities
Vision of the future
Barcelona wants to become a resilient city, capable of facing current and future challenges and reducing its vulnerability in
all aspects affecting its citizens’
lives. It wants to be a proactive city
that anticipates risks to ensure the city’s functionality and improve its response capacity.
To achieve this, the risks posed by the main challenges faced by the city must be analysed. These chal-lenges may be socio-economic (lack of access to housing, impact of tourism, etc.), technological (guaranteed supply of basic ser-vices, outages in the distribution network, etc.) or natural (torren-tial rain, droughts, etc.). Within the last category, the impact of climate change on the city must be
identi-fied and adaptation measures de -signed, in particular nature-based
Managing the resilience and adaptation to climate change of a complex urban system like Barcelona involves overcoming challenges
but also presents opportunities.
Barcelona has been working on becoming a resilient city for years. The city’s approach to urban resilience has evolved over many years. Initially, plans and projects were defined for specific fields, without permanent instruments for intersectoral coordination. However, after observing a series of critical scenarios (particularly in terms of infrastructures and services), cross-cutting work with all the players involved (in the public and private sectors) and a holistic, systemic vision of the city was identified as a key objective.
Cities are extremely vulnerable to these risks as a result of high density populations and the related services. Specifically,
Barcelona has become one of the economic drivers of southern Europe and it is the heart of one of the most populous metropolitan
areas on the continent. That, added to an economy that is heavily geared towards the service sector, has led to a high occupation of space, putting a burden on urban services and posing significant challenges as regards ensuring the city’s functionality, as well as the security and quality of life of people living in and visiting the city.
Barcelona is at considerable risk on account of its geographic location. Barcelona’s population is exposed to different extreme climate impacts that are a feature of the Mediterranean climate (droughts, heat waves, flooding) but made worse by climate change. The large green space of Collserola will be affected by the increased risk of forest fires and drought, which, in turn, may compromise the guaranteed supply of water, which is basic for the city to function, as well as maintaining its green infrastructure and environmental services, among other things.
Heat affects the most vulnerable population. Climate change does not affect everybody in the same way: disadvantaged groups and the homeless are particularly vulnerable to its effects. More specifically, the elderly are most at risk. It is particularly important to keep this in mind as the number of elderly residents in the city is gradually growing. Likewise, the death toll amongst infants aged under one increases by 25% on days of extreme heat.
2.2 General context and current situation
Urban resilience is the capacity of a city to prevent, or, when faced with unavoidable situations, minimise the impact of natural and anthropic dangers it is exposed to, whether they be regular episodes or stressful situa-tions spread over time, and recover in the shortest pos-sible time, in order to maintain its essential functions. In that regard, increasing Barcelona’s resilience will be key as regards adapting to the effects of climate change, in
addition to other risks.
2.2.1. What will Barcelona’s climate
be like in the future?
Based on research conducted by the AMB, Barcelona Regional and the Catalan Meteorological Service have analysed how the climate in the region will change and what effects this will have on the city. This analysis has focussed on two possible scenarios:
A more committed scenario (RCP4.5) in which the 2015 Paris Agreement emission reduction targets are achieved. The concentration of GHGs would be higher than now at the end of the century but the increase would be reduced from 2030 onwards, in order to re-strict the maximum rise in the overall temperature to 1.5 - 2 ºC.
A more passive scenario (RCP8.5) which represents a situation in which the targets set in Paris are not reached, so the GHG concentrations at the end of the century would be much higher than present levels. The increase in global temperature would be considerably higher than 2 ºC.
Barcelona currently has an average annual tempera-ture of 17.6 ºC. If the projected increases in temperatempera-ture caused by climate change prove correct, Barcelona may experience a 1.6 ºC increase in average annual temper-ature by the middle of the century and 1.7 ºC by 2100, in the case of global emissions being reduced in accord-ance with the Paris agreements (committed scenarios). This forecast could get worse if the current levels of emissions continue (passive scenario), producing a 2 ºC temperature increase by the middle of the century and 3 ºC by the end of the century.
Passive scenario
Committed scenario
Committed scenario
Passive scenario
17.6ºC
2015
2015 600 mm
2050 2100
+1.6ºC +1.7ºC +2ºC
+3ºC Rise in
temperature
Fall in rainfall
CO2
CO2
CO2
CO2
2100 -14%
2.2.2. The main effects of climate
change on Barcelona
The biggest climate change challenges that Barcelona will have to face are:
Rising temperatures. In Barcelona, a heat wave is considered to be a situation where maximum temper-atures exceed 33.1 ºC for three or more consecutive days. By the end of the century, in both the committed and passive scenarios, there is expected to be an in-crease in the days and nights with high temperatures and there are expected to be more heat waves, which will be more severe and last for longer.
Based on the most recent heat waves (2012 and 2015), the effect of the increase in temperature, which af-fects the city’s neighbourhoods differently, has been studied and cross-referenced against the vulnerability associated with risk parameters (population aged over 75, energy performance of buildings, lack of vegeta-tion and insufficient training). According to the map, the city areas most vulnerable to heat waves would
be the district of Nou Barris and some parts of the
Sants-Montjuïc, Les Corts and Eixample districts.
Reduced availability of water. The potential effect of climate change on the water cycle is a slight decrease in water resources and, in particular, a more significant variation in the availability of resources, increasing the
Heat wave
Hot day
Torrid day
Tropical night
Torrid night
Today (committed scenario)2100 (passive scenario)2100
1
heat wave every 4 years
22
hot days a year
1
torrid day a year
38
tropical night a year
1
torrid night a year maximum
temperatures
> 33.1ºC
3 or more
consecutive days
>30ºC
>35ºC
>20ºC
>25ºC
2
heat waves a year
50
hot days a year
x2
x5
x4
x17
x3
x6
x2
x2
2,5
torrid days a year
83
tropical nights a year
2,5
torrid nights a year
4-5
heat waves a year
80
hot days a year
8,5
torrid days a year
112
tropical nights a year
6
frequency of both droughts and flooding. A reduction of 12% in surface resources and a reduction of 9% in underground resources are forecast by 2050. On the other hand, it is estimated that demand for different city uses will increase by 4%. There will therefore be an additional need for water, estimated at 18 hm3/year in
Barcelona.
Increased risk of floods. It is expected that climate change will have two effects that may have an impact on the city’s flood potential: the change in rainfall, with an increase in intensity and more extreme rainfall events, and an increase in sea level, which may affect the functionality of the sewage system in the event of extreme events. Given these impacts and the cur-rent level of impermeability, the system is expected to overflow at some points under both future scenarios. Based on three factors (capacity of the sewage sys-tem, slope of the terrain and basin area), the areas most at risk of flooding have been identified as Poble-nou, Eix de la Diagonal, Sant Andreu, Badal and Sant Antoni.
Shrinking beaches. Given the increase in sea level
and the frequency of extreme events, an increase in flooding is forecast along with morphological changes to the beaches and a greater exposure of port infra-structures. By 2100, the increase in the sea level on our coast is expected to remain at 0.46 m under the
committed scenario and 0.64 m under the passive sce -nario. If we take into account the effect of the tide and changes in the wind and atmospheric pressure, the
val-ues would be 1.15 m and 1.33m respectively. This may lead to all the city’s beaches shrinking. In some cases, such as Sant Sebastià, the beach may almost disap-pear, whilst others would suffer reductions of 30-46%
in their surface area.
2.2.3. Other impacts that climate
change has
The impact of climate change has also been analysed with regard to the following aspects:
Air quality. The projections made so far show an
in-crease in the annual concentration of the three pollut -ants analysed. PM10, NO2 and O3. The increase in the
number of days of high concentration would be most significant in terms of PM10 particles (up to 41% in the committed scenario and 60% in the passive scenario).
In terms of NO2, the increase would be average in both scenarios (22%), with the impact most noticeable in
the summer months. The increase in O3 is expected to be low, 12-13%.
Heat island effect. Currently, the most intense and most frequent urban heat-island effect in Barcelona occurs at night and during winter. Urban monitoring stations register temperatures up to 3ºC (annual aver-age) higher than those outside the city but differences of as much as 7 to 8ºC have been observed. Climate change will intensify the heat-island effect, as it will
increase exposure to episodes of high temperatures and heat waves, with more serious consequences. To mitigate this effect, increasing greenery is essential on account of its thermal regulating role.
Energy flows. If we take all the sectors into account and consider there will be no variation as a result of
climate change, Barcelona would be capable of reduc-ing energy consumption by 6.7% in the committed scenario and 7.3% in the passive scenario. Despite the overall reduction, a change in the public’s
con-sumption patterns is forecast with an increase in the
demand for electricity, mainly due to the need for air conditioning linked to episodes of high temperatures as well as new consumption linked to e-mobility.
Forest fires. Climate projections show there will be an increased fire risk in the Mediterranean region. Around Barcelona, there are other factors associat-ed with human activity, urbanisation processes and changes in land use that bear the main responsibility for fires. Given the rise in temperatures and reduc-tion in rainfall caused by climate change, leading to increased water stress and more highly combustible, there will be an increase in fire risk. The areas with the biggest risk of fires are mainly on the Barcelona side of Collserola (Vallvidrera, Tibidabo i les Planes, Horta, Canyelles and Torre Baró).
Impact on infrastructures. After the beaches, the sanitation and transport systems are the infrastruc-tures that could be most affected by increased flood-ing risks (river, urban, due to a rise in the sea level or sea storms) or fires.
2.2.4. The Barcelona resilience
model
Barcelona has been actively working on becoming a more resilient city since 2009, when it began to imple-ment projects to reduce the weaknesses detected in
infrastructures and urban services. These weaknesses
were made particularly evident in 2007 as a result of a series of critical risks (risk of extreme drought, outages in train services, power outages, etc.) by the resilience committees. Organise in sectoral working groups,
resil-ience committees develop specific projects to reduce the weaknesses identified. Each improvement project, in addition to defining goals and an action plan for achieving them, must establish a monitoring and im-provement system to assess the corresponding degree
of achievement.
The work done has generated a working methodology based on active, coordinated participation by all the pub-lic and private sector players involved in reducing risk and ensuring the city continues to function and turned
Barcelona into a global city pioneer, with the creation of
the Urban Resilience Department in 2014. The Depart-ment, which reports to the Urban Ecology Directorate,
is based on three pillars which constitute its three main lines of action and correspond to the three phases that
2.3 Measures implemented to make progress
on resilience and adapting to climate change
The majority of impacts caused by climate change in Barcelona are existing phenomena that will get worse. Consequently, for some years now, Barcelona has been actively working on becoming a more resilient city, which guarantees the safety and quality of life of all its resi-dents by incorporating climate change in city planning and management.
2.3.1. Improving knowledge and
governance
Improving knowledge in terms of resilience and adapting to climate change
As part of the preliminary work for drawing up the Bar-celona Climate Change Adaptation Plan, a benchmark-ing exercise was carried out in 2014, generally analysbenchmark-ing the impacts, effects and challenges facing the city and in particular exhaustively analysing the urban strategies for adapting to climate change of 32 cities worldwide.
This analysis was supplemented with a report X iden -tifying the policies, plans and programmes that the city was already putting into practice to adapt to climate change.
Finally, in order to draw up the Climate Plan and in co-operation with Barcelona Regional, the future impact of climate change on the city X has been analysed and the main weaknesses identified. The conclusions of the heat wave study have been particularly relevant. A heat risk map has been produced, identifying the most vulnera-ble areas considering the population, socio-economic and urban characteristics of buildings.
Barcelona’s urban resilience strategy
In 2016, the Council approved the government measure
on urban resilience X that encompasses the principles of the Barcelona resilience model and the series of ac -tions that are being carried out within this framework, governed by the following strategic objectives:
To integrate the resilience principles in all city trans-formation, management and maintenance projects
and processes.
To reduce the city’s weaknesses through preventive actions that eliminate the causes or mitigate the
im-pact of stresses and disturbances.
To provide the city with appropriate mechanisms for the early detection and evaluation of risks.
To work on improving the response capacity and min-imising the impact and recovery time.
To provide useful information and tools to assist the
decision-making process.
Resilience Atlas
Barce-lona that is considered as being of general interest, in or-der to contribute to improving knowledge of the city and facilitating its use as a tool in decision-making processes as well as a basis for future studies. Maps generated by City Council-driven studies and geared towards plan-ning, analysing weaknesses, or initiatives for compiling descriptive territorial information, among other things, will be published in this Atlas. The first content published in it were the results of the Barcelona Climate Change Impact Study.
New role of the Operations Centre
Since its incorporation into the Urban Resilience Depart-ment, the Operations Centre has become a key element in the resilience creation process. Within this context, it takes on a new strategic role as the coordination and communication hub in managing any incidents or critical situations the city may face for the various players and operators engaged in managing urban services.
2.3.2. Working with city networks to
exchange experiences
Exchanging knowledge with other cities
Knowledge is exchanged by participating in international projects and networks of cities and multilateral bodies
that make it possible to share experiences and informa-tion, such as the following:
ICLEI with the Cities Adapt, Resilient Cities X, Open
European Day X.
C40, network of cities committed to the fight against climate change. Recently, Barcelona also adhered to
the Women4Climate X programme.
United Nations International Strategy for Disaster Re-duction (UNISDR), with the “Making Cities Resilient” X campaign.
The 100 Resilient Cities X programme, as part of which Barcelona has access to the tools, technical advice and other resources for producing a city resil-ience strategy.
The UN-Habitat City Resilience Profiling X pro -gramme, with headquarters in Barcelona, which pro-vides local and national governments with the tools
and methods needed to assess weaknesses in urban
environments that contribute to defining and imple-menting resilience action plans. In collaboration with this programme, “Barcelona’s experience in resilience” (February 2015) and two Resilience Weeks (March 2016 and November 2018) have been organised as meeting spaces to reflect on and share knowledge and best practices with cities, experts and the main multilateral organisations and bodies that promote resilience on a global scale.
Participation in the RESCCUE project
Since 2016, Barcelona, along with Bristol and Lisbon, has been taking part in the EU project RESCCUEX, RE-Silience to cope with Climate Change in Urban arEas. This project seeks to improve our knowledge about the impact of climate change on urban services, with a mul-ti-sectoral approach, so cities can prepare for the chal-lenges this poses.
Over the course of four years, Barcelona will study the impacts generated by climate change, particularly those related to water, and will analyse its impact on the city and urban systems, considering possible interdepend-encies and cascade effects.
2.3.3. Planning to minimise impacts
caused by climate change
Heat wave action protocols
In 2004, Catalonia approved the Action Plan to Prevent the Effects of Heat Waves on Health (POCS)X. Implemented
each summer, it enables potential meteorological risk situ-ations to be foreseen as far as possible in advance, which makes it possible to minimise the negative effects of heat waves on health as well as coordinate existing measures
In the PEEM for Heat Waves, the Council includes various
measures to protect people who are vulnerable to the con -sequences of extreme temperatures. The heat wave action protocols are automatically kept at the preventive stage
from 15 June to 15 September.
Staff from the Council’s primary-care social services, home-care teams and homeless people care centres receive information and training.
The general public are informed about what a heat wave is and general recommendations to avoid their effects are issued.
The census of people and families at risk and that of vulnerable people are updated.
The list of care resources and air-conditioned day
cen-tres is updated.
Vulnerable people are informed of the steps they need take to protect themselves from the effects of a
heat wave.
A 24-hour helpline to provide information to those who call, run in coordination with the medical services when health problems are detected, goes into service.
Prevention and action plans in the event of
forest fires
The Forest Fire Prevention Programme (PPIF) in the Bar-celona Metropolitan Area works on two main lines: pas-sive prevention and active prevention. The first seeks to reduce the vulnerability to fire and decrease the like-lihood of a fire starting by planning and taking action on factors that cause fires through awareness-raising and monitoring campaigns and on the characteristics of the land. The second defines a weather warning sys-tem with fixed, mobile and immediate intervention ac-tivities, plus coordination activities in cooperation with
other services.
Barcelona also has a municipal emergency action plan (PAEM) for forest fires. This plan includes self-protec-tion plans for the ten neighbourhoods located within or around Collserola. These plans establish cooperation protocols between local residents and the emergen-cy services to coordinate the necessary actions in the event of a fire.
Conservation of species vulnerable to climate change
In Barcelona, there are certain species of fauna that are particularly sensitive to climate change (amphibians, but-terflies, bats, birds, etc.),so various steps are being taken to help conserve them: introducing tree pits, naturalising pools, planting more sustainable decorative flora, install-ing new biodiversity structures, creatinstall-ing spaces that are
of particular interest to biodiversity, etc. (see Section 4.3.2, “Naturalisation of the city”).
Monitoring and control of pests and arbovirosis
Climate change may facilitate the presence of certain pests, such as cockroaches, mosquitoes, monk parakeets and ro-dents. To avoid this, comprehensive control measures are being implemented, such as applying a water management policy aimed at reducing or eliminating possible mosquito sources from public roads and the sewage system; moni-toring mosquito populations to detect the possible arrival of invasive mosquitoes and monitoring biting activity in un-favourable periods to detect a possible change in the sea-sonality of biting (for example, an increase in temperature).
could affect some insect populations and increase the risk of certain arboviruses (such as dengue, yellow fever, West Nile, chikungunya and Zika viruses) being transmit-ted. Monitoring and control protocols have therefore been
established.
Thanks to the Mosquito Alert app, anybody can report possible tiger mosquito or yellow fever mosquito sightings and their breeding sites in public spaces by submitting a
photo. The photo picks up the GPS position and a team
is sent to investigate. Since 2014, a map X has been pub -lished that can be used to query and export all sightings
received to date.
Actions to guarantee the water supply and
manage flooding
Municipal water saving measures (see Section 9.3.1,
“Sa-ving and efficiency to guarantee the water supply”)
Raising awareness amongst the population to promote water saving (see Section 9.3.1, “Saving and efficiency to en
-sure the water supply”)
Drought Status Protocol (see Section 9.3.1, “Saving and effi
-ciency to guarantee the water supply”)
Technical Plan for Harnessing Alternative Water
Resour-ces (see Section 9.3.2, “Harnessing alternative water resour -ces”)
Management of floods using sustainable urban draina-ge systems, with the network of underground rainwater
retention tanks (see Section 9.3.5, “Flood risk and run-off
management”)
PAEM on indequate drainage/flooding (see Section 9.3.5, “
Flood risk and run-off management”)
Actions to guarantee the power supply
To guarantee access to basic power services and pre-vent power outages, Barcelona has a power outage spe-cific PEEM and gas outage spespe-cific PEEM for cases in-volving a public electricity distributor, which features ten energy advice points and the Programme to Promote Solar Power Generation, in addition to other measures
(see Chapter 1 “Energy and climate change mitigation”).
2.3.4. Progressing with the
Climate Plan in terms of rolling out
adaptation actions
Climate refuge spaces in the city
Barcelona has dedicated infrastructures and green spac-es which, if a heat event occurs, can serve as climate ref-uges, i.e. a place where residents, particularly the most
vulnerable, can go and enjoy better conditions. A prelimi-nary analysis of the potential of these infrastructures and green areas suggests that they are distributed relatively homogeneously across the city, with the exception of cer-tain areas in Zona Franca, Sarrià-Sant Gervasi and Eixam-ple. Currently, work is ongoing to identify all these spaces and the need to enhance the existing services or generate new ones to guarantee an adequate degree of coverage for the entire city (100% of the city less than 10 minutes on foot from a climate refuge space).
The Climate Plan, the best plan of the major European cities
2.4 Future goals and measures
Although Barcelona has been working towards becoming a resilient city and adapting to the impacts resulting from climate change for a number of years, as can be seen in the large variety of measures that have been implement-ed, the city now as two instruments that will enable it to integrally manage resilience and adaptation to climate change.
2018-2030 Barcelona Climate Plan
In response to the commitment the city made by adher-ing to the Covenant of Mayors for Climate & Energy in 2017, Barcelona has drawn up a Climate Plan X, a new roadmap to tackle climate change up to 2030.
The Climate Plan establishes strategic goals and meas-ures in the short-term (2018-2020) and in the medium to long term (2021-2030) structured around four strategic pillars: mitigation, adaptation and resilience, climate jus-tice and promoting citizen actions. To achieve these, the Plan features eighteen lines of action divided into five dif-ferent areas:
People first: the well-being of residents.
Starting at home: improving efficiency in buildings.
Transforming communal spaces: transforming pub-lic spaces into healthy, biodiverse, efficient and inclu-sive settings.
Climate economy: uncoupling the quality of people’s lives from economic growth, with a circular vision that makes the most of resources and avoids generating
waste and emissions.
Building together: in collaboration with an informed, critical, proactive and empowered citizenry.
To decrease vulnerability and increase the city’s resil-ience to the undesirable effects of climate change, the Climate Plan has set the following targets for 2030:
Increase green space by 1.6 km2 (1 m2 more green-ery per current inhabitant) and achieve 34,100 m2 of green roofs, walls and façades.
Increase tree cover by 5% (2037).
Increase adapted tree species from 30% to 40%.
Have 100% of the population at least 10 minutes on foot from a climate shelter (facilities and urban parks that provide good thermal comfort conditions and
which could shelter sensitive people in the event of
heat waves).
Have one water garden per district