Economic inequality
of people with disabilities
in the city of Barcelona
Research
Index
What did the research consist of? 1
Method 3
What are the main results
of the research? 13
barcelona.cat/accessible
Recommendations 18
The objective of the research is to quantify the economic strain taken on by people with disabilities and their families in order to maintain the same standard of living as the people around them. The figures for the economic inequality were calculated by taking into account the support needs of each disability profile as well as the cover provided by services and access to current assets. The aim is to apply the conclusions about this inequality in regard to access to public goods and services, in order to guarantee equality of rights.
The specific objectives of the study are as follows:
• To update the data concerning support needs and the cover provided by services.
• To extend the age range of the population considered in the study.
• To include new classes of expenditure and income.
What did the research
consist of?
The Municipal Institute of People with Disabilities (IMPD) promotes a culture of research in public administration as a basis for intervention, continual improvement and innovation, applied to the reality of people with disabilities.
The economic inequality is the additional cost involved in living with a disability under the same conditions as the people living around them. The first study on this economic inequality in
Catalonia and the rest of Spain was published in 2006. We are now presenting the study “The economic
inequality of people with disabilities in the City
of Barcelona”, which updates and extends the content of the previous study.
The study was promoted by the IMPD and the Catalan Committee of Representatives of People with
The Municipal Institute of People with Disabilities (IMPD) promotes a culture of research in public administration as a basis for intervention, continual improvement and innovation, applied to the reality of people with disabilities.
The economic inequality is the additional cost involved in living with a disability under the same conditions as the people living around them. The first study on this economic inequality in
Catalonia and the rest of Spain was published in 2006. We are now presenting the study “The economic inequality of people with disabilities in the City
of Barcelona”, which updates and extends the content of the previous study.
The study was promoted by the IMPD and the Catalan Committee of Representatives of People with
Disabilities (COCARMI) and was produced by the ESCI-UPF School of International Studies and the Sant Joan de Déu Health Complex. Various leading federations in this field also took part in the production, including: the ECOM Federation, the Catalan Federation of Intellectual Disability (DINCAT), the Catalan Federation of Mental Health and the National Organisation of Spanish Blind People (ONCE).
The objective of the research is to quantify the economic strain taken on by people with disabilities and their families in order to maintain the same standard of living as the people around them. The figures for the economic inequality were calculated by taking into account the support needs of each disability profile as well as the cover provided by services and access to current assets. The aim is to apply the conclusions about this inequality in regard to access to public goods and services, in order to guarantee equality of rights.
The specific objectives of the study are as follows:
• To update the data concerning support needs
and the cover provided by services.
• To extend the age range of the population
considered in the study.
and they also need occasional help, especially for making journeys or for certain EAs.
The profiles of people with auditory disabilities have been divided according to the language that they choose for communicating, as this involves a different kind of support:
• People who use spoken language (AD1): people with various degrees of hypoacusis, or hearing impairment, who choose to communicate through spoken language, with the support of technical aids and/or lip reading. They are self-sufficient,
but need specialised help (speech therapy, transcription, subtitling, etc.).
• People who use sign language (AD2): People with various degrees of hypoacusis who choose to communicate using sign language. They are self-sufficient, but require technical aids
and support for sign-language interpretation, etc.
Estimating costs
In the cost definition phase, the study makes an estimate of the factors that may generate economic costs for people with disabilities and their families. Two types of costs are considered:
• Direct costs: measuring economic expenditure on care, services or support elements that have to attend to the person with a disability directly due to their disability.
• People with physical disabilities, group 2 (PD2): people who have difficulty in moving around and, to a certain degree, in manipulating things.
They might also have their communication abilities affected. They need help with most EAs
and with transfers to and from a wheelchair.
• People with physical disabilities, group 3 (PD3): people who have difficulty in moving around, manipulating things and probably also with communicating. This group also includes those people with serious communication problems, whether their ability to move around or manipulate things is affected or not. They require continual personal support for EAs, transfers, and other activities in their daily lives.
The profiles of people with intellectual disabilities have been divided into three groups, according to the intensity of the support they require:
• People with intellectual disabilities, group 1 (ID1): people with a mild intellectual disability, who are self-sufficient for most EAs, but who need support of a supervisory nature and help in making certain decisions.
• People with intellectual disabilities, group 2 (ID2): people with a moderate intellectual disability, who need help with most EAs and also for other activities. They need the support of a companion to be self-sufficient.
• People with intellectual disabilities, group 3 (ID3): people with severe intellectual disability,
who require constant support for EAs and for other activities. They need permanent tutelage and constant personal help.
The profiles of people with mental disorders are:
• People with mental disorders group 1 (MD1): people with a mental disorder who can achieve stability by means of appropriate treatment. They are self-sufficient for most EAs and only require periodic supervision.
• People with mental disorders group 2 (MD2): people who, although they follow their proposed treatment, require support. They therefore need help with various EAs and continual monitoring.
• People with mental disorders group 3 (MD3): people with a mental health disorder, which is a serious condition, in spite of medical monitoring. They consequently need continual personal
support and help with EAs.
The profiles of people with sensory disabilities have been subdivided into two groups:
• People with visual impairment (VD1): they have a serious visual disability but conserve either visual acuity for carrying out activities or the visual field needed to move around without a cane or a guide dog, through the use of technical or optical aids. They are self-sufficient and do not require help with EAs.
• People who are totally blind (VD2): they need technical aids to improve their quality of life
Method
The methodological design is the one used in the Consensual Budget Standards Approach, which consists of economically quantifying all the resources that the person with a disability and their immediate circle require in order to satisfy their needs, as well as the income they obtain.
Profiles linked to the type of disability, according to the need for support
The methodology is based on the definition of thirteen profiles linked to all the types of disability. The approximate average expenditure and the average income and/or subsidies received. The thirteen
profiles under consideration are briefly outlined below.
The profiles of people with physical disabilities have been divided into three groups, according to the required need for support:
• People with physical disabilities, group 1 (PD1):
and they also need occasional help, especially for making journeys or for certain EAs.
The profiles of people with auditory disabilities have been divided according to the language that they choose for communicating, as this involves a different kind of support:
• People who use spoken language (AD1): people with various degrees of hypoacusis, or hearing impairment, who choose to communicate through spoken language, with the support of technical aids and/or lip reading. They are self-sufficient,
but need specialised help (speech therapy, transcription, subtitling, etc.).
• People who use sign language (AD2): People with various degrees of hypoacusis who choose to communicate using sign language. They are self-sufficient, but require technical aids
and support for sign-language interpretation, etc.
Estimating costs
In the cost definition phase, the study makes an estimate of the factors that may generate economic costs for people with disabilities and their families. Two types of costs are considered:
• Direct costs: measuring economic expenditure on care, services or support elements that have to attend to the person with a disability directly due to their disability.
The methodological design is the one used in the Consensual Budget Standards Approach, which consists of economically quantifying all the resources that the person with a disability and their immediate circle require in order to satisfy their needs, as well as the income they obtain.
Profiles linked to the type of disability, according to the need for support
The methodology is based on the definition of thirteen profiles linked to all the types of disability. The approximate average expenditure and the average income and/or subsidies received. The thirteen
profiles under consideration are briefly outlined below.
The profiles of people with physical disabilities have been divided into three groups, according to the required need for support:
• People with physical disabilities, group 1 (PD1): people who have difficulty in moving around but whose manipulation and communication abilities remain intact. These people are self-sufficient for most everyday activities (EAs) and only need help on occasion.
who require constant support for EAs and for other activities. They need permanent tutelage and constant personal help.
The profiles of people with mental disorders are:
• People with mental disorders group 1 (MD1): people with a mental disorder who can achieve stability by means of appropriate treatment. They are self-sufficient for most EAs and only require periodic supervision.
• People with mental disorders group 2 (MD2): people who, although they follow their proposed treatment, require support. They therefore need help with various EAs and continual monitoring.
• People with mental disorders group 3 (MD3): people with a mental health disorder, which is a serious condition, in spite of medical monitoring. They consequently need continual personal
support and help with EAs.
The profiles of people with sensory disabilities have been subdivided into two groups:
• People with visual impairment (VD1): they have a serious visual disability but conserve either visual acuity for carrying out activities or the visual field needed to move around without a cane or a guide dog, through the use of technical or optical aids. They are self-sufficient and do not require help with EAs.
• People who are totally blind (VD2): they need technical aids to improve their quality of life
• People with physical disabilities, group 2 (PD2):
people who have difficulty in moving around and, to a certain degree, in manipulating things.
They might also have their communication abilities affected. They need help with most EAs
and with transfers to and from a wheelchair.
• People with physical disabilities, group 3 (PD3):
people who have difficulty in moving around, manipulating things and probably also with communicating. This group also includes those people with serious communication problems, whether their ability to move around or manipulate things is affected or not. They require continual personal support for EAs, transfers, and other activities in their daily lives.
The profiles of people with intellectual disabilities have been divided into three groups, according to the intensity of the support they require:
• People with intellectual disabilities, group 1 (ID1):
people with a mild intellectual disability, who are self-sufficient for most EAs, but who need support of a supervisory nature and help in making certain decisions.
• People with intellectual disabilities, group 2 (ID2):
people with a moderate intellectual disability, who need help with most EAs and also for other activities. They need the support of a companion to be self-sufficient.
• People with intellectual disabilities, group 3 (ID3):
and they also need occasional help, especially for making journeys or for certain EAs.
The profiles of people with auditory disabilities have been divided according to the language that they choose for communicating, as this involves a different kind of support:
• People who use spoken language (AD1): people with various degrees of hypoacusis, or hearing impairment, who choose to communicate through spoken language, with the support of technical aids and/or lip reading. They are self-sufficient,
but need specialised help (speech therapy, transcription, subtitling, etc.).
• People who use sign language (AD2): People with various degrees of hypoacusis who choose to communicate using sign language. They are self-sufficient, but require technical aids
and support for sign-language interpretation, etc.
Estimating costs
In the cost definition phase, the study makes an estimate of the factors that may generate economic costs for people with disabilities and their families. Two types of costs are considered:
• Direct costs: measuring economic expenditure on care, services or support elements that have to attend to the person with a disability directly due to their disability.
The methodological design is the one used in the Consensual Budget Standards Approach, which consists of economically quantifying all the resources that the person with a disability and their immediate circle require in order to satisfy their needs, as well as the income they obtain.
Profiles linked to the type of disability, according to the need for support
The methodology is based on the definition of thirteen profiles linked to all the types of disability. The approximate average expenditure and the average income and/or subsidies received. The thirteen
profiles under consideration are briefly outlined below.
The profiles of people with physical disabilities have been divided into three groups, according to the required need for support:
• People with physical disabilities, group 1 (PD1): people who have difficulty in moving around but whose manipulation and communication abilities remain intact. These people are self-sufficient for most everyday activities (EAs) and only need help on occasion.
• People with physical disabilities, group 2 (PD2): people who have difficulty in moving around and, to a certain degree, in manipulating things.
They might also have their communication abilities affected. They need help with most EAs
and with transfers to and from a wheelchair.
• People with physical disabilities, group 3 (PD3): people who have difficulty in moving around, manipulating things and probably also with communicating. This group also includes those people with serious communication problems, whether their ability to move around or manipulate things is affected or not. They require continual personal support for EAs, transfers, and other activities in their daily lives.
The profiles of people with intellectual disabilities have been divided into three groups, according to the intensity of the support they require:
• People with intellectual disabilities, group 1 (ID1): people with a mild intellectual disability, who are self-sufficient for most EAs, but who need support of a supervisory nature and help in making certain decisions.
• People with intellectual disabilities, group 2 (ID2): people with a moderate intellectual disability, who need help with most EAs and also for other activities. They need the support of a companion to be self-sufficient.
• People with intellectual disabilities, group 3 (ID3): people with severe intellectual disability,
who require constant support for EAs and for other activities. They need permanent tutelage and constant personal help.
The profiles of people with mental disorders are:
• People with mental disorders group 1 (MD1):
people with a mental disorder who can achieve stability by means of appropriate treatment. They are self-sufficient for most EAs and only require periodic supervision.
• People with mental disorders group 2 (MD2):
people who, although they follow their proposed treatment, require support. They therefore need help with various EAs and continual monitoring.
• People with mental disorders group 3 (MD3):
people with a mental health disorder, which is a serious condition, in spite of medical monitoring. They consequently need continual personal
support and help with EAs.
The profiles of people with sensory disabilities have been subdivided into two groups:
• People with visual impairment (VD1): they have
a serious visual disability but conserve either visual acuity for carrying out activities or the visual field needed to move around without a cane or a guide dog, through the use of technical or optical aids. They are self-sufficient and do not require help with EAs.
• People who are totally blind (VD2): they need
The methodological design is the one used in the Consensual Budget Standards Approach, which consists of economically quantifying all the resources that the person with a disability and their immediate circle require in order to satisfy their needs, as well as the income they obtain.
Profiles linked to the type of disability, according to the need for support
The methodology is based on the definition of thirteen profiles linked to all the types of disability. The approximate average expenditure and the average income and/or subsidies received. The thirteen
profiles under consideration are briefly outlined below.
The profiles of people with physical disabilities have been divided into three groups, according to the required need for support:
• People with physical disabilities, group 1 (PD1): people who have difficulty in moving around but whose manipulation and communication abilities remain intact. These people are self-sufficient for most everyday activities (EAs) and only need help on occasion.
• People with physical disabilities, group 2 (PD2): people who have difficulty in moving around and, to a certain degree, in manipulating things.
They might also have their communication abilities affected. They need help with most EAs
and with transfers to and from a wheelchair.
• People with physical disabilities, group 3 (PD3): people who have difficulty in moving around, manipulating things and probably also with communicating. This group also includes those people with serious communication problems, whether their ability to move around or manipulate things is affected or not. They require continual personal support for EAs, transfers, and other activities in their daily lives.
The profiles of people with intellectual disabilities have been divided into three groups, according to the intensity of the support they require:
• People with intellectual disabilities, group 1 (ID1): people with a mild intellectual disability, who are self-sufficient for most EAs, but who need support of a supervisory nature and help in making certain decisions.
• People with intellectual disabilities, group 2 (ID2): people with a moderate intellectual disability, who need help with most EAs and also for other activities. They need the support of a companion to be self-sufficient.
• People with intellectual disabilities, group 3 (ID3): people with severe intellectual disability,
who require constant support for EAs and for other activities. They need permanent tutelage and constant personal help.
The profiles of people with mental disorders are:
• People with mental disorders group 1 (MD1): people with a mental disorder who can achieve stability by means of appropriate treatment. They are self-sufficient for most EAs and only require periodic supervision.
• People with mental disorders group 2 (MD2): people who, although they follow their proposed treatment, require support. They therefore need help with various EAs and continual monitoring.
• People with mental disorders group 3 (MD3): people with a mental health disorder, which is a serious condition, in spite of medical monitoring. They consequently need continual personal
support and help with EAs.
The profiles of people with sensory disabilities have been subdivided into two groups:
• People with visual impairment (VD1): they have a serious visual disability but conserve either visual acuity for carrying out activities or the visual field needed to move around without a cane or a guide dog, through the use of technical or optical aids. They are self-sufficient and do not require help with EAs.
• People who are totally blind (VD2): they need technical aids to improve their quality of life
and they also need occasional help, especially for making journeys or for certain EAs.
The profiles of people with auditory disabilities have been divided according to the language that they choose for communicating, as this involves a different kind of support:
• People who use spoken language (AD1): people
with various degrees of hypoacusis, or hearing impairment, who choose to communicate through spoken language, with the support of technical aids and/or lip reading. They are self-sufficient,
but need specialised help (speech therapy, transcription, subtitling, etc.).
• People who use sign language (AD2): People
with various degrees of hypoacusis who choose to communicate using sign language. They are self-sufficient, but require technical aids
and support for sign-language interpretation, etc.
Estimating costs
In the cost definition phase, the study makes an estimate of the factors that may generate economic costs for people with disabilities and their families. Two types of costs are considered:
• Direct costs: measuring economic expenditure
• Indirect or opportunity costs: measuring
the economic value of what a person with a disability or their circle do not have because of the disability.
List 1. Categories of costs analysed in the economic inequality of people with disabilities study
Expenditure on personal care
• Expenditure on EAs.
• Cost of specialised care.
Expenditure linked to the disability
• Housing.
• Assets and services.
• Travel.
• Training and maintenance support.
Opportunity costs of individuals
• Education levels.
• Employment rates.
• Salaries.
• Effects of early retirement.
• Pensions (65 and over).
Opportunity costs of the families and the support circle
• Carer’s time.
• Work environment.
that may be available to people with disabilities. Most of this cost occurs in the working environment –due to difficulties in accessing the job market or lower than average levels of education–
and the economic impact directly affects the salary received. The analysis of this cost is carried out through an approximate calculation of the pay gap between the real salaries that people with
disabilities receive and the estimated salaries that they should receive, according to the various disability profiles and types. The effects of the disability situation on early retirement and the pensions received have also been taken
into account.
And to round off the evaluation of costs,
the opportunity costs of the families and support circles have been calculated. This point includes the indirect effects on the family environment, caused by dedicating time to caring for the person with a disability, the reduced opportunities of
the carer at work and the effects on the main carer’s quality of life. This cost is calculated by means of evaluating concepts such as the hours the carer dedicates to the task, participation in the job market, the inherent difficulties for job promotion or access to training and the effects on their health and leisure time.
Income
This section analyses the deductions, contributions and subsidies that people with disabilities may qualify for. They often depend on the income of the person with a disability or their household unit, and they can be of five different types, as the following graph shows:
List 2. Income categories analysed in the economic inequality of people with disabilities study
The first costs considered are personal care costs,
aimed at maintaining an adequate quality of life, improving the state of people's health and avoiding any possible worsening of their condition. Personal care includes two concepts: support everyday activities or EAs and specialised care. Everyday activities or EAs mean getting out of bed, standing from a chair, getting dressed and undressing, eating, carrying out personal hygiene, control
and monitoring of the administration of simple medication, among others. By specialised care, it is meant those services that make it possible to facilitate or improve the skills of people with disabilities in relation to their social and working environments and to reduce their pain (nursing, physiotherapy, speech therapy, etc.).
The second group concerns other costs linked to the disability. These are costs associated with specific adaptations to the home for people with disabilities and the expenditure involved in the use of specific goods and services related to the
disability (adapted IT, technical and orthopaedic aid, as well as extra expenditure on items such as
clothes or leisure time). Furthermore, it includes expenditure on journeys and the adaptation
of vehicles for people with reduced mobility, as well as the cost of support for training and maintenance, which also refer to unexpected disabilities.
In regard to indirect costs, individual opportunity costs were analysed, understood as being
The first costs considered are personal care costs, aimed at maintaining an adequate quality of life, improving the state of people's health and avoiding any possible worsening of their condition. Personal care includes two concepts: support everyday activities or EAs and specialised care. Everyday activities or EAs mean getting out of bed, standing from a chair, getting dressed and undressing, eating, carrying out personal hygiene, control
and monitoring of the administration of simple medication, among others. By specialised care, it is meant those services that make it possible to facilitate or improve the skills of people with disabilities in relation to their social and working environments and to reduce their pain (nursing, physiotherapy, speech therapy, etc.).
The second group concerns other costs linked to the disability. These are costs associated with specific adaptations to the home for people with disabilities and the expenditure involved in the use of specific goods and services related to the
disability (adapted IT, technical and orthopaedic aid, as well as extra expenditure on items such as
clothes or leisure time). Furthermore, it includes expenditure on journeys and the adaptation
of vehicles for people with reduced mobility, as well as the cost of support for training and maintenance, which also refer to unexpected disabilities.
In regard to indirect costs, individual opportunity costs were analysed, understood as being
the economic value involved in the fewer alternatives
Income
This section analyses the deductions, contributions and subsidies that people with disabilities may qualify for. They often depend on the income of the person with a disability or their household unit, and they can be of five different types, as the following graph shows:
List 2. Income categories analysed in the economic inequality of people with disabilities study
that may be available to people with disabilities. Most of this cost occurs in the working environment –due to difficulties in accessing the job market or lower than average levels of education–
and the economic impact directly affects the salary received. The analysis of this cost is carried out through an approximate calculation of the pay gap between the real salaries that people with
disabilities receive and the estimated salaries that they should receive, according to the various disability profiles and types. The effects of the disability situation on early retirement and the pensions received have also been taken
into account.
And to round off the evaluation of costs,
the opportunity costs of the families and support circles have been calculated. This point includes the indirect effects on the family environment, caused by dedicating time to caring for the person with a disability, the reduced opportunities of
the carer at work and the effects on the main carer’s quality of life. This cost is calculated by means of evaluating concepts such as the hours the carer dedicates to the task, participation in the job market, the inherent difficulties for job promotion or access to training and the effects on their health and leisure time.
The first costs considered are personal care costs, aimed at maintaining an adequate quality of life, improving the state of people's health and avoiding any possible worsening of their condition. Personal care includes two concepts: support everyday activities or EAs and specialised care. Everyday activities or EAs mean getting out of bed, standing from a chair, getting dressed and undressing, eating, carrying out personal hygiene, control
and monitoring of the administration of simple medication, among others. By specialised care, it is meant those services that make it possible to facilitate or improve the skills of people with disabilities in relation to their social and working environments and to reduce their pain (nursing, physiotherapy, speech therapy, etc.).
The second group concerns other costs linked to the disability. These are costs associated with specific adaptations to the home for people with disabilities and the expenditure involved in the use of specific goods and services related to the
disability (adapted IT, technical and orthopaedic aid, as well as extra expenditure on items such as
clothes or leisure time). Furthermore, it includes expenditure on journeys and the adaptation
of vehicles for people with reduced mobility, as well as the cost of support for training and maintenance, which also refer to unexpected disabilities.
In regard to indirect costs, individual opportunity costs were analysed, understood as being
the economic value involved in the fewer alternatives
Income
This section analyses the deductions, contributions and subsidies that people with disabilities may qualify for. They often depend on the income of the person with a disability or their household unit, and they can be of five different types, as the following graph shows:
List 2. Income categories analysed in the economic inequality of people with disabilities study
Income
• Non-contributive pensions (6-64 years old).
• Guaranteed citizen income.
Dependency subsidies
• Economic benefit linked to the service (PEV).
• Family carer.
Social care subsidies (PUA)
• Support products.
• Mobility.
• Visual impairment support.
• Auditory impairment support.
Deductions
• Exempted income.
• Minimums.
• Tax-base reductions.
• Capital gains / losses.
and mobility subsidies, calculating the amount of subsidies paid to people with disabilities
in the City of Barcelona in 2017, by concept and type of disability.
In regard to deductions, the study evaluates the impact of disability in average terms, in accordance with the Income Tax Law (IRPF) and it breaks down the impact of disability based on each of the tax declaration concepts for the 2017 financial year.
Lastly, the study analyses and evaluates various other deductions, benefits and subsidies, including the subsidy for prostheses and orthotics,
VAT reductions for buying a vehicle, exemption from registration tax, reduced prices on public transport, exemption and discounts for the mechanically-powered vehicle tax, exemption from the charge for registering a guide dog, exemption and reductions on pharmaceutical co-payment, the subsidy for pharmaceuticals excluded from Social Security, respite services, subsidies for renovating residential buildings and housing in the City of Barcelona, subsidies for driving licences and the adaptation of vehicles, parking cards for people with reduced mobility,
public and individual parking reservations, insurance policies for unexpected disabilities, etc. In all cases, the estimated value of the subsidies are weighted according to the percentage of the population with disabilities in the City of Barcelona that may qualify as beneficiaries.
Other subsidies and income
• Vehicles VAT
• Public transport
• Tax on Mechanically Powered Vehicles (IVTM)
• Rehabilitation subsidies
• Review of allocation / exclusion from various concepts
• Insurance / compensation
Firstly, the non-contributive pensions received by people with disabilities are considered for each category along with the impact of the guaranteed citizen income (GCI), which complements both the contributive and non-contributive pensions of people who are over the age of 18. However, the impact of the GCI on people with disabilities is not very significant, and it has been excluded from the analysis.
The section on dependency subsidies includes two benefits: the economic benefit linked to the service (PEVS), a resource that facilitates the payment of services in the private sector when it is not possible to access that service in the public sector, and the benefit to support the family circle
and non-professional carers, which is awarded to relatives up to a third degree who have been acting as carers for over a year at the time of the application.
In addition to dependency subsidies, elements of the Social Care Subsidy Programme (PUA) were analysed for the concepts of support products
and mobility subsidies, calculating the amount of subsidies paid to people with disabilities
in the City of Barcelona in 2017, by concept and type of disability.
In regard to deductions, the study evaluates the impact of disability in average terms, in accordance with the Income Tax Law (IRPF) and it breaks down the impact of disability based on each of the tax declaration concepts for the 2017 financial year.
Lastly, the study analyses and evaluates various other deductions, benefits and subsidies, including the subsidy for prostheses and orthotics,
VAT reductions for buying a vehicle, exemption from registration tax, reduced prices on public transport, exemption and discounts for the mechanically-powered vehicle tax, exemption from the charge for registering a guide dog, exemption and reductions on pharmaceutical co-payment, the subsidy for pharmaceuticals excluded from Social Security, respite services, subsidies for renovating residential buildings and housing in the City of Barcelona, subsidies for driving licences and the adaptation of vehicles, parking cards for people with reduced mobility,
public and individual parking reservations, insurance policies for unexpected disabilities, etc. In all cases, the estimated value of the subsidies are weighted according to the percentage of the population with disabilities in the City of Barcelona that may qualify as beneficiaries.
What are the main results
of the research?
In the process of calculating the economic inequality of people with disabilities, costs and incomes have been compared in order to obtain the figure for that economic inequality.
The results make it possible to:
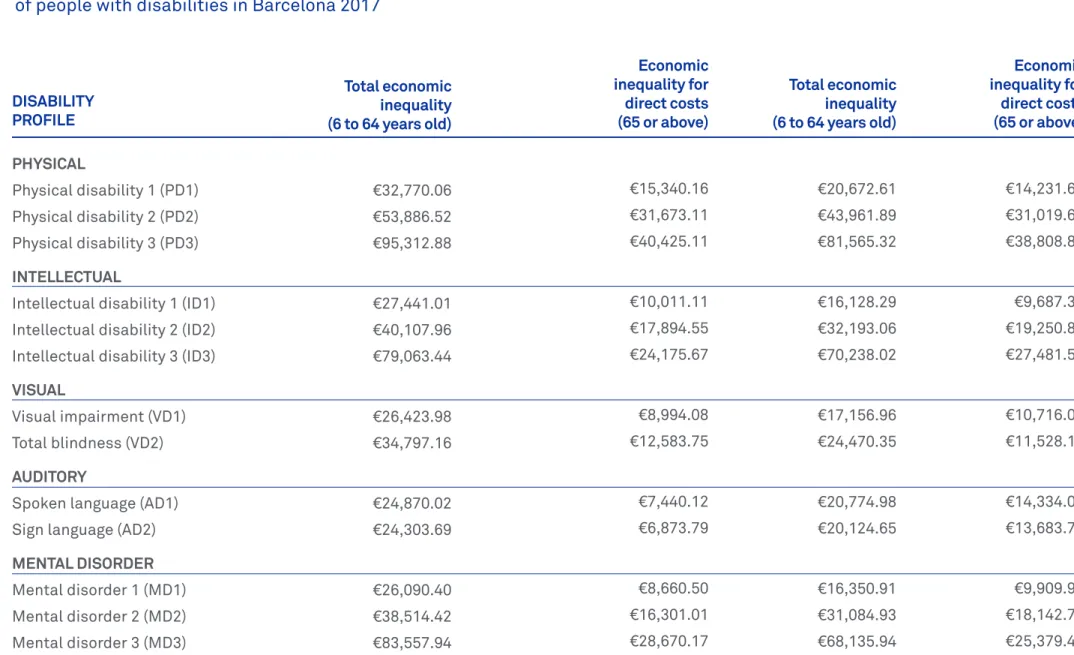
1. Identify the economic inequality for each defined disability profile. This economic inequality
is quantified according to each disability profile’s need for support, the nature of the expenditure and, for the first time, the group of people above the age of 65 is taken into account (See Table 1). 2. Ascertain the effects of age on the evaluation
of the economic inequality. It is calculated that the economic inequality in direct costs for people between the ages of 6 and 64 is lower than that of people aged 65 or over. It has also been
established that the effects of opportunity costs or indirect costs in regard to salaries has a more significant impact on people of a working age (See Table 2).
3. Obtain objective data for improving the system of public charges and access to goods
and services for people with disabilities, with beneficial effects on the income that each group requires in accordance with their needs
Table 1. Economic inequality
of people with disabilities in Barcelona 2017
Total economic inequality (6 to 64 years old) DISABILITY
PROFILE
PHYSICAL
Physical disability 1 (PD1) Physical disability 2 (PD2) Physical disability 3 (PD3)
INTELLECTUAL
Intellectual disability 1 (ID1) Intellectual disability 2 (ID2) Intellectual disability 3 (ID3)
VISUAL
Visual impairment (VD1) Total blindness (VD2)
AUDITORY
Spoken language (AD1) Sign language (AD2)
MENTAL DISORDER Mental disorder 1 (MD1) Mental disorder 2 (MD2) Mental disorder 3 (MD3)
€32,770.06 €53,886.52 €95,312.88
€27,441.01 €40,107.96 €79,063.44
€26,423.98 €34,797.16
€24,870.02 €24,303.69
€26,090.40 €38,514.42 €83,557.94
€10,011.11 €17,894.55 €24,175.67
€8,994.08 €12,583.75
€7,440.12 €6,873.79
€8,660.50 €16,301.01 €28,670.17
€16,128.29 €32,193.06 €70,238.02
€17,156.96 €24,470.35
€20,774.98 €20,124.65
€16,350.91 €31,084.93 €68,135.94
€9,687.35 €19,250.84 €27,481.54
€10,716.02 €11,528.13
€14,334.04 €13,683.71
€9,909.97 €18,142.71 €25,379.46
Economic inequality for direct costs (65 or above)
€15,340.16 €20,672.61 €14,231.67 €31,673.11 €43,961.89 €31,019.67 €40,425.11 €81,565.32 €38,808.84
Total economic inequality (6 to 64 years old)
€41,203,54 Municipal Institute of People with Disabilities
Social Rights, Global Justice, Feminisms and LGBTI Area
The average value of economic inequality
for disability (EID) has been calculated based on this data and weighted according to the number of people in the census with each of the thirteen disability profiles, for both age ranges (from 6 to 64 and 65 and over). The total values and the value for direct costs are as follows:
Table 2. Index of economic inequality of people with disabilities in Barcelona by age range 2017
Economic inequality (EID) for direct costs Total economic
inequality (EID)
6 to 64 years old €17,743,47
65 or over €36,785,46 €21,111,22
The proposed charges are made based on the ratio of economic inequality assigned to each disability profile with respect to the EID for each age group. The result is a reference table which establishes extreme inequality values, such as the one for
the PD3 group up to the age of 64 (227% higher than the average inequality value for this age group) or the MD3 profile, which is 161% higher. The values for each profile and age group are shown in
Difference between economic inequality and EID index (6 to 64 years old)
Difference between economic inequality and EID index (65 or over) DISABILITY
PROFILE
PHYSICAL
Physical disability 3 (PD1) 86.46% 67.41% Physical disability 2 (PD2) 178.51% 146.93% Physical disability 3 (PD3) 227.83% 183.83% INTELLECTUAL
Intellectual disability 1 (ID1) 56.42% 45.89% Intellectual disability 2 (ID2) 100.85% 91.19% Intellectual disability 3 (ID3) 136.25% 130.18% VISUAL
Visual impairment (VD1) 50.69% 50.76% Total blindness (VD2) 70.92% 54.61% AUDITORY
Spoken language (AD1) 41.93% 67.90% Sign language (AD2) 38.74% 64.82% MENTAL DISORDER
• To coordinate actions from a gender perspective, taking into account the predominant role
of women as the main carer for the person with a disability.
• To structure public policies as part of
a cross-cutting strategy to support organisations, allocating resources and avoiding duplication in order to help to effectively overcome
inequalities of various types which people with disabilities and their families have to face.
• To improve existing information systems in order to facilitate complete, integrated and reliable information on the disabled population and alleviate the lack of integration of information systems controlled by various bodies,
organisations, institutions and associations that work with people with disabilities and/or
their families.
• To efficiently and effectively coordinate available resources, avoiding policies that homogenise subsidies and treat a clearly heterogeneous group uniformly.
• To broaden our knowledge of the economic inequality suffered by the group of people between the ages of 0 and 5.
Municipal Institute of People with Disabilities
Social Rights, Global Justice, Feminisms and LGBTI Area
Recommendations
The analysis of the economic inequality of people with disabilities living in the City of Barcelona shows the need for coordinating public policies which compensate for this, guaranteeing equality of rights and avoiding situations of exclusion. Making
a qualitative leap in public policies that affect the income and expenditure of people with
disabilities will ensure that everyone has the same options for developing their life plans.
The recommendations arising from the study are as follows:
• To include disability as a variable in policies
concerning social charges; i.e. that taxes, duties and public-sector charges for accessing public services should take into account economic inequality according to the type and degree of disability.
• To promote policies that take into account
the differential effect of the disabled person’s age when quantifying economic inequality
The analysis of the economic inequality of people with disabilities living in the City of Barcelona shows the need for coordinating public policies which compensate for this, guaranteeing equality of rights and avoiding situations of exclusion. Making
a qualitative leap in public policies that affect the income and expenditure of people with
disabilities will ensure that everyone has the same options for developing their life plans.
The recommendations arising from the study are as follows:
• To include disability as a variable in policies concerning social charges; i.e. that taxes, duties and public-sector charges for accessing public services should take into account economic inequality according to the type and degree of disability.
• To promote policies that take into account
the differential effect of the disabled person’s age when quantifying economic inequality
and the greater significance of indirect costs in proportion to how young the person with a disability is.
• To structure public policies as part of
a cross-cutting strategy to support organisations, allocating resources and avoiding duplication in order to help to effectively overcome
inequalities of various types which people with disabilities and their families have to face.
• To improve existing information systems in order
to facilitate complete, integrated and reliable information on the disabled population and alleviate the lack of integration of information systems controlled by various bodies,
organisations, institutions and associations that work with people with disabilities and/or
their families.
• To efficiently and effectively coordinate available
resources, avoiding policies that homogenise subsidies and treat a clearly heterogeneous group uniformly.
• To broaden our knowledge of the economic
Municipal Institute of People with Disabilities
Social Rights, Global Justice, Feminisms and LGBTI Area
Who was involved
in this research?
This research was carried out thanks
to the collaboration of the Municipal Institute of People with Disabilities, the ESCI-UPF School of International Studies, the Sant Joan de Déu Health Complex, the COCARMI, the DINCAT
Federation, the Catalan Federation of Mental Health, ECOM and ONCE.
Steering committee:
Alba Mestres. Planning and Evaluation specialist, IMPD.
Laura Trujillo. Planning and Evaluation specialist, IMPD.
Meritxell Caralt. Technical secretary, COCARMI. Sergi Morera. Head of Planning and Evaluation, IMPD.
Research team:
Jordi Puig. Associate professor, ESCI-UPF. María Luisa de la Puente. Head of the Quality and Safety Unit, Sant Joan de Déu Health Complex. Marta Segura. Head of studies, ESCI-UPF.
Research
Results and conclusions
October 2019
Municipal Institute
for People with Disabilities Social Rights, Global Justice, Feminisms and LGBTI Area