Implications of phytoplankton cell death losses forcarbon flux in Oceanic food webs
121
0
0
Texto completo
(2)
(3) Junio 2012 Memoria presentada por Sébastien Lasternas para optar al título de Doctor en el programa de doctorado de Ciencias Marinas, organizado por el Departamento de Biología de la Universidad de las Islas Baleares (UIB), el Instituto Mediterráneo de Estudios Avanzados (IMEDEA) y el Consejo Superior de Investigaciones Científicas (CSIC). Instituto Mediterráneo de Estudios Avanzados Dissertation presented by Sébastien Lasternas for the PhD degree in the Programme of Marine Sciences, organized by the department of Biology of the Universitad de las Islas Baleares (UIB), the Mediterranean Institute for Advanced Studies (IMEDEA) and the Spanish National Research Council (CSIC). Directora: Dra. Susana Agustí Requena Ponente: Dra. Nona Sheila Agawin Doctorando: Sébastien Lasternas.
(4)
(5) Autor: Sébastien Lasternas 971 610897 – Sébastien@imedea.uib-csic.es Directora: Dra. Susana Agustí Requena 971 611724 – sagusti@imedea.uib-csic.es Ponente: Dra. Nona Sheila Agawin nona.agawin@uib.es Programa de doctorado de Ciencias Marinas Departamento de Biología de la Universidad de las Islas Baleares Área de conocimiento: ECOLOGIA (Codigo UNESCO 220) Palabras clave: Fitoplancton, muerte celular, vector de mortalidad, procesos de excreción, carbono orgánico disuelto, flujos de carbono, viabilidad bacteriana Key words: Phytoplankton, cell death, vector of mortality, releasing processes, dissolved organic carbon, carbon fluxes, bacterial viability.
(6)
(7) Let us a little permit Nature to take her own way; she better understands her own affairs than we. Michel de Montaigne (1533-1592) Essays, Book III - Chap. XIII.
(8)
(9) TABLE OF CONTENTS Abstract ............................................................................................. Resumen ............................................................................................. General Introduction .................................................................................. 1 3 7. Chapter 1 ............................................................................................. 23 Phyto- and bacterioplankton abundance and viability and their relationship with phosphorus across the Mediterranean Sea (2010) Sébastien Lasternas, Susana Agustí and Carlos M. Duarte. Aquatic Microbial Ecology 60: 175–191 Chapter 2 ............................................................................................. 61 Phytoplankton community structure during the record Arctic ice-melting summer 2007 (2010) Sébastien Lasternas and Susana Agustí. Polar Biology 33: 1709–1717 Chapter 3 ............................................................................................. 83 Planktonic community structure and survival success in warming Antarctic Peninsula waters during Austral summer (2012) Sébastien Lasternas and Susana Agustí. Submitted to Global Change Biology. Chapter 4 ............................................................................................. 113 Carbon fluxes forced by anticyclonic mesoscale eddies generated by islands at the subtropical NE Atlantic Ocean (2012) Sébastien Lasternas, Marc Piedeleu, Pablo Sangrá, Carlos M. Duarte and Susana Agustí. Biogeosciences Discussion 9: 10241-10283 Chapter 5 ............................................................................................. 151 Bacterial survival governed by the release of dissolved organic carbon from senescent oceanic phytoplankton (2012) Sébastien Lasternas and Susana Agustí. Submitted to Proceedings of the National Academy of Sciences (Biological Sciences: Ecology) General Discussion ................................................................................. Conclusions ............................................................................................. Acknowledgements. 177 197.
(10)
(11) Abstract. Abstract Phytoplankton losses by cell death, independent of grazing are occurring in the ocean. Phytoplankton cells have been described to die upon encountering adverse environmental conditions, and cell death and lysis would result in the release of the carbon incorporated in the photosynthesis by the phytoplankton mostly as dissolved organic carbon (PDOC). The availability of dissolved organic carbon (DOC) is expected to be a major constraint for the heterotrophic bacteria and consequently the release by cell mortality of the recently photosynthate carbon may benefit the bacterial community and the channelled transfer of carbon through the microbial loop. All this processes have been however poorly documented yet and the contribution of the phytoplankton cell death to the release of PDOC has not been explored in natural communities. The goal of this PhD Thesis is to provide quantitative information on phytoplankton and bacteria cell death in natural communities and to document the fraction of DOC released by phytoplankton (PDOC) resulting from cell death under contrasting natural conditions. The exploration of the relationships between the phytoplankton cell mortality, DOC released by phytoplankton (PDOC) and microbial survival would contribute to better understand the paths of carbon from photosynthesis to heterotrophic bacteria by cell death processes operating in nature. Contrasting environments and planktonic communities from different oceanic regions including the Mediterranean Sea, Arctic, Antarctic and Atlantic oceans were studied. Evaluation of the in situ health status of the natural phytoplanktonic communities and bacteria were analyzed by testing their cell membrane permeability a property used to define cell death by cell biologist. On average the 40.5 ± 16.9 % of the total phytoplankton abundance were represented by dead cells in the natural phytoplankton populations analyzed during this study, suggesting the relevance of cell dead processes for phytoplankton dynamics. Bacterioplankton survival averaged 69.8 ± 19.8 % of heterotrophic living bacteria (HLB) along the studied areas, presenting significant positive relationships with nutrients concentration (i.e. phosphate at oligotrophic areas) and with water temperature, as indicated by the increasing percentage in HLB with increasing water temperature.. 1.
(12) Abstract. Nutrients concentration and temperature were also relevant factors determining the heath status of phytoplankton. Across the studied areas, with the exception of polar waters where nutrient availability was not a limiting factor, microphytoplankton populations showed higher mortality within oligotrophic waters, and increased survival rates with increasing nutrient concentrations. For instance, diatoms presented higher percentage of living cells at the NE Atlantic waters enriched in nutrients by cyclonic mesoscale eddies and at the waters influenced by the Mauritanian’s upwelling and its mortality significantly increased under anticyclonic conditions, deprived of nutrients, and at the oligotrophic waters from the NE Subtropical Atlantic gyre. At the Mediterranean Sea, dinoflagellates and Synechococcus spp. survival responded significantly to phosphate availability and their viability increased with increasing phosphate concentration. Moreover, we observed Prochlorococcus sp. cell mortality to be significantly influenced by the increase in concentration of dissolved inorganic nitrogen. Additionally, as well as observed for the bacterioplankton, water temperature appeared to have significant effects on the health status of phytoplankton. Picophytoplankton populations’ survival responded positively with increasing water temperature, and Synechococcus spp. and Prochlorococcus sp. presented higher viability associated with warmer waters in the Mediterranean Sea and NE Atlantic Ocean. Particularly within polar waters, nano-microphytoplankton populations presented a distinct relationship to increasing water temperature; nanoflagellate mortality decreased with increasing water temperature, while conversely, diatoms presented higher mortality associated with warm waters. Phytoplankton mortality explained the 41.4 ± 3.9 % of the percentage of released DOC production (PDOC) relative to total primary production, indicating that cell death is a major process explaining the production of dissolved organic carbon by oceanic phytoplankton. The percentage of PDOC observed here, represented on average the half of the total primary production (54.4 ± 1.5 %) and supported, at the NE Atlantic Ocean bacterial viability. The results presented in this PhD indicate that phytoplankton cell mortality, by excreting the photosynthesized carbon as dissolved to the medium, is fuelling the dissolved organic carbon pool and significantly affect the carbon fluxes, by favouring the microbial loop and reducing particulate carbon sequestration to the deep ocean.. 2.
(13) Resumen. Resumen En el océano se dan pérdidas de fitoplancton por muerte celular, independientes de la predación. Se ha descrito cómo las células de fitoplancton mueren al encontrarse en condiciones ambientales adversas; esta muerte celular y lisis puede resultar en la liberación del carbono incorporado en la fotosíntesis por el fitoplancton en su mayoría como carbono orgánico disuelto (PDOC). Una de las mayores limitaciones para las bacterias heterotróficas es la disponibilidad de carbono orgánico disuelto (DOC) por lo que, consecuentemente, la liberación de carbono fotosintético proveniente de la muerte celular beneficiaría a la comunidad bacteriana al ser transportada por la red trófica. Por el momento, estos procesos aún no están totalmente documentados y la contribución de la muerte celular de fitoplancton en la liberación de PDOC no se ha explorado en comunidades naturales. Esta tesis tiene como objetivo proveer información cuantitativa sobre la muerte celular en fitoplancton y bacterias en comunidades naturales y documentar la fracción del DOC que es liberada por el fitoplancton (PDOC) a través de la muerte celular bajo condiciones naturales muy contrastadas. La exploración de las relaciones existentes entre la muerte celular del fitoplancton, el carbono orgánico disuelto liberado por este fitoplancton y la supervivencia bacteriana puede contribuir a una mayor comprensión de los pasos que da el carbono desde la fotosíntesis hasta las bacterias heterotróficas a través de los procesos de muerte celular que operan en la naturaleza. Se estudiaron comunidades planctónicas y parámetros ambientales en diferentes y contrastadas regiones oceánicas que incluyeron el Mar Mediterráneo y los Océanos Ártico, Antártico y Atlántico. Se evaluó in situ el estado de salud de las comunidades fitoplantónicas naturales y de bacterias a través del examen del estado de permeabilidad de la membrana celular, propiedad que define la muerte celular para los biólogos celulares. Las poblaciones naturales de el estudio demostraron que las células muertas pueden representar en promedio el 40.5 ± 16.9 % de la abundancia total del fitoplancton para todos los sistemas, lo cual sugiere el grado de importancia de los procesos de muerte celular para la dinámica del fitoplancton. La supervivencia bacteriana supuso como media un 69.8 ± 19.8% de las bacterias heterotróficas vivas (HLB) de las zonas estudiadas y presentó relaciones positivas significativas con la concentración de nutrientes (p.e. fosfatos en áreas oligotróficas) y con la temperatura del agua, de modo que el porcentaje de HLB aumenta a medida que lo hace la temperatura del agua.. 3.
(14) Resumen. La temperatura del agua y la concentración de nutrientes también resultaron ser factores relevantes para determinar el estado de salud del fitoplancton. A lo largo de las zonas estudiadas, con la excepción de aguas polares donde la disponibilidad de nutrientes no era un factor limitante, las poblaciones de microfitoplancton presentaron mayores valores de mortalidad en aguas oligotróficas incrementándose los valores de supervivencia en zonas con concentraciones crecientes de nutrientes. Por ejemplo, las diatomeas presentaron un porcentaje de células vivas mayor en aguas del NE Atlántico, enriquecidas en nutrientes por los eddies ciclónicos de mesoescala y en aguas bajo influencia del afloramiento de Mauritania. Su mortalidad aumentó significativamente en condiciones anticiclónicas, desprovistas de nutrientes, y en las aguas oligotróficas del giro Atlántico NE Subtropical. En el mar Mediterráneo, la supervivencia de los dinoflagelados y de Synechococus spp. respondió significativamente a la disponibilidad de fosfatos y su viabilidad también aumentó con aumentos en la concentración de fosfatos. También se observó que la muerte celular en Prochlorococcus sp. se veía afectada por la concentración de nitrógeno inorgánico disuelto. De manera adicional, la temperatura del agua, al igual que en bacterias, resultó tener efectos significativos sobre el estado de salud del fitoplancton. Las supervivencia de las poblaciones de Picofitoplancton respondió positivamente a aumentos en la temperatura del agua y Synechococus spp. y Prochlorococcus sp. presentaron mayores viabilidades asociadas a aguas mas cálidas en el mar mediterráneo y en el NE del océano Atlántico. Particularmente, en aguas polares, las poblaciones de nanomicrofitoplancton presentaron mayores mortalidades asociadas a aguas mas cálidas. La mortalidad del fitoplancton constituye un proceso importante en la producción de carbono orgánico disuelto, resultando que el porcentaje de células muertas de fitoplancton explica el 41.4 ± 3.9 % del porcentaje de producción liberada (PDOC) en relación a la producción primaria total. Los resultados presentados en esta tesis indican que la muerte celular del fitoplancton, excretando el carbono fotosintético en forma de carbono disuelto al medio, alimenta la reserva de carbono orgánico disuelto y afecta significativamente a los flujos de carbono, favoreciendo el loop microbiano y reduciendo la sedimentación de carbono particulado hacia el océano profundo.. 4.
(15)
(16) General Introduction. Fig.1. Fate of the photosynthesized carbon by phytoplankton in marine systems. POC: particulate organic carbon – DOC: Dissolved organic carbon. Full black arrows: biological & physiological processes – Full red arrows: physical processes - dotted arrows: trophic relationships 6.
(17) General Introduction. General Introduction The oceans play a major role in the global carbon cycle and the ultimate fate of anthropogenic CO2 (Falkowski et al., 2000). Marine phytoplankton are major players in the carbon cycle because of its ability to transform inorganic resources into nutritive organic elements usable by consumers, accounting for about 50% of the global biological uptake of carbon dioxide (Field et al., 1998). CO2 in solution is converted to organic matter by the photosynthetic activity of phytoplankton and is entering the marine carbon cycle by different processes strongly dependent on the dominant mechanisms of losses operating. In oceanic areas, phytoplankton dominate the primary production and represent the base of the trophic food web, implying that the carbon photosynthesized by phytoplankton is channelled through the pelagic food web via grazing by herbivores (Fig. 1). Part of the organic carbon could be transported downward from the surface waters to the deep ocean as a result of phytoplankton sinking. This process known as the “biological pump” represents the flux of organic carbon, mostly as particles, that ending at the bottom of the ocean sequestrates atmospheric carbon (Fig. 1). A substantial part of the photosynthesized carbon is however entering the dissolved organic pool by a variety of processes as sloppy feeding, released during grazing, or by phytoplankton dissolved organic carbon release by exudation and cell death. This path of the carbon could be therefore transfer to the food web by the microbial loop (Azam 1998), since heterotrophic bacteria are the major consumers of this DOC pool (Fig. 1). The fate of the carbon photosynthesized by phytoplankton in the system is then dependent on the dominant loss processes and the net balance will be calculated by applying the equation ruling phytoplankton population dynamics: Net growth = Gross growth + Losses (grazing + sinking + cell death) Among the losses mechanisms, phytoplankton cell mortality has been receiving less attention until recently but it could be more important than presumed in the past, representing losses up to 50% of the phytoplankton growth (Agustí et al 1998). In the euphotic layer, the net phytoplankton biomass accumulation and production are a function of the growth rates of species’ populations, mostly depending on resources on the one hand, and of their loss rates via sinking, grazing and cell death in the other.. 7.
(18) General Introduction. A large effort has been made in the literature to describe the processes influencing phytoplankton growth and productivity. Among the abiotic factors driving oceans primary productivity and biomass, nutrients availability largely influences phytoplankton biomass and production (e.g. Reynolds 1995) as well as modifying community structure, indicated, for instance, by the predominance of small phytoplankton forms (picophytoplankton) under oligotrophic conditions (Platt et al., 1983; Agawin et al., 2000). The light irradiance, water temperature and hydrological features (such as mixing regime) are also interceding in ruling phytoplankton dynamics and structure (e.g Chan 1978; Litchman 1998; Agustí and Duarte, 2000; Atkinson et al., 2003; Daufresne et al., 2009). The competition between the phytoplanktonic species for the same resources (e.g. nutrients, light) is also influencing the community structure and natural population dynamics (e.g Litchman and Klausemeier, 2001; Litchman et al., 2004) but is difficult to evaluate in situ. The principle of competitive exclusion (Hardin, 1960; Armstrong and McGehee, 1980) suggests that in homogeneous, well-mixed environments, species that compete for the same resource cannot coexist, and one species should finally take advantage over the others. Thus, while in many natural waters, nutrients and light are the major limiting resources and natural phytoplankton population would be competing, in situ measurements show prolonged coexistence of a large number of phytoplankton species, which was identified by Hutchinson (1961) as the plankton paradox. How a large number of competing phytoplankton species could coexist in marine ecosystems under a seemingly limited variety of resources? Several mechanisms were proposed to explain this plankton paradox; the spatial segregation (Hassell et al., 1994) by which species would differ in their ecological preferences and occupy different niches (Connell 1978); perturbation of the water column would also promote coexistence of species (Tilman 1994). Incomplete vertical mixing through a light gradient affects the growth of the phytoplankton species (Huisman et al., 1999), which might in some cases promote the coexistence, and diversity of phytoplankton (Weissing and Huisman, 1994). Since Hutchinson (1961) questioned the theoretical foundation of the mechanisms allowing the coexistence of complex planktonic communities, and, despite the aroused effort of the marine biologist and ecologist community to explain the paradox, the analysis of such coexistence in natural planktonic communities results elusive. For instance, when examining the competitive success of planktonic populations, the classical evaluation focuses in changes in abundance and their distribution, but this approach cannot suffice because factors such as grazing pressure, difficult to embrace in the evaluation, would reduce the abundance of the best competitor (Thingstad et al., 2005). 8.
(19) General Introduction. The inspection of the health status of the natural planktonic species, quantifying the living and dead cells proportion in situ under the environmental conditions, constitutes a relevant approach to inform on the success of the population conforming the natural communities (Agustí 2004; Alonso-Laíta & Agustí 2006; Alonso-Sáez et al. 2006; Gasol et al., 2009a) facing environmental changes and aspires to be broadly apply to document the interactions and ecological preferences of the population. The same factors that are regulating the dynamic of phytoplankton population growth would be vital when limited, representing a stress for the cells inducing cell death. New discoveries and growing empirical evidence on the rates and mechanisms of phytoplankton cell death illustrate that phytoplankton cells die upon encountering adverse environmental conditions, such as limited nutrient concentration (Tilman et al., 1982; Berges and Falkowski, 1998), low and extreme UV and PAR conditions (Berges and Falkowski, 1998; Llabrés and Agustí, 2006), temperature thresholds (AlonsoLaita and Agutí 2006), and viral infection (Suttle et al., 1990; Fuhrman 1999). The same concept will apply to the heterotrophic component of the plankton, with the availability of organic and inorganic nutrients constrain their abundance, production and metabolic activity (del Giorgio et al., 1996; Schumann et al., 2003; Alonso-Sáez et al, 2007; Mével et al., 2008; Gasol et al. 2009b). Water temperature that intercedes as well in bacterial processes such as growth, production, and substrates uptake (White et al., 1991; Kirchman et al., 1997; Pomeroy et al., 2001) would also affect bacterial survival. The assessments of the percentage of living and dead planktonic cells in the ocean would provide a direct information on the health status of the populations under the growth conditions experienced in situ, and would help in exploring their competitive success and coexistence. The study of such interactions may enable us to acknowledge the underlying mechanisms that govern the structuring of natural plankton communities, such as competition and ecological preferences, identifying the factors affecting health status under changes in environmental conditions (such as nutrient availability and hydrological changes).. 9.
(20) General Introduction. Phytoplankton cell death and its role in the release of dissolved organic carbon Phytoplankton cells may represent a direct source of production of oceanic DOC, which is often overlooked or underestimated. Some studies have estimated that in some systems about 50% of algal production passes to the DOC pool (Karl et al., 1998). The production of DOC by phytoplankton (PDOC) is principally sustained by mechanisms such as sloppy feeding, phytoplankton cell death and lysis, and exudation (Myklestad 2000; Nagata 2000). The sloppy feeding consists in the incomplete feeding by herbivorous that results in cell fragments and in the liberation of organic carbon (Nagata and Kirchman 2000, Nagata 2000). There is also evidence of consistent extracellular exudation by phytoplankton cells in their exponential phase of growth (Myklestad 2000). Cell death and lysis through physical stressors or biological factors such as the attack of viruses would result in the loss of significant amounts of cell material to the external medium and imply the liberation of the organic carbon synthetized during the photosynthesis (Myklestad 2000; Nagata 2000). Previous studies revealed that cell lysis should be a significant vector for DOC production in oligotrophic waters (Agustí et al., 1998; Agustí et al., 2001; Agustí and Duarte 2012). The extracellular release or production of dissolved organic carbon (PDOC) by phytoplankton would be expected to vary with the health status of the phytoplanktonic populations and the reliable changing environmental conditions. The examination of such contribution of the phytoplankton cell death to the releasing in PDOC has been poorly explored in natural communities. The dissolved fraction of primary production (PDOC) can represent a significant amount of total primary production (TPP) (Marañón et al., 2004; Morán and Estrada, 2001) though it is often neglected in primary production measurements, typically estimating particulate primary production. The dissolved organic carbon production by the phytoplankton corresponds to the difference between total and particulate primary production (Morán et al., 2001) which measurements are based on the incorporation of radioisotope 14C during the photosynthesis (Steeman Nielsen 1952). Studies describing the dynamic of PDOC indicated higher contribution of the fraction of PDOC with regard to the total primary production, termed the Percentage of Extracellular Release (PER), in oligotrophic waters and a decreased of the percentage of PDOC in more productive waters (Teira et al., 2001; Morán et al., 2002). However, the quantification of DOC production by phytoplankton and its relative proportion to total primary production in oceans remains poorly documented but needed to estimate the contribution of the phytoplankton cell death to the release of PDOC in marine ecosystems. 10.
(21) General Introduction. The fate of released dissolved organic carbon Heterotrophic bacteria (HB) play a key ecological role in the cycling of carbon and nutrients in aquatic systems (Cole et al., 1988; Ducklow 2000), as they are major consumers of dissolved organic matter (DOM) in the ocean (Sherr and Sherr, 1994; Azam, 1998). HB recycle organic carbon through respiratory processes, and channel significant amounts of dissolved organic carbon (DOC) to higher levels of the pelagic food webs via the microbial loop (Pomeroy 1974; William 1981; Sherr and Sherr, 1988). The availability of DOC is a major constraint for HB dynamics, influencing a range of processes including HB growth efficiency, respiration or cell activity (Kirchman et al., 1991; Kirchman et al., 2004). Since the dissolved organic fraction is almost exclusively accessible to HB (Azam et al., 1983, Ducklow and Carlson, 1992), the amount of labile DOC released as a result of phytoplankton cell death would benefit this particular bacterial community, fuelling its growth and having a notable impact on food web structure and the fate of the recent photosynthate carbon in the ocean (Kirchman et al., 1991). It exists a common belief that heterotrophic bacteria are strongly dependent on the organic matter synthesized in situ by phytoplankton (Baines & Pace, 1991), consequently the release of the photosynthetate carbon by phytoplankton, that will be the most labile fraction, would represent a major source of organic carbon for bacteria in the ocean, however examination of the consequences of the PDOC released for HB activity and cell health, have received few attention. A high percentage of bacterial cells are either metabolically inactive or dead in natural marine plankton communities (Choi et al., 1996; Smith and del Giorgio, 2003) and the algal-derived carbon that benefits HB processes such as growth (Cole et al., 1988) associated with the potential rapid utilization of this algal-origin organic carbon (Coveney and Wetzel, 1989; Chen and Wangersky, 1996) would probably affect HB viability and should be explored to better understand bacteria processes.. 11.
(22) General Introduction. General goal and outline of the thesis This thesis aimed to in situ document and couple three important but neglected processes: (1) Phytoplankton cells are dying upon encountering adverse environmental conditions; (2) Cell death and lysis would result in the release of the carbon incorporated in the photosynthesis by the phytoplankton as dissolved organic carbon (PDOC); (3) The availability of dissolved organic carbon released by phytoplankton cell mortality may benefit the bacterial community, which will channel this released organic carbon through the microbial food web.. Conceptual scheme: It summarizes the 3 main goals assessed during this thesis and how they couple to respond the general problematic: Facing recent ENVIRONMENTAL STRESS (natural or anthropogenic), how do PHYTOPLANKTON losses by CELL DEATH in natural communities’ affect oceanic CARBON fluxes and MICROBIAL utilization?. 12.
(23) General Introduction. The main objective addressed in this work is to provide quantified information on phytoplankton cell death in natural communities and document the fraction of DOC released by phytoplankton (PDOC) in oceans in order to try to relate it to phytoplankton cell death and microbial responses. This goal will be achieved through specific objectives gathered in three major goals:. Goal 1: To assess the natural plankton populations health status, quantified by estimating living and dead cells in natural communities and to examine its relationships with environmental conditions (chemical and physical). The objective is to better understand the ecological constrains of the natural plankton communities facing a wide range of environmental conditions, identifying thus the major factors influencing their dynamics and assessing the competitive success within the coexisting populations.. Goal 2: To quantify and document the production of dissolved organic carbon (PDOC) by phytoplankton communities within different oceanic systems, and analyze whether phytoplankton cell death could explain the excretion of photosynthate carbon as PDOC.. Goal 3: To explore the implications of the dissolved organic carbon produced by the phytoplankton cells (PDOC) on heterotrophic bacterial community, testing the relationship between the recently released labile PDOC and the viability of HB.. 13.
(24) General Introduction. These three major goals will be illustrated and addressed within the following chapters: Chapter 1 Phyto- and bacterioplankton abundance and viability and their relationship with phosphorus across the Mediterranean Sea (2010) Sébastien Lasternas, Susana Agustí and Carlos M. Duarte. Aquatic Microbial Ecology 60: 175–191. This chapter aims to study the changes in plankton community structure and the variability in health status of the major planktonic populations in a synoptic study across the Mediterranean Sea. Here, we analyse the different nutrient regimes and hydrological conditions across the different sub-basins and straits and examine the distribution and health status of both heterotrophic bacteria and planktonic autotrophs (pico, nano and microphytoplankton). We try to relate the survival success of the different populations in relation to environmental conditions, such as, nutrient limitation, water temperature, and judge their competitive capacity with the coexisting species (Goal 1).. Chapter 2 Phytoplankton community structure during the record Arctic ice-melting summer 2007 (2010) Sébastien Lasternas and Susana Agustí. Polar Biology 33: 1709–1717. In this chapter, we search for changes in the abruptly altered pelagic arctic ecosystem during the record ice-melting in the Arctic observed in summer 2007, by quantifying and analyzing the differences in phytoplankton abundance and community structure. We examine how water salinity and temperature, as a proxy of waters receiving ice-melt, may explain the differences in the phytoplankton communities and other phytoplankton cell properties examined. Goal 1 is tackled by testing the state of phytoplankton cell health by examining the proportion of living v. dead cells. Additionally, we quantify the primary production and its fraction released as dissolved organic carbon (Goal 2).. 14.
(25) General Introduction. Chapter 3 Planktonic community structure and survival success in Antarctic Peninsula waters during Austral summer (2012) Sébastien Lasternas and Susana Agustí. Submitted to Global Change Biology In this study conducted in the Antarctic Peninsula (AP) during the austral summer of 2009, we quantify the percentage of living and dying cells in the heterotrophic and autotrophic plankton communities and explore the variation in the community structure and survival under the environmental variability observed at the AP waters (Goal 1). We also quantify the extracellular release by the production of dissolved organic carbon (PDOC) by phytoplankton and its influence on the bacterial community in an effort to evaluate the carbon fluxes at this part of the warming Southern Ocean (Goals 2&3). Chapter 4 Carbon fluxes forced by anticyclonic mesoscale eddies generated by islands at the subtropical NE Atlantic Ocean (2012) Sébastien Lasternas, Marc Piedeleu, Pablo Sangrá, Carlos M. Duarte and Susana Agustí. Biogeosciences Discussion 9: 10241-10283. The distribution and health status of heterotrophic bacteria and phytoplankton communities are investigate within cyclonic and anticyclonic systems of the Canary eddy fields and compared to similar processes in waters outside the eddies system (Goal 1). We estimate the phytoplankton lysis rates and their relationship with the quantified production of dissolved organic carbon by phytoplankton (PDOC) at the different sites to analyse how eddy structures amplify the magnitude of cell mortality, influence the microbial community and consequently influence carbon fate (Goals 2&3) Chapter 5 Bacterial survival governed by the release of dissolved organic carbon from senescent oceanic phytoplankton. (2012). Sébastien Lasternas and Susana Agustí. Submitted to Proceedings of the National Academy of Sciences Goal 1 is addressed in this chapter by quantifying the percentage of living and dying cells in phytoplankton and bacteria communities across a range of oceanographic conditions, from ultra oligotrophic to highly productive waters in the NE subtropical Atlantic Ocean. Goals 2&3 are also addressed by documenting the proportion of DOC released by phytoplankton and its implication on HB viability, and phytoplankton cell mortality. 15.
(26) General Introduction. Methodological highlights This research focusing in the analysis of natural communities and processes, implied the collection of data from the field during several researches cruises from contrasting oceanic systems. These oceanographic researches provided a great opportunity to confront a variety of communities, and environmental conditions, ranging from cold to warm waters and contrasting nutrient and hydrological regimes (Figure 2). Western sector Arctic Ocean 60 N. Chapter 2 - ATOS-1. NE Atlantic Ocean. Chapter 4 - RODA-1. 30 N. Mediterranean Sea. Chapter 1 - THRESHOLDS. Chapter 5 - RODA-2. EQ. 90 W. 60 W. 30 W. 0. 30 S. 60 S. Antartida Peninsula Chapter 3 - ATOS-2. Southern Ocean Fig.2. Oceanic areas studied and sampling stations occupied during the various cruises. 16. 30 E. 60 E.
(27) General Introduction. To achieve the objectives of our research, we applied recent approaches to quantify cell death in natural planktonic communities encountered during the oceanic cruises we participated. These approaches consisted in testing cell membrane permeability, as this property is used to define cell death in Cell Biology (Alberts et al., 1998). The membrane in healthy cells is selectively permeable, regulating what enters and exits the cell, thus facilitating the transport of materials needed for survival (Alberts et al., 1998). Any alteration of the membrane that compromise the permeability would lead to the cell to die with no possible recovery as the process is irreversible (Ellis et al., 1991; Alberts et al., 1998). We utilized two distinct techniques suitable for the study of both autotrophs and heterotrophs. The cell digestion assay (CDA) developed by Agustí and Sánchez (2002) is a technique used to identify dead or dying phytoplankton cells in natural communities. Originally applied in the field of Cell Biology (Darzynkiewicz et al., 1994), this approach aims in characterizing the dead (necrotic or advanced apoptotic) cells that increasing the membrane permeability have lost their ability to maintain homeostasis (Wyllie et al., 1980; Ellis et al., 1991; Darzynkiewicz et al., 1994). The procedure involves the brief exposure of the natural cells to an enzyme cocktail (Trypsin and DNase I). Compromised plasma membranes (i.e. necrotic or advanced apoptotic cells) can lose their physical barrier properties and permit the free passage of enzymes into the cells’ cytoplasm, resulting in the total digestion of the senescent or dead cells. Therefore, this technique allows quantification of living cells remaining in the sample after the CDA test. This technique is as valid in classic or epifluorescence microscopy as in flow cytometry discarding any possible confusion with the autofluorescency of the phytoplankton cells, as opposed to the utilization of staining methods. The nucleic acid double staining (NADS) method of Gregori et al. (2001) is an accurate technique for discriminating living from dead bacterial cells. This method involves the use of two stains with distinct properties. The SyBR Green (DNA-binding stain) is able to stain, indifferently, viable or dead heterotrophic bacteria. Propidium Iodide (PI) specifically penetrates cells with compromised membrane integrity, hence staining the dead HB. In addition to its simplicity, this double staining method, largely used in natural samples, provides clear fluorescent signals in cytometer that may not be perceived when using a single stain method.. 17.
(28) General Introduction. References Agustí S (2004) Viability and niche segregation of Prochlorococcus and Synechococcus cells across the central Atlantic Ocean. Aquatic Microbial Ecology 36:53–59 Agustí S, Duarte CM (2000) Experimental induction of a large phytoplankton bloom in Antarctic coastal waters. Marine Ecology Progress Series 206:73–85 Agustí S, Duarte CM (2012) Phytoplankton lysis predicts dissolved organic carbon release in marine plankton communities. Submitted to Biogeosciences. Agustí S, Duarte CM, Vaqué D, Hein M, Gasol JM, Vidal M (2001) Food-web structure and elemental (C, N and P) fluxes in the eastern tropical North Atlantic. Deep Sea Research Part II: Topical Studies in Oceanography 48:2295–2321 Agustí S, Sánchez MC (2002) Cell viability in natural phytoplankton communities quantified by a membrane permeability probe. Limnology and Oceanography 47:818–828 Agustí S, Satta MP, Mura MP, Benavent E (1998) Dissolved esterase activity as a tracer of phytoplankton lysis: evidence of high phytoplankton lysis rates in the Northwestern Mediterranean. Limnology and Oceanography 43:1836–1849 Alberts B, Bray D, Johnson A, Lewis N, Raff M, Roberts K, Water P (1998) Essential cell biology: An introduction to the molecular biology of the cell. Garland Publishing Inc., New York Alonso-Laita P, Agustí S (2006) Contrasting patterns of phytoplankton viability in the subtropical NE Atlantic Ocean. Aquatic Microbial Ecology 43:67–78 Alonso-Sáez L, Gasol JM, Arístegui J, Vilas JC, Vaqué D, Duarte CM, Agustí S (2007) Large-scale variability in surface bacterial carbon demand and growth efficiency in the subtropical Northeast Atlantic Ocean. Limnology and Oceanography 52:533–546 Alonso-Sáez L, Gasol JM, Lefort T, Hofer J, Sommaruga R (2006) Effect of natural sunlight on bacterial activity and differential sensitivity of natural bacterioplankton groups in Northwestern Mediterranean coastal waters. Applied Environmental Microbiology. 72:5806–5813 Atkinson D, Ciotti BJ, Montagnes DJS (2003) Protists decrease in size linearly with temperature: ca. 2.5%°C−1. Proceedings of the Royal Society of London. Series B: Biological Sciences 270:2605–2611 Azam F (1998) Oceanography: microbial control of oceanic carbon flux: the plot thickens. Science 280:694–696 Azam F, Fenchel T, Field J, Gray J, Meyer L, Thingstad F (1983) The ecological role of water column microbes in the sea. Marine Ecology Progress Series 10:257–263 Berges JA, Falkowski PG (1998) Physiological stress and cell death in marine phytoplankton: induction of proteases in response to nitrogen or light limitation. Limnology and Oceanography 43:129–135 18.
(29) General Introduction. Brussaard CPD, Riegman R, Noordeloos AAM, Cadée GC, et al. (1995) Effects of grazing, sedimentation and phytoplankton cell lysis on the structure of a coastal pelagic food web. Marine Ecology Progress Series 123:259–271 Cermeño P, Dutkiewicz S, Harris RP, Follows M, Schofield O, Falkowski PG (2008) The role of nutricline depth in regulating the ocean carbon cycle. Proceedings of the National Academy of Sciences 105:20344–20349 Chan AT (1978) Comparative physiological study of marine diatoms and dinoflagellates in relation to irradiance and cell size. I. Growth under continuous light. Journal of Phycology 14:396–402 Chen W, Wangersky PJ (1996) Rates of microbial degradation of dissolved organic carbon from phytoplankton cultures. Journal of plankton research 18:1521–1533 Cole JJ, Findlay S, Pace ML (1988) Bacterial production in fresh and saltwater ecosystems: a cross-system overview. Marine Ecology Progress Series 43:1–10 Coveney MF, Wetzel RG (1989) Bacterial metabolism of algal extracellular carbon. Hydrobiologia. 173:141-149 Darzynkiewicz Z, Li X, Gong J (1994) Assays of cell viability: discrimination of cells dying by apoptosis. In Darzynkiewicz Z, Robinson JP, Crissman HA (eds.) Methods in cell biology. Academic Daufresne M, Lengfellner K, Sommer U (2009) Global warming benefits the small in aquatic ecosystems. Proceedings of the National Academy of Sciences 106:12788–12793 del Giorgio PA, Gasol JM, Vaqué D, Mura P, Agustí S, Duarte CM (1996) Bacterioplankton community structure: protists control net production and the proportion of active bacteria in a coastal marine community. Limnology and Oceanography 41:1169– 1179 Ducklow H (2000) Bacterial production and biomass in the oceans. In Kirchman DL (Ed) Microbial Ecology of the Oceans. Wiley-Liss, New York 85–120 Ducklow HW, Carlson CA (1992) Oceanic bacterial production. Advances in microbial ecology 12:113–181 Dugdale RC (1967) Nutrient limitation in the sea: dynamics, identification, and significance. Limnology and Oceanography 12:685–695 Ellis RE, Yuan J, Horvitz HR (1991) Mechanisms and functions of cell death. Annual Review of Cell Biology 7:663–698 Falkowski PG, Barber RT, Smetacek V (1998) Biogeochemical controls and feedbacks on ocean primary production. Science 281:200–206 Falkowski PG, Scholes RJ, Boyle E, Canadell J et al. (2000) The global carbon cycle: a test of our knowledge of earth as a system. Science 290:291–296 Falkowski PG, Raven JA (2007) Aquatic Photosynthesis. Princeton University Press 19.
(30) General Introduction. Field CB, Behrenfeld MJ, Randerson JT, Falkowski PG (1998) Primary production of the biosphere: integrating terrestrial and oceanic components. Science 281:237–240 Gasol J, Pinhassi J, Alonso-Sáez L, Ducklow H, Herndl GH, Koblízek M, Labrenz M, Luo Y, Morán XAG, Reinthaler T, Simon M (2008) Towards a better understanding of microbial carbon flux in the sea. Aquatic Microbial Ecology 53:21–38 Gasol JM, Alonso-Sáez L, Vaqué D, Baltar F, Calleja ML, Duarte CM, Arístegui J (2009a) Mesopelagic prokaryotic bulk and single-cell heterotrophic activity and community composition in the NW Africa-Canary islands coastal-transition zone. Progress In Oceanography 83:189–196 Gasol JM, Vázquez-Domínguez E, Vaqué D, Agusté S, Duarte CM (2009b) Bacterial activity and diffusive nutrient supply in the oligotrophic central Atlantic Ocean. Aquatic Microbial Ecology 56:1–12 Grégori G, Citterio S, Ghiani A, Labra M, Sgorbati S, Brown S, Denis M (2001) Resolution of viable and membrane-compromised bacteria in freshwater and marine waters based on analytical flow cytometry and nucleic acid double staining. Applied and Environmental Microbiology 67:4662–4670 Hopkinson CS, Vallino JJ (2005) Efficient export of carbon to the deep ocean through dissolved organic matter. Nature 433:142–145 Karl DM, Hebel DV, Bjorkman K, Letelier RM (1998) The role of dissolved organic matter release in the productivity of the oligotrophic North Pacific Ocean. Limnology and Oceanography 43:1270–1286 Kirchman DL, Dittel AI, Findlay SE, Fischer D (2004) Changes in bacterial activity and community structure in response to dissolved organic matter in the Hudson river, New York. Aquatic Microbial Ecology 35:243–257 Kirchman DL, Suzuki Y, Garside C, Ducklow HW (1991) High turnover rates of dissolved organic carbon during a spring phytoplankton bloom. Nature 352:612–614 Litchman E (1998) Population and community responses of phytoplankton to fluctuating light. Oecologia 117:247–257 Llabrés M, Agustí S (2006) Picophytoplankton cell death induced by uv radiation: evidence for oceanic Atlantic communities. Limnology and Oceanography 51:21–29 Mével G, Vernet M, Goutx M, Ghiglione JF, others (2008) Seasonal to hour variation scales in abundance and production of total and particle-attached bacteria in the open NW Mediterranean Sea (0-1000 m). Biogeosciences 5:1573–1586 Morán XAG, Gasol JM, Pedrós-Alió C, Estrada M (2002) Partitioning of phytoplanktonic organic carbon production and bacterial production along a coastal-offshore gradient in the NE Atlantic during different hydrographic regimes. Aquatic Microbial Ecology 29:239–252 20.
(31) General Introduction. Muhling M, Fuller NJ, Millard A, Somerfield PJ, et al. (2005) Genetic diversity of marine Synechococcus and co-occurring cyanophage communities: evidence for viral control of phytoplankton. Environmental Microbiology 7:499–508 Myklestad S (2000) Marine chemistry. In: Wangersky P (ed) Marine Chemistry. Springer, Berlin - Heidelberg 111–148 Nagata T (2000) Production mechanisms of dissolved organic matter In Kirchman DL (Ed) Microbial Ecology of the Oceans. Wiley-Liss, New York 121-152 Platt T, Rao DVS, Irwin B (1983) Photosynthesis of picoplankton in the Oligotrophic Ocean. Nature 301:702–704 Platt T, Sathyendranath S, Ulloa O, Harrison WG, Hoepffner N, Goes J (1992) Nutrient control of phytoplankton photosynthesis in the Western North Atlantic. Nature 356:229– 231 Pomeroy LR (1974) The Ocean’s Food Web: A Changing Paradigm. BioScience 24 :499504 Sabine CL, Feely R, Gruber N, Key RM et al. (2004) The Oceanic Sink for Anthropogenic CO2 Science 305:367-371 Sarmiento JL, Gruber N, Brzezinski MA, Dunne JP (2004) High-latitude controls of thermocline nutrients and low latitude biological productivity. Nature 427:56–60 Schumann R, Schiewer U, Karsten U, Rieling T (2003) Viability of bacteria from different aquatic habitats. II. Cellular fluorescent markers for membrane integrity and metabolic activity. Aquatic microbial ecology 32:137–150 Sherr EB, Sherr BF (1988) Role of microbes in pelagic food webs: a revised concept. Limnology and Oceanography 33:1225–1227 Sherr EB, Sherr BF (1994) Bacterivory and herbivory: key roles of phagotrophic protists in pelagic food webs. Microbial Ecology 28:223–235 Smetacek (1999) Diatoms and the ocean carbon cycle. 150:25–32 Suttle CA, Stockner JG, Shortreed KS, Harrison PJ (1988) Time-courses of size-fractionated phosphate uptake: Are larger cells better competitors for pulses of phosphate than smaller cells?. Oecologia 74:571–576 Veldhuis M, Kraay G, Timmermans K (2001) Cell death in phytoplankton: correlation between changes in membrane permeability, photosynthetic activity, pigmentation and growth. European Journal of Phycology 36:167-177 Williams PJ leB (1981) Incorporation of microheterotrophic processes into the classical paradigm of the planktonic food web. Kiel Meeresforsch 5:1-28. Wyllie AH, Kerr JF, Currie AR (1980) Cell death: the significance of apoptosis. International review of cytology 68:251–306 21.
(32)
(33) 1. Phyto- and Bacterioplankton abundance and viability across the Mediterranean Sea. Chapter 1. Phyto- and Bacterioplankton abundance and viability and their relationship with phosphorus across the Mediterranean Sea. Sébastien Lasternas, Susana Agustí and Carlos M. Duarte (2010) Aquatic Microbial Ecology 60: 175–191. 23.
(34)
(35) 2. Phytoplankton community structure during the record arctic ice-melting of summer 2007. Chapter 2. Phytoplankton community structure during the record arctic ice-melting of summer 2007. Sébastien Lasternas, Susana Agustí (2010) Polar Biology 33: 1709–1717. 61.
(36)
(37) 3. Planktonic community structure and survival in warming Antarctic waters. Chapter 3. Planktonic community structure and survival success in warming Antarctic Peninsula waters during Austral summer. Sébastien Lasternas and Susana Agustí (2012) Submitted to Global Change Biology. 83.
(38) Chapter 3. 84.
(39) 3. Planktonic community structure and survival in warming Antarctic waters. Abstract During the austral summer 2009, the composition and survival success of autotrophic and heterotrophic planktonic communities of the Antarctic Peninsula (AP) were examined across the waters of the Bellingshausen Sea, the Bransfield Strait and the Weddell Sea. Changes in phytoplankton biomass and productivity (chlorophyll a and primary production measurements) at the AP waters as well as the release of dissolved organic carbon by phytoplankton (PDOC) were also examined in this study. The picophytoplankton fraction was little representative, contributing to 3.3 ± 0.9 % (mean ± SE) of the total autotrophic biomass. Larger phytoplankton (diatoms and dinoflagellates) dominated at the most productive stations at the Weddell Sea (40.6 mg C mg-3 h-1 maximum total primary production) while the contribution to total phytoplankton biomass of the small autotrophic flagellates (Cryptomonas sp.) increased at the others stations. Both heterotrophic and autotrophic picoplankton communities presented similar thermal preferences for warmer temperature, as indicated by increasing survival success of the populations with increasing water temperature. The increasing contribution of Cryptophytes to total phytoplankton biomass was significantly related to the increasing water temperature, identifying the changes in water temperature as a strong factor in structuring the natural phytoplankton population of the AP. Cryptophytes and larger phytoplankton presented distinct ecological preferences inferred from the examination of the proportion of dead cells (%DC) of both Cryptophytes and large phytoplankton (diatoms + dinoflagellates) population. The mixing regime encountered at the Bransfield strait tended to exclude large phytoplankton, as indicated by the highest diatoms %DC (up to 66%DC) and favoured their relative contribution to and Cryptophytes that here presented highest survival. Phytoplankton mortality (particularly Cryptophytes’) was identified as a major process explaining the release dissolved organic carbon by phytoplankton (PDOC). The increasing Cryptophytes dominance along with the decline of the larger primary producers (e.g diatoms) attributed to the warming of the Antarctic waters provides indications of major changes in phytoplankton community structure and in carbon flow with the already evidenced warming in the Southern Ocean.. 85.
(40) Chapter 3. Introduction The Polar regions are experiencing rapid climatic changes (IPCC 2007; Steig et al., 2009) and the Antarctic Peninsula (AP) has been identified as the area experiencing the higher warming in Antarctica (Steig et al., 2009). Marine ecosystem changes associated to warming effects have been evidenced (e.g. Smetacek and Nicol, 2005; Agustí et al., 2010) in polar regions. For the Antarctic Peninsula, there are reports of consistent changes in the planktonic ecosystem, with a decrease in the occurrence of large phytoplankton blooms (Montes-Hugo et al., 2009) and shifts in the planktonic community structure (Moline et al., 2001) from diatoms to small phytoplankton cells (in this case often Cryptophytes) (Moline and Prezelin, 1996; Moline et al., 2004; Montes-Hugo et al., 2008) and consequently from krill to salps (Atkinson et al., 2004; Smetacek and Nicol, 2005). Warming in the Antarctic region triggered environmental changes such as rising water temperature (Burrows et al., 2011), decreases in ice extent and duration (Chen et al., 2009), modifying the ice melting extension and affecting the water masses circulation and mixing regime (Vaughan et al., 2003). The depth of the upper-mixed layer (UML) has a large influence on the photosynthetic capacity in Antarctic waters (Helbing et al., 1994) and has been identified as key factor for phytoplankton blooms in the Antarctic Peninsula (Boyd 2002; Vernet et al., 2008; Montes-Hugo et al., 2009) with high phytoplankton biomass and production associated to adequate light availability and shallow UML (Mitchell and HolmHansen, 1991; Mura et al., 1995; Vernet et al., 2008). Light irradiance, has been reported to strongly control phytoplankton biomass with induction of large phytoplankton blooms up to 35 µg Chl a L-1 under improved light in-situ mesocosms in the Antarctic Peninsula (Agustí and Duarte, 2000). Warming is also expected to have important direct impacts on picoplankton communities as a significant increase in the contribution of picoplankton to autotrophic biomass and production has been evidenced under higher thermal conditions (Agawin et al., 2000), as well as signs of bacterial processes intensification (growth rates and production) have been described associated to the regional warming at the Antarctic Peninsula (Kirchman et al., 2009; Ducklow et al., 2010). Beside the response at community levels, supplemental studies addressing the straight effect of temperature on plankton population and species focused on allometric relationships, as reduction of population size species has been regarded as one of the main ecological response to global warming in aquatic ecosystem (Daufresne et al., 2009) and shift in community towards small-size species has been foreseen in a warmer ocean (Atkinson et al., 2003; Morán et al., 2010). 86.
(41) 3. Planktonic community structure and survival in warming Antarctic waters. Changes in the phytoplanktonic community are difficult to investigate since they could whether be caused by the environmental modifications associated to warming or be attributed to direct metabolic response of single-cell to temperature (Finkel et al., 2010) modifying the physiological status of individual cells. The evaluation of the cell health status in plankton communities has been used recently to examine the status of the natural populations under in situ environmental conditions (Agustí 2004; Gasol et al., 2008). The quantification of the living and dead cells of both heterotrophs and autotrophs population constitute a relevant approach to identify the stressors drifting population dynamics in different oceanic areas (e.g. Grégori et al., 2001; Agustí and Sanchez, 2002) allowing to identify the tolerance and ecological niche of populations in response to changes in nutrients availability or temperature (Alonso-Laita and Agustí, 2006; Lasternas et al., 2010; Lasternas and Agustí, 2010). In this study, besides the description of the plankton communities’ and production distribution, we examined the survival success of the natural planktonic components, mediating the quantification of the percentage of living and dead phytoplankton and heterotrophic bacteria cells under the changes in hydrological properties associated to increasing temperature. We aimed so to evaluate the survival success and ecological preferences of the natural populations in response to the changing environmental conditions at the warming Antarctic Peninsula. Moreover, phytoplankton mortality is perceived to be one of the important carbon loss processes (Proctor and Fuhrman, 1991; Nagata 2000) affecting carbon fluxes since phytoplankton cells death result in the extracellular release of the dissolved organic carbon (PDOC) recently assimilated during the photosynthesis (Myklestad 1977; Sharp 1977). Therefore, we quantified the extracellular production of dissolved organic carbon (PDOC) by phytoplankton and explore the relationship between phytoplankton cell mortality with (PDOC) in order to address the modification of the carbon fluxes in response to recent changes in water masses and temperature at the Antarctic Peninsula.. 87.
(42) Chapter 3. Material and Methods Water sampling and planktonic communities The study was carried out during the ATOS-Antarctica oceanographic cruise from 26th January to 28th February 2009, aboard the Spanish Oceanography Research vessel Hespérides. 28 stations were sampled across three oceanographic regions around the Antarctic Peninsula, the Bellingshausen Sea, the Bransfield Strait and the Weddell Sea (Fig. 1). At each station, vertical profiles of temperature, salinity, and fluorescence were performed using a Seabird 911 CTD. Water samples were collected using 12 L Niskin bottles attached to a Rosette-CTD system, at 5 to 6 depths, from subsurface waters (5m) to mid-depth waters, generally 70 to 100 m, below the deep chlorophyll maximum (DCM) located between 12 and 50 m (28.2 ± 3.2 m, mean ± SE). Additional samples from 1 m depth were taken using 30 L Niskin bottles. Profiles of CTD data were used to calculate the thickness of the upper mixed layer (UML), an index of the stability of surface water column, as the shallowest depth at which st (water density) differs from surface values by more than 0.05 kg m- 3 (Mitchell and Holm-Hansen, 1991).. 3 2 62• S. 13. 1. 11. 26. 10. Bransfield Strait. 4. 27 9. 29. pe. 15. la. go. 12. 5. rc. hi. 6. er. A. 64• S. 8. lm 24. Pa. 25. 14. 28 7. 16. Antarctic Peninsula. Bellinghaussen Sea. 66• S. 23. 17. Weddell Sea. 22. 68• S. 20. 19. 75• W. 18. 70• W. 65• W. 60• W. 55• W. Fig.1. Areas of study and sampling stations occupied during the ATOS 2 cruise in the Antarctic Peninsula sector. Numbers represent the different sampling stations 88.
(43) 3. Planktonic community structure and survival in warming Antarctic waters. Underwater light (photosynthetically active radiation, PAR) was measured at each station from the surface to 200 m depth using a PUV-2500 profiling radiometer (Biospherical Instruments) fitted with a PAR (400–700 nm) sensor. The percentage of light received at the different sampling depths was calculated from linear regressions of the natural logarithmic downwelling irradiance against depth, relative to the light received at 1 m depth. Chlorophyll a concentration was determined fluorometrically by filtering 200 ml of water through Whatman GF/F filters, and extracted in 90% acetone for 24h before spectrofluorometric determination using a Shimadzu RF-5301PC spectrofluorometer following Parsons et al. (1984). Primary production measurements were assessed by the 14C technique (Steeman-Nielsen 1952). Seawater initially sampled at 5 depths including the surface (5 m), two intermediate depths, the DCM and an ultimate depth below the DCM, was delivered into transparent (light) and black masking tape-covered polycarbonate bottles (150 ml), and inoculated with 80 µCi activity of a NaH14CO3 working solution. Inoculated bottles were set up at respective depths along a mooring buoy and thereby incubated in situ for 4 hours. For each sample, two aliquots of 5 ml (replicates) were introduced in scintillation vials (20 ml) for the determination of total labelled organic carbon production (TPP); the sum of 14C incorporated into POC (particulate organic carbon) and released as DOC (dissolved organic carbon). The remaining volume was filtered through 0.22 µm mesh membrane filters (cellulose membrane filters) of 25 mm diameter to determine particulate primary production (PPP > 0.22 µm). To remove inorganic 14C, the liquid samples were acidified with 100 µl of 10% HCl and shacked for 12h, while the filters were fumed with concentrated HCl (37%) for 12h. Then, 10 ml and 5 ml of scintillation cocktail (Packard Ultima Gold XR) were respectively added to TPP and PPP vials and the disintegrations per minute were counted after 24 h with a scintillation counter (EG&G/Wallac). The dissolved organic carbon production by phytoplankton (PDOC) was calculated as the difference between total and particulate primary production. The percentage of the extracellular production released by phytoplankton (PER) was calculated as the ratio between (PDOC / TPP) x 100.. 89.
(44) Chapter 3. The quantification and determination of the phytoplankton communities in our samples were performed using two procedures. For quantification of the larger phytoplankton cells (>2µm in diameter) abundance, samples were collected at the surface (1 m) and the deep chlorophyll maximum (DCM). Water samples of 2-3 litres from 1 m and at the depth of DCM were concentrated to 50-70 ml samples by using a Millipore concentrator stirred cell (Agustí and Sánchez, 2002). The time for the concentration procedure was short, less than 30 minutes, and a gentle pressure was applied over the sample to avoid any damage of the cells as recommended in previous studies (Agustí and Sánchez, 2002; Lasternas and Agustí, 2010) with accurate results for phytoplankton, with no effect on the viability or other cell properties (e.g. movement for flagellated cells, integrity of frustules). Ten ml aliquots (duplicates) of the concentrated sample were filtered onto 2 µm pore-size black polycarbonate filters, fixed with gluteraldehyde (1 % final concentration) and stored frozen at – 80°C until counting. Phytoplankton cells (>2µm) were counted using an epifluorescence microscope (Zeiss© Axioplan Imaging) and classified into 3 majors groups, nanoflagellates, dinoflagellates and diatoms that belong over two phytoplankton size-classes (2-20µm / >20µm). Diatoms species were further grouped into pennate and centric forms while dinoflagellates were separated into armoured and naked forms. The average cell volume for each phytoplankton group identified during the study was computed, using the geometrical approximation of their forms (Sun and Liu, 2003) so biovolume (µm3 l-1) of the different phytoplankton groups in each sample was calculated as the product of the cell density (cell l-1) by average cell volume (µm3 cell-1). The abundance and cell-size calculation of smaller phytoplankton cells were assessed using flow cytometry. Size calibration was established with two fluorescent Plain Microspheres (Polysciences, Inc.) of 1.0 and 2.0 µm in diameter and with two marine isolates, Micromonas sp. and Chlorella sp. (1.4 and 3.2 µm, respective diameter). Diameter was a logarithmical function of forward scatter intensity (FSCH) following the equation: Diameter = – 4.2 (± 0.2) + 3.2 (± 0.1) x Log (FSCH) (R2 = 0.99, P = 0.001).. 90.
(45) 3. Planktonic community structure and survival in warming Antarctic waters. Biovolume of the smaller cells (<2µm) were calculated as the product of cell density (cell l ) by average spherical equivalent cell volume (µm3 cell l-1). At each station, duplicated 2 ml fresh samples from 6 depths were counted onboard (duplicated counts) using a FACSCalibur flow cytometer (Beckton Dickinson). An aliquot of a calibrated solution of 1 µm diameter fluorescent beads (Polysciences) was added to the samples as an internal standard for the quantification of cell concentration. Red (FL3, bandpass filter>670 nm), green (FL1, bandpass filter 530 nm) and orange (FL2, bandpass filter 585 nm) fluorescence as well as the forward and side scattering signals of the cells and beads were used to detect phytoplanktonic populations (Marie et al., 2005). -1. Population survival success The quantification of the proportion of dead cells in the phytoplankton communities was conducted on board in fresh samples using a cell digestion assay (CDA), which tests cell membrane permeability (Agustí and Sánchez, 2002). The CDA requires that the phytoplankton communities are subjected to an enzymatic cocktail (DNAse and Trypsin) that enters the cytoplasm and digests cells with compromised membranes, i.e. removing dead cells from the sample. Cells remaining in the samples after the CDA are the living cells, which can then be quantified using epifluorescence microscopy or cytometry. The CDA was applied to the prepared concentrates of nano- and microphytoplankton cells (2 to > 20µm) to quantify total cell abundance. Specifically, the CDA was applied to duplicated 10 ml aliquots of cell concentrate by adding 2 ml of DNAse I solution (400 µg ml–1 in Hanks’ Balanced Salt Solution [HBSS]), followed by 15 min incubation at 25°C in a Digital Dry Bath (Labnet©). After this time, 2 ml of Trypsin solution (1% in HBSS) were added, followed by 30 min incubation at 25°C (Llabrés and Agustí, 2008). 25 ºC was recommended by Llabrés and Agustí (2008) as the optimal temperature to run the assay with polar species, as this temperature alleviated the problems derived by the thermal difference with in-situ temperature, and assured the complete digestion of dead cells. At the end of the second incubation, samples were then placed in ice to stop the enzymatic cell digestion process and then were filtered onto polycarbonate 2 µm pore diameter black filters, washed several times with filtered seawater, fixed with glutaraldehyde (1% final concentration) and stored frozen at – 80°C until counting by epifluorescence microscopy.. 91.
(46) Chapter 3. Fresh samples to quantify the proportion of dead cells for the smallest phytoplankton were sampled from the 6 same depths selected to estimate total abundance at each station. Duplicated 1 ml samples were run with the CDA, by first adding 200 µl of DNAse I solution and then, after 15 min incubation at 25°C, 200 µl of Trypsin solution. Treated samples were incubated for 30 min at 25°C and were finally placed in ice to cease enzymatic activity. Samples were then counted by flow cytometry as described before. The percentage of dead cells (%DC) was calculated as the ratio between the concentrations of dead cells, to the total phytoplankton population observed in the blanks (live and dead cells). At each station, the abundance and the proportion of living heterotrophic bacteria were quantified from seawater sampled at 6 depths. To do so, we used the Nucleic Acid Double Staining (NADS, Gregori et al., 2001) flow cytometric protocol. This technique consists on the use of two nucleic acid fluorescent dyes, SYBR Green I (SG1; Molecular Probes) and Propidium Iodide (PI; Sigma Chemical Co.). Bacterial membranes are permeable to SG1, whatever the cell viability, resulting in green fluorescence when stained. However, living or viable cells, with intact plasmic membranes, are impermeable to PI. Thus only compromised or damaged cells are stained with PI (Barbesti et al., 2000), showing red fluorescence as described in Falcioni et al., (2008). Subsamples were analyzed immediately after collection. Samples (1ml) were stained with 10 µl of Propidium iodide (PI, 1 mg ml–1 stock solution), reaching a final concentration of 10 µg ml–1 and incubated for 30 minutes in dark and room temperature. Then, 10 µl of SYBR Green I (10-fold dilution of 10000×commercial solution in dimethyl sulfoxide) were added to subsample and incubated for 10 more minutes. SG1 and PI fluorescence were detected using a FACSCalibur Flow Cytometer (Beckton Dickinson©) in the green (FL1) and the red (FL3) cytometric channels, respectively. Bivariate plots of green versus red fluorescence (FL1 vs. FL3) allowed discriminating live (green fluorescent, impermeable to PI) from dead cells (red fluorescent membrane-compromised cells, stained by PI and SG1). Bacteria concentration was calculated using a 1-µm diameter fluorescent bead (Polysciences Inc.) solution as an internal standard. Total heterotrophic bacterial abundance, in cells ml-1, was calculated as the sum of red and green fluorescent cell abundance, while dead bacterial cell abundance was determined from the red fluorescent cell counts (PI stained). The percentage of dead heterotrophic bacteria was calculated as the ratio between the concentration of damaged-membrane bacteria stained with PI and total bacterioplankton abundance.. 92.
(47) 3. Planktonic community structure and survival in warming Antarctic waters. Statistics The different parameters were averaged by 3 oceanographic regions (Bellingshausen Sea, Bransfield Strait and the Weddell Seas), and the statistical significance of the differences between average values were tested using Student’s t-test, with a critical p-value of <0.05. Data on temperature, production, PER, population biovolume and viability were grouped by 0.5ºC temperature bins and by 10% PER bins to search for patterns. The analysis of correlation between variables that departed from normality was performed using the Spearman’s rank coefficients (rs) (Siegel and Castellan 1988). Linear regression analyses were applied to raw data and binned data. Means are presented ± SE throughout.. Results Waters features During the study, stations were sampled across the Bellingshausen Sea, the Bransfield Strait and the Weddell Sea (Fig. 1) and encompassed the water masses usually found at the vicinity of the Antarctic Peninsula (Capella et al., 1992; Mura et al., 1995). Cold and saline waters, originated in the Weddell Sea (-0.75ºC/34.5 PSU), converged with less salty waters, from the Bellingshausen Sea (2.75ºC/33 PSU) at the Bransfield strait that corresponds to a transient system ranging values from both seas (Capella et al., 1992). The upper mixed layer (UML) ranged from 5.9 m up to more than 200 m. Mixed water conditions were observed at the Bransfield area while the stratification was stronger established at stations of the Weddell Sea (Stns. #5-6-7-8), in the vicinity of the Palmer Archipelago (Stn. #24) and at southern stations of the west peninsula (Stns. #18-19).. 93.
(48) Chapter 3 Fig.2. Distribution of the chlorophyll a concentration by stations across the study (BrS: Bransfield Strait- WS: Weddell Sea- BS: Bellingshausen Sea). The most productive waters were found at the Weddell Sea (Stns. #7-8) and at the vicinity of the Palmer Archipelago (stns. #24-25) contrasting to less productive waters from the Bellingshausen region (Fig. 2). Higher chlorophyll a concentrations were associated to stratified waters as indicated by the exponential distribution of chlorophyll a by UML (Fig. 3). Chlorophyll a -3. (mg Chl a m ). Fig.3. The relationship between the upper mixed layer depth and the maximum chlorophyll a concentration at each station. 0 0. Upper mixed layer (m). 50. 100. 150. 200. 94. 5. 10. 15. 20. 25. 30. 35.
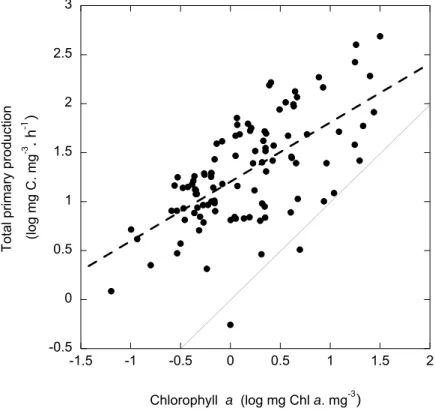
(49) 3. Planktonic community structure and survival in warming Antarctic waters. The chlorophyll a concentration (Chl a) and total primary production (TPP) rates showed a great variation along the study ranging over 600-fold among stations (respectively ranging from 0.05 to 31.66 mg Chl a mg-3 and from 0.04 to 40.66 mg C mg-3 h-1). Chl a and TPP were significantly and positively related (Fig 4), displaying highest values at stations located in the Weddell Sea area (Stn#7) and both were positively related to water temperatures (rs= 0.25, p< 0.005 and rs= 0.19, p< 0.005 respectively). The primary production rates were dependent on the available light, being positively related to the percentage of PAR received at the depth of sampling (rs= 0.36, p < 0.0001) and negatively to depth (rs= -0.48, p < 0.0001). The percentage of the extracellular carbon released by phytoplankton (PER), averaging 55.4 ± 1.8 % along the cruise, also ranged widely (from 10.3 to 98.9 %) and presented variations independent of the area of sampling (Student’s t-test, p < 0.05) but increasing with depth (rs= 0.49, p < 0.0001), indicated higher fraction of primary production released as dissolved organic carbon at deeper layers. 3. 2. -3. -1. (log mg C. mg . h ). Total primary production. 2.5. 1.5 1 0.5 0 -0.5 -1.5. -1. -0.5. 0. 0.5. 1. 1.5. 2. -3. Chlorophyll a (log mg Chl a. mg ). Fig. 4. The relationship between the chlorophyll a concentration and the total primary production. The solid line shows the 1:1 relationship and the dotted line shows the fitted regression equation: Log TPP = 1.2 + 0.61 (± 0.07) log Chl a (R2 = 0.41, P < 0.0001, N= 105) 95.
(50) Chapter 3. Planktonic biomass and communities distribution Heterotrophic bacteria showed lower biovolume at the Weddell Sea than at the Bellingshausen Sea and Bransfield Strait, which presented similar values (Table 1). Bacterial biovolume was negatively related to depth (Table 2) and higher biovolumes were found associated to warmer waters (Table 2). µm3 l-1 Bellingshausen zone Brandsfield area Weddell Sea area BACTERIOPLANKTON. PHYTOPLANKTON. Total Picophytoplankton Nanophytoplankton Microphytoplankton. 107 108 106 108 Total 108 7 Diatoms 10 Dinoflagellates 107. 2.73 ± 0.24 A 0.97 ± 0.11 AB 1.31 ± 0.14 B 0.57 ± 0.01 B 0.38 ± 0.04 B 1.92 ± 0.62 AB 1.91 ± 0.37 A. 2.43 ± 0.12 A 0.49 ± 0.14 B 2.23 ± 0.41 A 0.31 ± 0.06 B 0.16 ± 0.01 B 0.58 ± 0.21 B 0.96 ± 0.18 A. 1.58 ± 0.08 B 2.38 ± 0.79 A 1.56 ± 0.36 B 1.16 ± 0.48 A 1.20 ± 0.46 A 7.75 ± 0.45 A 4.27 ± 1.66 A. Table 1: Averaged (± SE) biovolume of the planktonic populations among the three oceanographic regions sampled during ATOS-2. Average values for regions connected by different letters are significantly different (p < 0.05). The phytoplankton cells identified in our samples included the three size-classes of pico-, nano- and microphytoplankton. The total biovolume was significantly related to chlorophyll a distribution along the study (Fig. 5), but the distinct phytoplankton size-classes showed contrasting relationships with Chl a. The smallest size-class, represented by a solely picoeukaryotic population (1.3 to 2.1 µm equivalent spherical diameter) was not related to chlorophyll a and contribute only to 3.3 (± 0.9) % of the total autotrophic biovolume. Along the study, the biovolume of the picophytoplankton fraction was positively related to water temperature (Table 2) and negatively to UML (Table 2), indicating the association of picophytoplankton biovolume with warmer and mixed waters, consistent with the maximum biovolume observed at waters sampled at the Bransfield strait (Table 1). Contrarily to picophytoplankton, nano-microphytoplankton groups were strongly related to chlorophyll a (Fig. 5) and presented maximum biovolumes at stations sampled at the Weddell Sea, matching with chlorophyll a and primary production maxima (Fig. 2 and Table 1). The nanophytoplankton group, mostly represented by the nanoflagellate species Cryptomonas sp (11 µm average cell diameter) and the microphytoplankton presented similar dynamics with higher biovolume at stations of the Weddell Sea (Table 1). Diatoms and Dinoflagellates positively related to chlorophyll a (R2 = 0.39, P = 0.002, N= 20) presented an increase in biovolume at stations located at the Weddell Sea area, where diatoms dominated (Table 1). 96.
Figure


+2

Documento similar
similar to previous ones, with 58% of the reser- voirs investigated in which potentially toxic cyanobacteria dominated the phytoplankton community, in 25% of the reservoirs
- Competition for water and land for non-food supply - Very high energy input agriculture is not replicable - High rates of losses and waste of food. - Environmental implications
The results of our study support the latter hypothesis by showing that: i) PD-like pathology progression in vivo depends on cell-to-cell transmission between neurons of the
Collectively, our results highlight the importance of as- sessing cell-particle interactions, in terms of cytotoxicity, uptake, intracellular location and cell type effect of
Otherwise, Fas supresses immune status in normal brain (Choi and Benveniste 2004). Cells of nervous system also exhibit a different susceptibility to Fas-induced cell
P53 or PUMA elimination confers ESCs a winner status, allowing them to eliminate WT cells in co-culture, which indicates that P53 and PUMA activity negatively regulate
Overall, our results suggest that improper regulation of GRK2 in cell cycle might com- promise the fidelity of cell division by means of the rapid progression in G1 and the im-
Two processes, regulation of Rho GTPase activity and programmed cell death have been previously implicated in tarsal joint morphogenesis, and Dysf transcriptionally controls
