Near-infrared photometry and spectroscopy of the low Galactic latitude
globular cluster 2MASS-GC 03
Julio A. Carballo-Bello,
1,2,3‹S. Ram´ırez Alegr´ıa,
1,2‹J. Borissova,
1,2‹L. C. Smith,
4R. Kurtev,
1,2P. W. Lucas,
4Ch. Moni Bidin,
5J. Alonso-Garc´ıa,
2,6D. Minniti,
2,7,8T. Palma,
2,7I. D´ek´any,
2,3N. Medina,
1,2M. Moyano,
5V. Villanueva
1,2and M. A. Kuhn
1,21Instituto de F´ısica y Astronom´ıa, Facultad de Ciencias, Universidad de Valpara´ıso, Av. Gran Breta˜na 1111, Playa Ancha, Casilla 5030, Valapara´ıso, Chile 2Millenium Institute of Astrophysics, Av. Vicu˜na Mackenna 4860, 7820436 Macul, Santiago, Chile
3Instituto de Astrof´ısica, Facultad de F´ısica, Pontificia Universidad Cat´olica de Chile (IA-PUC), Casilla 306, Santiago 22, Chile 4Centre for Astrophysics Research, Science and Technology Research Institute, University of Hertfordshire, Hatfield AL10 9AB, UK 5Instituto de Astronom´ıa, Universidad Cat´olica del Norte, Av. Angamos 0610, Antofagasta, Chile
6Unidad de Astronom´ıa, Facultad de Cs. B´asicas, Universidad de Antofagasta, Av. U. de Antofagasta 02800, Antofagasta, Chile
7Departamento de F´ısica, Facultad de Ciencias Exactas, Universidad Andr´es Bello, Av. Fern´andez Concha 700, Las Condes, Santiago, Chile 8Vatican Observatory, I-V00120 Vatican City State, Italy
Accepted 2016 July 8. Received 2016 July 8; in original form 2015 October 27
A B S T R A C T
We present deep near-infrared photometry and spectroscopy of the globular cluster 2MASS-GC 03 projected in the Galactic disc using MMT and Magellan Infrared Spectrograph on the Clay Telescope (Las Campanas Observatory) and VISTA Variables in the Via Lactea Survey data. Most probable cluster member candidates were identified from near-infrared photometry. Out of 10 candidates that were followed-up spectroscopically, 5 have properties of cluster members, from which we calculate[Fe/H]= −0.9±0.2 and a radial velocity ofvr = −78±12 km s−1. A distance of 10.8 kpc is estimated from three likely RR Lyrae
members. Given that the cluster is currently at a distance of 4.2 kpc from the Galactic Centre, the cluster’s long survival time of an estimated 11.3±1.2 Gyr strengthens the case for its globular-cluster nature. The cluster has a hint of elongation in the direction of the Galactic Centre.
Key words: globular clusters: individual.
1 I N T R O D U C T I O N
Galactic globular clusters (GCs) have played a role in diverse areas of study, from the evolution of stellar populations to the hierarchical formation of galaxies. The current population of known GCs in the Milky Way is composed of∼160 of these systems (Harris2010), although it has long been suggested (e.g. Ashman & Zepf1992) that a fraction of the total number of Galactic GCs might be hidden in lines of sight with high extinction (i.e. disc, bulge) or have intrinsic properties that make them difficult to detect. The search for new Galactic GCs has only returned a small number of the expected missing GCs. Some of these newly identified GCs have properties mid-way between a GC and an ultra-faint dwarf galaxy (Carraro
2005; Willman et al.2005; Koposov et al.2007; Longmore et al.
2011; Mu˜noz et al.2012; Balbinot et al.2013; Laevens et al.2014; Kim et al.2015). Most of these new detections were possible thanks to the arrival of wide-sky photometric surveys such as Sloan Digital
E-mail: [email protected] (JAC-B); [email protected] (SRA);
Sky Survey (York et al.2000), the Two Micron All-Sky Survey (2MASS; Skrutskie et al.2006) and the VISTA Variables in the Via Lactea (VVV) Public Survey (Minniti et al.2010; Saito et al.2012). The latter survey reported the discovery of VVV CL 001 (Minniti et al.2011), VVV CL 002 (Moni Bidin et al.2011) and several other GC candidates (Borissova et al.2014).
It is well known that the Galactic GC system contains a metal-rich subsystem (Zinn1985) which is mainly composed of GCs associ-ated with the Galactic bulge. Among the 13 GCs found with|b|<2◦ (8 per cent of the Galactic population), 11 lie projected on the Galactic bulge, while only two, 2MASS-GC 03 and GLIMPSE 01 (Simpson & Cotera2004; Kobulnicky et al. 2005; Davies et al.
2011), are likely associated with the Milky Way disc. However, the nature of GLIMPSE 01 remains unclear (see Davies et al.2011). In contrast, numerous young cluster candidates have been discov-ered in the Galactic plane using infrared photometry (e.g. Froebrich, Scholz & Raftery2007a; Borissova et al.2011,2014; Solin, Haikala & Ukkonen2014). Therefore, the scarce GCs at low Galactic lati-tudes represent a peculiar population of stellar systems in a region of the Milky Way dominated by the presence of young stellar clusters.
253.125 253.100 253.075 253.050 253.025 253.000 252.975
253.125 253.100 253.075 253.050 253.025 253.000 252.975
-47.0
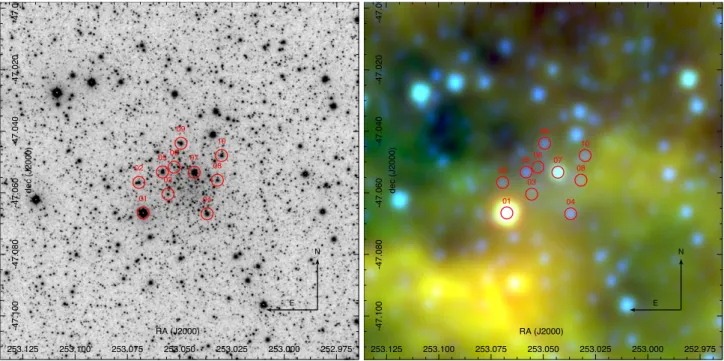
Figure 1. VVVKS(left) and WISE false colour (right) images for GC 03. The red circles show the position of the stars observed spectroscopically. The false colour image was constructed using theWISEfiltersW1 (blue),W2 (green) andW3 (red). The image sizes are 7 arcmin×7 arcmin.
Froebrich et al. (2007a) first identified 2MASS-GC 03 as a lo-cal density enhancement in 2MASS photometry maps, listing it as #1735 (or FSR 1735) in their catalogue. Follow-upJHKs
photome-try of stars associated with that overdensity (Froebrich, Meusinger & Scholz2007b) allowed the authors to suggest that FSR 1735 is actually a GC atd ∼9 kpc, although they point out that a defini-tive determination of the object’s nature would require follow-up observations. A systematic analysis of the cluster was performed by Kharchenko et al. (2013), as a part of a global investigation on the Galactic star-cluster system. Using the 2MASS catalogues and PPMXL Catalogue of Positions and Proper Motions on the ICRS (Roeser, Demleitner & Schilbach2010), they estimated the metal-licity, distance and age of FSR 1735 as [Fe/H]= −0.6,d ∼8.8 kpc andt=9.9 Gyr, respectively. Because of its discovery in 2MASS data, FSR 1735 has the SIMBAD denomination 2MASS-GC 03 and it also corresponds to the candidate number 71 in the Solin et al. (2014) catalogue, which contains new star cluster candidates discovered in the VVV field of view. In this paper, we will use the SIMBAD designation, namely 2MASS-GC 03 or simply GC 03. As it can be seen in Fig.1, we observe a clear overdensity of stars in the VVV Ks-image, but it is not associated with mid-infrared
nebulosity inWISEimages (Fig.1, right-hand panel), confirming the Froebrich et al. conclusion of small amounts of dust and gas in that area.
In this paper, we present deep MMT and Magellan Infrared Spec-trograph (MMIRS) and VVV photometry and low-resolution near-infrared spectroscopy of several stars in order to confirm the glob-ular nature of the cluster GC 03 and derive accurate values for the fundamental parameters that describe that system.
2 O B S E RVAT I O N S A N D DATA R E D U C T I O N
The analysis of GC 03 (RA=16h52m10s.6, Dec.= −47◦0329;
Harris2010) includes near-infrared images and spectra, both ob-tained using the MMIRS (McLeod et al.2012) at the Clay Telescope (Las Campanas Observatory, Chile). The instrument is a wide-field
near-infrared imager and spectrograph. We have complemented our data using the VVVJHKsphotometry.
With the MMIRS, the cluster was observed throughJ andKs
filters, with a total exposure time per filter of 119 s and airmasses between 2.35 and 2.08. We used a dithering pattern with offsets in x-andy-axis of 34 arcsec; these offsets in the images are used later to construct the calibration image for sky subtraction. We reduced the imaging data usingIRAF1tasks (dark subtraction, flat fielding and sky correction) and we usedPYTHONpackage ALIPY2to align the individual reduced images before the final combination.
The point spread function (PSF) photometry was independently derived for each of the images usingDAOPHOT II/ALLSTAR (Stetson
1987). The calibration of the photometric catalogues was performed using the∼1000 stars in common with 2MASS, and we substi-tute 2MASS photometry for objects that are saturated or present other problems in the PSF photometry procedure. The magnitudes obtained from individual images were averaged for the final cata-logue. To estimate completeness, artificial stars were inserted ran-domly throughout the chip in the range 10<Ks< 20 mag, and
these were extracted using the same photometric procedure. The total number of synthetic stars added was designed not to exceed 15 per cent of the number of natural sources. This procedure was performed 50 times for each frame. The average magnitude limits of our catalogues, where the fraction of synthetic stars recovered is the 50 per cent, are 18.6 and 17.6 mag inJandKs, respectively.
To select promising candidates for spectroscopy, we used PSF photometry from the VVV-SkZ pipeline (Mauro et al.2013), an automated software based on ALLFRAME (Stetson1987) and op-timized for VISTA PSF photometry. We usedJ and Ks images
1
IRAF is distributed by the National Optical Astronomy Observatories (NOAO), which is operated by the Association of Universities for Research in Astronomy, Inc. (AURA) under cooperative agreement with the USA National Science Foundation (NSF).
Figure 2. Individual spectra inH(left) andKband (right) for the observed stars. We marked with grey vertical lines the spectral lines used for metallicity and radial velocity estimates.
from the VVV survey (Minniti et al.2010) and replaced the pho-tometry from saturated sources (i.e. brighter thanKs=12), with
2MASS photometry. Position and near-infrared colours and mag-nitudes were used to remove likely contaminants from the photo-metric catalogue using the algorithm of Bonatto & Bica (2010), as described by Borissova et al. (2011). The preliminary decon-taminated colour–magnitude diagram (CMDs) allowed us to select bright (6.56<Ks<11.82) cluster member candidates for
multi-object spectroscopy. We selected 10 stars to observe with a single mask with MMIRS, using theHKgrism, a slit width of 0.4 arcsec and a resolutionR∼1400.
StandardIRAFprocedures were used to de-bias and flat-field the spectra. The 10 one-dimensional spectra were extracted, and the wavelength calibration was obtained using a third-order polynomial fit to∼40 arc lines, resulting in a dispersion of∼6.7 Å pix−1and an rms scatter of 0.4 Å. We corrected the atmospheric absorption lines with MOLECFIT (Kausch et al.2015; Smette et al.2015), a software tool distributed by ESO which uses the information available in the spectra header to model the atmospheric and telescope conditions and the telluric lines during the observations. The resulting spectra are shown in Fig.2.
3 R E S U LT S
The cluster centre was determined with an iterative procedure based on a VVV photometric catalogue of stars brighter thanKs=17.
We first calculated the barycenter of all the sources detected within 1 arcmin from the Froebrich et al. (2007b) coordinates. The point thus found was adopted as new cluster centre, and the calculation iterated. The procedure quickly converged to fluctuations smaller than one pixel (0.33 arcsec) around the values RA=16h52m11s.1, Dec.= −47◦330, which represents our best estimate of the cluster centre. This is only 7.6 arcsec offset from Froebrich et al. (2007b) coordinates.
3.1 Decontaminated CMD
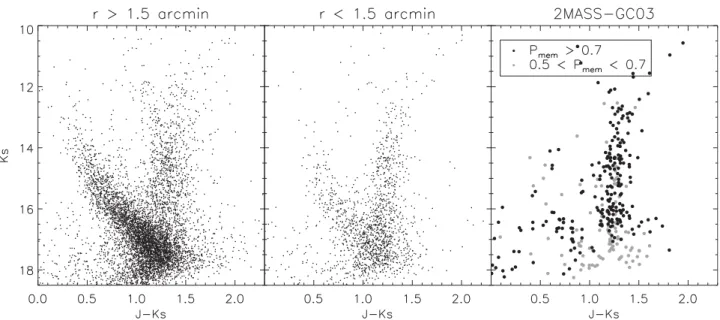
Figure 3. CMDs corresponding to stars beyond and within 1.5 arcmin of the cluster centre (left-hand and middle panels, respectively) and the resulting decontaminated CMD (right-hand panel). The latter panel displays stars with higher probability of membership (Pmem>0.7) as black dots, while stars with lower membership probability (0.5>Pmem>0.7) are shown in grey.
further analysis. The algorithm we use (proposed by Bonatto & Bica2007), is based on a multivariate search for overdensities in theJHKscatalogues. Although the cluster membership cannot be
determined absolutely, the algorithm is rather effective at removing the majority of field stars. As described in more detail in Bonatto & Bica (2007) paper, the algorithm divides the (Ks,J−Ks) colour–
magnitude space into a grid of cells with a cell size provided as input. It estimates the expected number density of cluster stars for each of the cells by subtracting the field stars number density in the same (Ks,J−Ks) ranges and, summing over all cells, it obtains a
to-tal number of candidate starsNmem. The procedure is repeated with the grid shifted in steps of one-third cell width in each dimension, yielding nine different configurations, with nine differentNmem val-ues. Those stars that survive to this process more thanNmemtimes are considered likely members. For this work, we slightly modified the procedure by including a family of cell sizes both forKsand
J−Ksin the range 0.2< δKs<0.6 and 0.1< δ(J−Ks)<0.3.
We generated a list of tentative cluster members derived from 15 iterations, based on the number of times that a star was present in the results. As a final step, we ranked the stars depending on that survival frequency and assigned a probability,Pmemb, to each star based on their frequency of survival. Thus, it is possible to select stars using a differentPmembthreshold for more or less reliable sub-samples. The procedure was applied within a radius of 1.5 arcmin of the cluster centre, which contains, from visual analysis, the greatest density of stars.
Fig.3shows the importance of the decontamination process to obtain useful CMDs. From the initial 1649 sources within 1.5 arcmin from the centre of GC 03 (middle panel), our algorithm found 348 candidate stars for anyPmem value. Focusing on those stars with the highest membership probabilities,Pmem >0.5, the sample of member stars is reduced to 315 sources.
As shown in Fig.3, the decontaminated CMD shows a well-defined red giant branch (RGB) in the range 12<Ks<16.5 mag.
A conspicuous overdensity is found atKs∼14.4 mag that could be
composed of red horizontal branch stars. However, the detection of Milky Way red clump (RC) stars in our field is also expected, given that they are the dominant population among the Galactic giant stars.
In fact, they have been long used to trace the Galactic structure because of their narrow luminosity function (e.g. Cabrera-Lavers et al.2008; McWilliam & Zoccali2010; Gonz´alez-Fern´andez et al.
2014). To confirm the association of that overdensity of stars with the cluster, we constructed area-normalized luminosity functions by counting stars in the range 1<J−Ks<1.5 and 12<Ks<18 with
a bin size ofδKS=0.2 for all the sources within 1.5 arcmin from the
cluster centre and for those stars beyond 1.5 arcmin. The results (see Fig.4) show a discrepancy between the distributions for the field and cluster areas and a peak is found atKs∼14.4 mag. The lack of
a significant component of field stars in that position confirms that only a stellar population in ther<1.5 arcmin region, lying in an extremely narrow distance range, is able to generate such a well-defined feature in the CMD. Thus, we conclude that the overdensity detected inKs∼14.4±0.2 mag corresponds to the RHB of GC 03,
also detected by Froebrich et al., but 0.4 mag fainter inKs. The
distributions shown in Fig.4suggests an additional second peak at Ks∼15.1. This was suggested by Froebrich et al. (2007b), although
they reported that its presence depended on the magnitude bin used to construct the luminosity function. The profile of the peak varies slightly with different bin sizes but the double peak morphology is always observed. As for the RC, the absence of a significant variation of stellar counts in the field around GC 03 suggests that this hypothetical second overdensity is associated with the cluster. We propose that these stars are crossing the so-called red giant branch bump (RGBB), a transitory variation in the magnitude of RGB stars produced by a discontinuity in the chemical abundance profile, which is detected in a significant number of Galactic GCs (e.g. Valenti, Ferraro & Origlia2007; Nataf et al.2013, and references therein). However, the additional investigation of RGBBs is beyond the scope of our work with the data available. The peak around Ks=12.6 mag, which appear in the Froebrich et al. CMD and was
interpreted as asymptotic giant branch bump, is not found.
3.2 Metallicity and radial velocity
Figure 4. Left: CMD corresponding to all stars contained in the area with
r< 1.5 arcmin from the centre of GC 03. The overplotted orange box indicates the region of the CMD used to derive the luminosity functions. Right: luminosity function for all stars withr<1.5 arcmin (red) and field stars beyond 1.5 arcmin from the cluster centre (dotted black line). The position of RHB is indicated with an arrow.
based on the equivalent width (EW) of the NaI2.21µm and CaI 2.26µm lines and the 12CO (2,0) band. The calibration is par-ticularly useful for moderate-resolution K-band spectra and was completed using spectra from 15 GCs. We measured the EW of our targets on the continuum normalized spectra, with theIRAFtask SPLOT. In general, we fit line profiles using a Gaussian with a lin-ear background, and in more complicated profiles, we used the deblending function or Voigt profile fitting. The EW uncertainties were estimated taking into account the S/N of the spectra, the peak to continuum ratio of the line and the error from the telluric star subtraction (which was estimated to be∼10 per cent in the worst cases). The uncertainties of the Frogel et al. (2001) calibration are assumed to be 0.2 dex.
We measured the radial velocities (RVs) of the targets with the IRAFtaskrvidlines, which fits spectral lines to determine the
wave-length shift with respect to specified rest wavewave-lengths. In this pro-cedure, we used the MgI(at 1.5770, 1.7109 and 2.2813µm), NaI (at 2.2062 and 2.2090µm), CaI(at 2.2631 and 2.2657µm) lines and the12CO (6,3), (2,0) and (3,1) bands, available in the spectra (typically 7–10 lines per spectrum). To calculate uncertainties, we added in quadrature the line measurements errors fromrvidlines and the errors from the wavelength calibration of each spectrum. Table1gives the metallicity and RVs for the stars with spectroscopic follow-up.
3.3 Proper motions of GC 03
At the distance of the cluster given by Froebrich et al. (2007b), d =9.1 kpc, the 5-yr VVV baseline is not enough to provide a pre-cise separation of the cluster members and the field stars by proper motion analysis. Nevertheless, using a proper motion pipeline de-veloped by Smith (2015), we were able to estimate the mean relative motion of the cluster. Briefly, the proper motion pipeline splits each array of the VVV catalogue at every epoch into 5×5 sub-arrays. The coordinate system of each sub-array at each epoch is transformed to the master epoch (the epoch with best seeing) coordinate system using a linear fit and an iterative rejection of astrometric reference sources with significant (>3σ) residuals. The proper motions are fit in array coordinate space using the Levenberg–Marquardt algo-rithm through theCURVE_FITfunction of theSCIPY.OPTIMIZEpackage. Individual epochs are iteratively removed if they are (>3σ) from the fit. The final array coordinate motions are converted to equato-rial coordinates using the astrometric fit parameters of the master epoch, which are produced by CASU and contained in the FITS header information. The mean uncertainty of the method up toKs=
14 mag is under 1 mas yr−1on average. Thus, we have selected only stars withKs<14 mag and radius 0.9 arcmin from the cluster centre
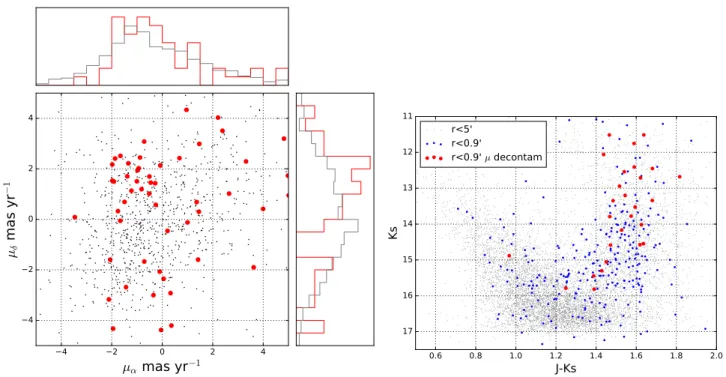
determined in the previous paragraph (red points in Fig.5, left) and compare them with the sources within 5 arcmin in the same mag-nitude interval (grey points) on theμαcosδversusμδproper motion diagram. As can be seen, the cluster members are mostly concen-trated in a clump in this proper motion diagram, while field stars are much more spread out. The values resulting from the Gaussian fits of the proper motion distributions areμαcosδ= −1.3±0.2 and
μδ= +1.8±0.3 for the mean relative proper motion of the cluster (expressed in mas yr−1; the errors correspond to the fitting errors). By taking all stars within a±1 mas yr−1box centred on the proper motion clump and highlighting them in aJ−KsversusKscolour–
magnitude (Fig.5, right), we show that the method predominantly select the giants that are cluster members and excluded field dwarfs.
Table 1. Ks,Ks−J, metallicity, radial velocity and relative proper motions derived for the stars with spectroscopic follow-up. Asterisks indicate likely cluster members. The proper motions are relative.
ID RA Dec. Ks J−Ks [Fe/H] RV μαcosδ μδ
[J2000] [J2000] (km s−1) (mas y−1) (mas y−1)
01* 16:52:16.2 −47:03:59.5 6.56±0.03 2.40±0.04 −0.95±0.18 −95±11 – –
02* 16:52:16.7 −47:03:23.9 10.32±0.04 2.14±0.06 −0.93±0.20 −83±12 +0.06±0.88 −2.35±0.89 03 16:52:13.4 −47:03:37.6 11.34±0.03 1.18±0.04 −0.18±0.33 +112±14 +5.01±0.57 +0.95±0.58
04 16:52:08.9 −47:04:00.5 9.54±0.02 1.9±0.2 +0.74±0.49 −60±10 – –
05 16:52:14.0 −47:03:11.7 9.60±0.03 1.98±0.04 −0.57±0.26 0±9 – –
06* 16:52:12.6 −47:03:06.0 11.84±0.07 2.53±0.05 −0.76±0.22 −75±10 +1.42±0.58 −1.60±0.59
07* 16:52:10.3 −47:03:11.9 8.21±0.04 2.53±0.05 −0.97±0.20 −72±9 – –
Figure 5. Left-hand panel: pipeline proper motions ofKs<14 mag sources within 5 arcmin (grey points), and 0.9 arcmin (red points) of the globular cluster GC03. Note the concentration of red points in PM space. Right: theJ−KsversusKscolour–magnitude diagram, the grey points are stars withKs<14 mag within 5 arcmin, the blue points are stars within 0.9 arcmin from the cluster centre, the red points stand for the star with similar (±1 mas yr−1).
3.4 Memberships of the spectroscopic targets
The spectroscopic targets were selected from statistically decon-taminated photometry (see Section 2). However, our statistical de-contamination methods are not designed to definitively determine cluster membership. As a result, we inevitably obtained some spec-tra of field stars. Cluster membership could be determined more accurately from the proper motion, radial velocity and metallicity histograms. The left-hand panel of Fig.6shows the distance of the star from the cluster centre, metallicity and relative proper motion versus measured RVs of the spectroscopically observed stars. It was not possible to use the relative proper motion of spectroscopically observed stars to separate field stars from cluster members, because only six of them have measured proper motions, the rest are sat-urated in the VVV images. In addition, using the Bonatto & Bica (2011) algorithm, we fitted the radial velocity and [Fe/H] distribu-tions with a Gaussian profile. The resulting values of the Gaussian fits are as [Fe/H]= −0.98±0.05 (dex),μ=1.4±0.4 mas yr−1 and RV= −69±3 km s−1.
The analysis of such constructed diagrams shows that stars num-ber 3, 4, 5, 9 and 10 are definitely outliers from the fitted distribu-tions and thus are considered field stars. The stars number 1, 2, 6, 7 and 8 are probable cluster members. Looking at the position of the stars numbers 1 and 7 on the CMD (Fig.6, right-hand panel), we can speculate that most probably these stars are red variables, but they are saturated in VVV images so it is not possible to test this suggestion.
Considering only cluster member stars (number 1, 2, 6, 7 and 8), the mean metallicity and radial velocity for GC 03 are calculated as[Fe/H]= −0.9±0.2 andvr = −78±12 km s−1. Such cal-culated [Fe/H] value is in agreement with the metallicity interval reported in Froebrich et al. (2007a) and lower than Kharchenko et al. (2013) estimate. However, we have to point out that this is a first spectroscopic determination, while the above cited authors used photometric calibrations to derive the metallicity.
Figure 6. Left: distance of the spectroscopic target stars with respect to the cluster centre in arcmin, the measured [Fe/H] in dex, the relative proper motionμαcosδ(black) andμδ(blue) in mas yr−1as a function of the RV in km s−1. The error bars represent the random errors of the measurements. Right: the (J−Ks) versusKsCMD of the statistically decontaminated most probable cluster members. The spectroscopically observed stars are plotted as red circles, while RR Lyrae stars are plotted as blue triangles. The error bars represent the photometric errors and the isochrones with agest=9.8, 10 and 12.6 Gyr are overplotted as blue, red and green solid lines, respectively.
3.5 Variable stars
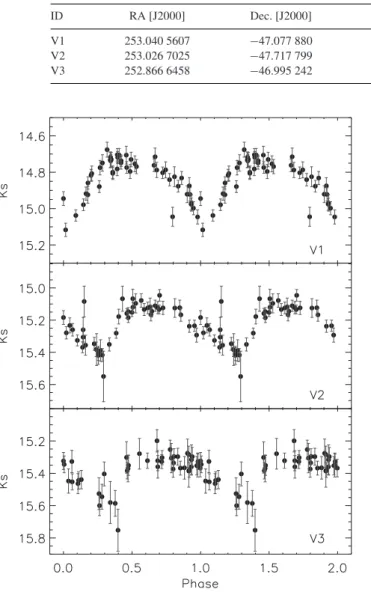
Table 2. Parameters derived for the RR Lyrae found in GC 03.
ID RA [J2000] Dec. [J2000] Ks Ampl. (d) d(kpc)
V1 253.040 5607 −47.077 880 14.88 0.45 0.843 10 11.2
V2 253.026 7025 −47.717 799 15.21 0.50 0.541 71 10.5
V3 252.866 6458 −46.995 242 15.36 0.55 0.553 30 10.8
Figure 7. Ks light curves of the RR Lyrae stars found in VVV likely associated with GC 03.
available between 2010 and 2014, the searching method was fo-cused on variations in the light curves greater than 0.2 inKs
(con-servative upper limit of our photometry, including the photometric errors, calibration to the standard system, etc.). Three variables are found, namely V1, V2 and V3, with meanKsmagnitudesKs =
14.83, 15.22 and 15.38 mag, respectively. Using the information potential metric developed in Huijse et al. (2011), we found their periods in the range 0.48<P<0.55 d. Thus, they are classified as RRab Lyrae stars. Their coordinates are listed in Table2and their position in the CMD is shown in Fig.6. Note that we plotted the meanKsmagnitude and random phase of corresponding J ones. The
light curves are shown in Fig.7.
Assuming that these RR Lyrae stars are associated with GC 03, the period–luminosity calibration from Muraveva et al. (2015) gives a mean heliocentric distance to the cluster ofd =10.8±0.4 kpc. The RR Lyrae calculated distance value is bigger than previously found by Froebrich et al. and Kharchenko et al.2013and we will adoptd =10.8± 0.9 kpc, as our final distance determination, adding quadratically the conservative limit of the errors from pho-tometry, calibration, etc.
Table 3. Parameters derived for GC 03. Note that proper motions are relative motions (see Section 3.2).
Parameter Result
[Fe/H] −0.9±0.2
d(kpc) 10.8±0.9
dG(kpc) 4.2±0.1
t(Gyr) 11.3±1.2
vr(km s−1) −78±12
μαcosδ(mas yr−1) −1.3±0.2
μδ(mas yr−1) 1.8±0.3
rc(arcmin) 0.75±0.05
rt(arcmin) >4.8
3.6 Isochrone fitting
To constrain the age, we generated a grid of the theoretical isochrones from Padova library (Bressan et al. 2012) with ages between 6 and 12 Gyr with metallicity fixed on the value de-rived above. We also fixed the distance to the above calculated from RR Lyrae stars value. Then, we fitted these isochrones to the observed CMD and reasonable matches were obtained within range of ages. Given that our photometry does not reach the turn-off level of the population, the isochrones with ages in the range 10–12.5 Gyr are suitable to reproduce the observed CMD, which is consistent with the presence of RR Lyrae stars. Therefore, we adopt a mean value oft=11.3±1.2 Gyr with a distance mod-ulus of (m−M)0=15.17±0.5 andAK=0.37. The isochrones are overplotted in Fig.6and the parameters derived are shown in Table3.
Based in our heliocentric distance, we estimate that the distance with respect to the plane for GC 03 is|z| ∼ 350 pc. Given that the scaleheights for the thin and thick discs are set, respectively, inhz =300 and 900 pc (Juri´c et al.2008), we confirm that this cluster is immersed in the Galactic disc. Its location in the Galaxy together with the parameters derived above might help us establish the nature of GC 03. While young stellar clusters (t<500 Myr) are concentrated towards the plane, older open clusters (OCs) show an exponential distribution with scaleheights greater than 375 pc and as a function of age (Janes & Phelps1994; Joshi2005; Bonatto et al.2006; Buckner & Froebrich2014). In this context, GC 03 might belong to the Galactic OC population becoming one of its oldest members known,∼2 Gyr older than NGC 6791 (Brogaard et al.2012) and with a similar age to that of Berkeley 17 (Krusberg & Chaboyer2006). On the other hand, the mean [Fe/H] derived for old (t>1 Gyr) OCs in the Galaxy contained in the WEBDA3 compilation is [Fe/H]= −0.2±0.3, where the old Berkeley 17 presents a metallicity of [Fe/H]= −0.3. GC 03 is thus metal poorer than the bulk of OCs, including coeval clusters.
The radial distribution of stellar clusters in the Milky Way might also provide clues about the classification of GC 03. With the
matrix shown in appendix A in Pasetto et al. (2011), we estimate that GC 03 is located atdG=4.2 kpc from the Galaxy centre. OCs older than 6 Gyr are scarce in the Milky Way and all the clusters older than 1 Gyr are located atdG>6 kpc (Bonatto et al.2006), although a fraction of clusters might remain undetected in high-extinction areas. Diverse theoretical studies have established that the dissolution time (tdis) for clusters withM<104Mis lower than a few hundreds of Myr (Lamers et al.2005), while for OCs withM∼104M
, it has been estimated atdis∼2 Gyr (Bergond, Leon & Guibert2001; Gieles et al.2006). Therefore, it is expected that all the OCs observed nowadays in the inner kpc of the Galaxy are young and massive. Indeed, massive OCs with ages of a few Myr have been found withRGC< 4 kpc (e.g. Figer et al.2002; Crowther et al.2006). In this context, GC 03 could only survive as an OC atRGC<4 kpc if it was as massive as a Galactic GC.
In the case of the Galactic GC population, a significant fraction of the systems lie in the volume defined byRGC= 4 kpc. From the 157 clusters contained in the Harris (2010) catalogue, 64 GCs (40 per cent) haveRGC<4 kpc and half of them are found at low Galactic latitudes (|b|<5◦). That latter group of GCs has a mean metallicity of [Fe/H]−0.8±0.4, which is a similar value to that derived from our spectra for GC 03. Therefore, the position of GC 03 in the Galaxy and its metallicity, similar to that of the bulk of bulge GCs allow us to confirm the globular nature of that cluster.
GC 03 might belong, following the scheme suggested in the classical works by Zinn (1993) and Armandroff (1989), to the pop-ulation of disc GCs, rather than to the halo/accreted globulars found in the outer regions of the Galaxy. A prototypical globular included in that metal-rich subgroup and associated with the Milky Way thick disc is 47 Tuc (NGC 104). That GC has a metallicity of [Fe/H]=
−0.7 with an age of 9.9 Gyr (Carretta et al.2009; Hansen et al.
2013), which are values similar to those derived in this work. This suggests that GC 03 might have been formed together with the disc stellar populations and the metal-rich component of Galactic GCs.
3.7 Radial density profile and spatial distribution
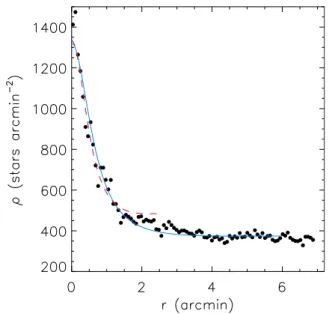
We studied the cluster radial density profile, calculating the stel-lar density in concentric annuli of width 4 arcsec, centred on the cluster coordinates derived above and using VVV photometry. The results are shown in Fig.8. If the analysis is limited to stars with Ks<14.7 and distances from the centrer<1.7 arcmin, as done
by Froebrich et al. (2007b), the radial decay of the stellar density is well represented by a King profile, withrc=0.6 arcmin±0.2 andrt=2.2 arcmin±0.7 as the best-fitting core and tidal radii, respectively. These values are slightly larger than those found by Froebrich et al., but comparable within errors, indicating that our VVV stellar counts are consistent with theirs. Nevertheless, when the profile is extended tor=7 arcmin, it becomes evident that the background is overestimated by this fit, because the stellar density keeps decreasing beyondr=1.7 arcmin. The profile is very flat for r>4 arcmin, suggesting that small-scale fluctuations are negligi-ble. However, the tidal radius diverges to huge values if the fit is extended tor>2 arcmin. Identical results are found extending the stellar counts down toKs<16.5. The cause of this unrealistic result
is that the density in the range 2–3 arcmin is too high than expected for a King profile. The tidal radius can be reduced to 9 arcmin ex-cluding the region 2–2.5 arcmin from the fit and a minimum value of 4.8 arcmin is obtained with the exclusion of the 2–3.5 arcmin range. The core radius barely changed in any of these fits and it was always found in the rangerc=0.75±0.05 arcmin. Our results are
Figure 8. Radial density profile derived for GC03. The red dashed line in-dicates the best King profile fitted using only those stars withr<1.7 arcmin, while the solid blue line corresponds to the fitting including those stars with
r<7 arcmin.
Figure 9. Stellar density contours showing the distribution in the sky of stars belonging to GC 03 according to the decontaminated CMD. The inner and outer circles correspond to the distancesr1=0.45 andr2=0.95 arcmin, respectively. The constant Galactic latitude level atb= −1.85◦is overplotted with a solid line, while the direction towards the Milky Way centre is indicated with an arrow.
consistent with those by Kharchenko et al. (2013) where it was also found a very large tidal radius (8±2 arcmin), although they do not provide the details of their fit.
Our analysis shows that GC03 is likely more extended than the estimates of Froebrich et al. (2007b) reported in the Harris (2010) catalogue. However, it is also clear that the cluster density profile is not well represented by a King function. This behaviour is typical of a cluster suffering intense tidal stress (see, e.g. Moni Bidin et al.
map generated with stars potentially associated with the GC, with a nearly symmetrical and elongated distribution of stars similar to that observed in GCs with known tidal tails (e.g. Pal 14; see Sollima et al.2011).
The region with higher density in Fig.9seems to be contained in an area with radiusr1=0.45 arcmin (inner circle in that plot), while the density of stars beyondr2=0.95 arcmin (outer circle) is negligible. The distance r1 is consistent with the core radius derived above for this cluster when only stars withr<1.7 arcmin are considered, while the obtained King tidal radius is much larger thanr2. At the distance of GC 03, the radius of its observed core is r1=1.5 pc and the tentative inner tidal tails expand up tor2=3.2 pc from the cluster centre.
4 C O N C L U S I O N S
We have derived fundamental parameters for the stellar cluster 2MASS-GC 03 using MMIRS photometry and spectroscopy and VVV data. Out the 10 stars for which we have obtained spectra, 5 were considered as cluster members based on their proper motions derived from VVV photometry. We have estimated metallicities and RVs for field and candidate stars and set mean values for the cluster in[Fe/H] = −0.9 andvr ∼ −78 km s−1. With that information, we have established that 2MASS-GC 03 is an intermediate-age sys-tem witht=11.3 Gyr atd =10.8 kpc. Its location within the Galaxy and overall properties (summarized in Table3) confirms its globular nature.
AC K N OW L E D G E M E N T S
This paper includes data gathered with the 6.5 metre Magellan Tele-scopes located at Las Campanas Observatory, Chile (program ID: CN2014A-84). JAC-B received support from CONICYT Gemini grant from the Programa de Astronom´ıa del DRI Folio 32130012 and CONICYT-Chile grants FONDECYT Postdoctoral Fellowship 3160502. SRA and CMB were supported by the Fondecyt project number 3140605 and 1150060, respectively. JA-G acknowledges support from the FIC-R Fund, allocated to project 30321072, and from Fondecyt Iniciaci´on 11150916. NM is supported by CONI-CYT REDES No. 140042 project. The VVV Survey is supported by ESO, by BASAL Center for Astrophysics and Associated Tech-nologies PFB-06, by FONDAP Center for Astrophysics 15010003, and by the Ministry for the Economy, Development, and Tourism’s Programa Inicativa Cient´ıfica Milenio through grant IC120009, awarded to The Millennium Institute of Astrophysics (MAS). Par-tially based on data products from observations made with ESO Telescopes at the La Silla or Paranal Observatories under ESO programme ID 179.B-2002. This publication makes use of data products from the 2MASS, which is a joint project of the Uni-versity of Massachusetts and the Infrared Processing and Analysis Center/California Institute of Technology, funded by the National Aeronautics and Space Administration and the National Science Foundation. This research has made use of the WEBDA database, operated at the Department of Theoretical Physics and Astrophysics of the Masaryk University. Thanks to K. Pe˜na-Ram´ırez and J. M. Corral-Santana for their help during the spectra reduction.
R E F E R E N C E S
Armandroff T. E., 1989, AJ, 97, 375 Ashman K. M., Zepf S. E., 1992, ApJ, 384, 50 Balbinot E. et al., 2013, ApJ, 767, 101
Bergond G., Leon S., Guibert J., 2001, A&A, 377, 462 Bonatto C., Bica E., 2007, MNRAS, 377, 1301 Bonatto C., Bica E., 2010, A&A, 516, A81 Bonatto C., Bica E., 2011, MNRAS, 415, 313
Bonatto C., Kerber L. O., Bica E., Santiago B. X., 2006, A&A, 446, 121 Borissova J. et al., 2011, A&A, 532, A131
Borissova J. et al., 2014, A&A, 569, A24
Bressan A., Marigo P., Girardi L., Salasnich B., Dal Cero C., Rubele S., Nanni A., 2012, MNRAS, 427, 127
Brogaard K. et al., 2012, A&A, 543, A106
Buckner A. S. M., Froebrich D., 2014, MNRAS, 444, 290
Cabrera-Lavers A., Gonz´alez-Fern´andez C., Garz´on F., Hammersley P. L., L´opez-Corredoira M., 2008, A&A, 491, 781
Carballo-Bello J. A., Gieles M., Sollima A., Koposov S., Mart´ınez-Delgado D., Pe˜narrubia J., 2012, MNRAS, 419, 14
Carraro G., 2005, ApJ, 621, L61 Carretta E. et al., 2009, A&A, 505, 117
Crowther P. A., Hadfield L. J., Clark J. S., Negueruela I., Vacca W. D., 2006, MNRAS, 372, 1407
Davies B., Bastian N., Gieles M., Seth A. C., Mengel S., Konstantopoulos I. S., 2011, MNRAS, 411, 1386
Figer D. F. et al., 2002, ApJ, 581, 258
Froebrich D., Scholz A., Raftery C. L., 2007a, MNRAS, 374, 399 Froebrich D., Meusinger H., Scholz A., 2007b, MNRAS, 377, L54 Frogel J. A., Stephens A., Ram´ırez S., DePoy D. L., 2001, AJ, 122, 1896 Gieles M., Portegies Zwart S. F., Baumgardt H., Athanassoula E.,
Lamers H. J. G. L. M., Sipior M., Leenaarts J., 2006, MNRAS, 371, 793
Gonz´alez-Fern´andez C., Asensio Ramos A., Garz´on F., Cabrera-Lavers A., Hammersley P. L., 2014, ApJ, 782, 86
Hansen B. M. S. et al., 2013, Nature, 500, 51 Harris W. E., 2010, preprint (arXiv:1012.3224)
Huijse P., Estevez P. A., Zegers P., Principe J. C., Protopapas P., 2011, IEEE Signal Process. Lett., 18, 371
Janes K. A., Phelps R. L., 1994, AJ, 108, 1773 Joshi Y. C., 2005, MNRAS, 362, 1259 Juri´c et al., 2008, ApJ, 673, 864 Kausch et al., 2015, A&A, 576, A78
Kharchenko N. V., Piskunov A. E., Schilbach E., R¨oser S., Scholz R.-D., 2013, A&A, 558, A53
Kim D., Jerjen H., Milone A. P., Mackey D., Da Costa G. S., 2015, ApJ, 803, 63
Kobulnicky et al., 2005, AJ, 129, 239 Koposov S. et al., 2007, ApJ, 669, 337
Krusberg Z. A. C., Chaboyer B., 2006, AJ, 131, 1565 Laevens et al., 2014, ApJ, 786, L3
Lamers H. J. G. L. M., Gieles M., Bastian N., Baumgardt H., Kharchenko N. V., Portegies Zwart S., 2005, A&A, 441, 117
Longmore A. J. et al., 2011, MNRAS, 416, 465 McLeod B. et al., 2012, PASP, 124, 1318 McWilliam A., Zoccali M., 2010, ApJ, 724, 1491
Mauro F., Moni Bidin C., Chen´e A.-N., Geisler D., Alonso-Garc´ıa J., Borissova J., Carraro G., 2013, Rev. Mex. Astron. Astrofis., 49, 189 Minniti D. et al., 2010, New Astron., 15, 433
Minniti D. et al., 2011, A&A, 527, A81 Moni Bidin C. et al., 2011, A&A, 535, A33
Mu˜noz R. R., Geha M., Cˆot´e P., Vargas L. C., Santana F. A., Stetson P., Simon J. D., Djorgovski S. G., 2012, ApJ, 753, L15
Muraveva T. et al., 2015, ApJ, 807, 127
Nataf D. M., Gould A. P., Pinsonneault M. H., Udalski A., 2013, ApJ, 766, 77
Pasetto S., Grebel E. K., Berczik P., Chiosi C., Spurzem R., 2011, A&A, 525, A99
Roeser S., Demleitner M., Schilbach E., 2010, AJ, 139, 2440 Saito et al., 2012, A&A, 537, A107
Simpson J. P., Cotera A. S., 2004, American Astronomical Society Meeting Abstracts #204, 36, 734
Smette et al., 2015, A&A, 576, A77
Smith L. C., 2015, PhD thesis, Univ. Hertfordshire Solin O., Haikala L., Ukkonen E., 2014, A&A, 562, A115
Sollima A., Valls-Gabaud D., Martinez-Delgado D., Fliri J., Pe˜narrubia J., Hoekstra H., 2011, ApJ, 730, L6
Stetson P. B., 1987, PASP, 99, 191
Valenti E., Ferraro F. R., Origlia L., 2007, AJ, 133, 1287 Willman B. et al., 2005, AJ, 129, 2692
York D. G. et al., 2000, AJ, 120, 1579 Zinn R., 1985, ApJ, 293, 424
Zinn R., 1993, in Smith G. H., Brodie J. P., eds, ASP Conf. Ser. Vol. 48, The Globular Cluster-Galaxy Connection. Astron. Soc. Pac., San Francisco, p. 38