Assessing the performance of the existing and proposed network of marine protected areas to conserve marine biodiversity in Chile
7
0
0
Texto completo
(2) 3148. M.F. Tognelli et al. / Biological Conservation 142 (2009) 3147–3153. Table 1 List and location of marine protected areas established in Chile and priority sites identified by the government but not yet established. The year each area was established under the category of marine protected costal area of multiple uses (MPA-MU) or marine reserve (MR) is indicated. When the area has been protected previously, under another legal figure, the year is indicated between brackets. We classified the existing conservation tools of Chile according to Guarderas et al. (2008) into two broad categories (no-take and mixed used). The protection status indicates if the area includes a no-take zone and the target (biodiversity, exploited species, intertidal zone only). The protected areas included in the Fixed existing MPA scenario (2) and the Fixed existing MPA and priority sites scenario (3) are listed. Name. Scenario. Location. Classification. Category. Year established. Protection status. Las Cruces. 2 and 3. 33.5–34°S. No-take. MPCA-MU. 2005 (1982). Francisco Coloane. 2 and 3. 53–53.5°S. Mixed-use. MPCA-MU. 2003. Islas Dama y Choros. 2 and 3. 29–29.5°S. Mixed-use. MR. 2005. Isla Chañaral Isla Grande de Atacama Lafke Mapu Lahaual Isla Mocha Islas Oceánicas Guamblin. 2 and 3 2 and 3 2 and 3 3 3. 29–29.5°S 27–27.5°S 40.5–41°S 38–38.5°S 44.5–45°S. Mixed-use Mixed-use Mixed-use. MR MPCA-MU MPCA-MU Priority site Priority site. 2005 2004 2005. Include a no-take zone Protection of biodiversity Include a no-take zone Protection of biodiversity No-take zone not yet defined Protection of biodiversity No-take zone not yet defined No-take zone not yet defined No-take zone not yet defined. zone (Parque Francisco Coloane; Table 1). The small MPA of Las Cruces is entirely a no-take area (Table 1). Also, the protected areas of Damas, Choros and Chañaral Islands fall within the same mixeduse category (Table 1). Finally, two priority sites for the conservation of marine species have been identified with the goal of protecting at least 10% of the area of the most relevant ecosystems (Fernandez and Castilla, 2005). In parallel to this nationwide strategy a few Sanctuaries covering small areas and with unreliable levels of protection have been established by private organizations in the last decades to protect flagship species (Fernandez and Castilla, 2005). The advances made in the last few years to conserve marine biodiversity along the coast of Chile, however, are not based on solid scientific data and systematic analysis to provide efficient solutions to spatial allocation problems (Stewart et al., 2003). For instance, MPAs are clearly underrepresented in central Chile (Fernandez and Castilla, 2005), where important changes in oceanographic conditions occur, affecting larval transport and therefore determining recruitment and abundance of key intertidal species and community structure (Broitman et al., 2001; Navarrete et al., 2002, 2005; Rivadeneira et al., 2002). Moreover, in central Chile private organizations have gained exclusive use of large sections of the coast for exploitation of benthic resources (Fernandez and Castilla, 2005), imposing serious constraint on the development of conservation plans. It is important to remark that most existing protected areas were created, and priority sites identified, in response to high abundance or diversity of marine birds and mammals, which represent less than 5% of the total number of marine species reported for Chile (including macroalgae, vertebrates, and macroinvertebrates). However, it is unclear if a large proportion of marine taxa can be conserved by strategies designed for the protection of vertebrate diversity (Tognelli et al., 2005). Existing databases on the distribution of marine organisms, such as macroalgae, invertebrates and vertebrates can provide the scientific ground to apply optimization algorithms developed for conservation planning and reserve design in terrestrial systems (Cocks and Baird, 1989; Pressey and Nicholls, 1989; Pressey et al., 1995; Possingham et al., 2000), and thus propose an efficient reserve system. Here we used the most comprehensive information currently available on the distribution of marine species in Chile to assess the performance of the existing reserve network and the proposed priority sites, and to establish a ranking of priority sites for conservation based on anthropogenic pressures. We evaluated three planning scenarios for the design and selection of a marine protected area network in Chile. The first scenario is the optimal configuration of reserves without constraining the result to include the current system of reserves; the second scenario starts the selection process with the existing reserve system and. then uses the optimization algorithm to select the remaining planning units. The third scenario adds the conservation priority sites identified by the Chilean National Environmental Agency (CONAMA) to the existing reserve system. We also estimated the vulnerability (i.e. the likelihood that an area will be disturbed or destroyed; Rondinini et al., 2006) of the sites selected in the third scenario due to patterns of human population density and other human pressures, such as Territorial Use Rights Fisheries, and Aquaculture Areas (Castilla et al., 1998, 2007). We particularly focused on these three human pressures because they are carried out in areas of the ocean with exclusive right of use, and therefore are temporarily not available for conservation plans. These anthropogenic stressors were summarized in one composite index to provide a map of a continuous ranking of the top priority sites in terms of urgency of conservation.. 2. Methods 2.1. Data We compiled data from surveys and published literature on the geographic distribution of 2513 marine species inhabiting the coast of Chile (Supplementary material): 1900 invertebrate species (492 annelids, 399 crustaceans, 244 bryozoans, 95 coelenterates, 72 echinoderms, 40 hemichordates, 482 mollusks, and 76 porifers), 348 species of macroalgae (60 green, 67 brown and 221 red algae), and 265 vertebrate species (25 mammals, 93 birds, 13 reptiles and 134 teleost fish). This is the most comprehensive information currently available on the distribution of coastal marine species in Chile. Following Tognelli et al. (2005), we mapped the geographic distribution of each species on the Chilean coast in a grid of 76 coastal latitudinal bands of 0.5° each (approximately 55 km in a straight line), between 18°S and 56°S (Fig. 1). Geographic distribution was assumed continuous between range end points. Size selection of the latitudinal bands was based on the sampling effort for all species. Since latitudinal bands are not bounded longitudinally (i.e. are not cells), we included species occurring in the coast and adjacent marine continental shelf area. Species richness was calculated as the number of species recorded in each latitudinal band. We used the LandScan 2002 Global Population database (Oak Ridge National Laboratory) to obtain values of human population density, measured within the first 10 km inland from the coast. We assumed that people living within this distance will have an influence on the coastal marine environment. For each latitudinal band, we calculated the percentage of its coastal length exhibiting.
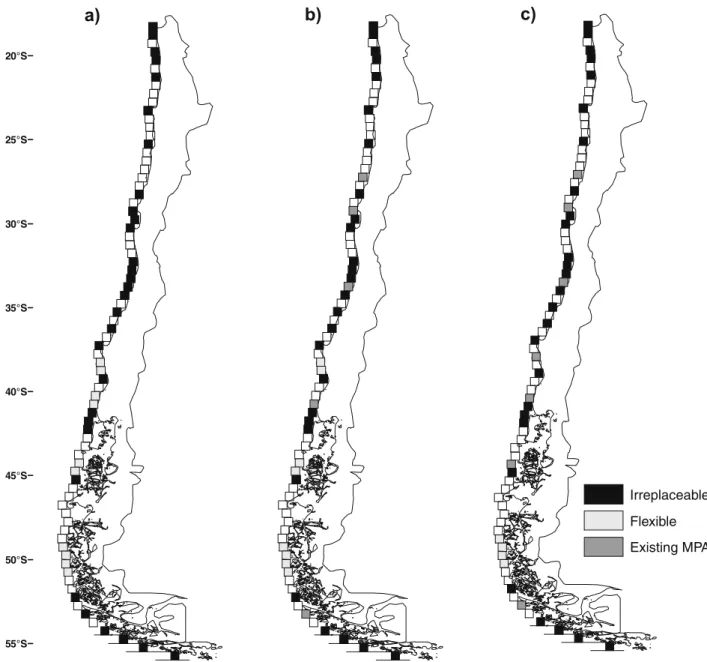
(3) 3149. M.F. Tognelli et al. / Biological Conservation 142 (2009) 3147–3153. a). b). c). 20°S. 25°S. 30°S. 35°S. 40°S. 45°S. Irreplaceable Flexible Existing MPA 50°S. 55°S. Fig. 1. Reserve networks selected to protect marine biodiversity by the three different scenarios: (a) No MPA scenario; (b) Fixed existing MPA scenario; (c) Fixed existing MPA and priority sites. Planning units that were chosen in all solutions (irreplaceable) are shown in black. Flexible bands (light-gray) are those latitudinal bands that provided the same number of unrepresented species to the solution. In all cases, flexible bands appear in groups of two or four contiguous cells. Existing reserves or priority sites in b and c are shown in dark gray. Note that latitudinal bands are represented as cells for graphical purposes only.. high (>10 people/km2) and low (610 people/km2) human population density (Tognelli et al., 2005). Additionally, we obtained location data for Territorial Use Rights Fisheries (TURF) and Aquaculture Areas (AA) to calculate the percentage of the coastal length of each latitudinal band occupied by TURFs and the number of AAs per latitudinal band (Subsecretaria de Pesca de Chile). 2.2. Analyses We performed the reserve selection analysis with the software Marxan (Ball and Possingham, 2000). Marxan uses different optimization algorithms to allocate sites for biodiversity conservation, so that conservation feature targets are met in the least number of available sites. Our goal was that each species be represented in at least one latitudinal band. We used the summed irreplaceability algorithm to obtain reserve network solutions (simulated annealing gave similar results in terms of irreplaceable and flexible bands). We ran the algorithm 1000 times and determined the level. of irreplaceability by the number of times a particular latitudinal band was selected. For example, a latitudinal band that was selected 1000 times was considered completely irreplaceable. Other bands that were selected in some but not all solutions were considered flexible. In all cases, the frequency of selection of alternative flexible bands was evenly distributed. For instance, when there were four flexible bands, each band was selected 250 ± 20 times. For the first scenario (the No MPA scenario), we ran the optimization algorithm without considering the status of the existing reserve system (Table 1). Therefore, the selection process was free to either ignore or incorporate latitudinal bands that contained marine protected areas. For the second scenario (Fixed existing MPA, Table 1), we considered protected those latitudinal bands that contained marine protected areas, regardless of: (1) their size; (2) the percentage of the band that they protect; (3) the fact that no-take zones have not yet been defined. We also included marine reserves if they were established to protect marine biodiversity (namely, Isla Damas y Choros, Isla Chañaral; Table 1). We classified the.
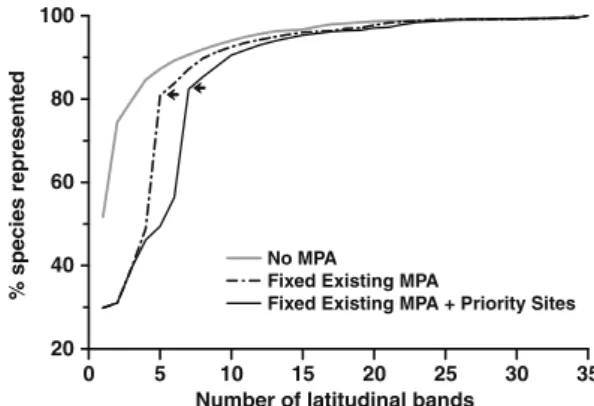
(4) M.F. Tognelli et al. / Biological Conservation 142 (2009) 3147–3153. existing conservation tools of Chile according to Guarderas et al. (2008) into two broad categories (no-take and mixed used). Accordingly, we locked all planning units that contain existing marine protected areas and marine reserves and forced the reserve selection algorithm to first select those latitudinal bands that were considered protected and then select the remaining planning units until all species were represented at least once. For the third scenario (Fixed existing MPA + priority sites, Table 1), we performed the same analysis as above but adding the priority sites proposed by the government. The marine reserves Rinconada, Putemún, and Pullinque were not included in our analysis because each of them was created to protect only the genetic stocks of one species of exploited invertebrate allowing the exploitation of the rest of the species. After running the reserve selection analysis, we identified all latitudinal bands that complement the existing MPA and priority sites, on the third scenario, and that might be vulnerable to the anthropogenic stressors mentioned above. We did not perform this analysis for the first two scenarios because MPAs are already established and priority sites have been proposed. We used an arbitrary cut-off criterion of P50% of the coastal length of a latitudinal band with high population density (>10 people/km2) or with TURFs, to indicate conflict with anthropogenic activities. In the case of AAs, we computed the number of AAs per latitudinal band. The values of these variables were normalized (scaled between 0 and 100 by dividing the value by the maximum value, and multiplying the result by 100) in order to make them comparable. They were then added up and normalized again to obtain a composite index of vulnerability ranging from 0 to 100, where 0 and 100 represent the lowest and highest vulnerability, respectively. When more than one latitudinal band provided the same number of unrepresented species to the solution (i.e. flexible bands), we selected those that conflict the least with human activities. Although we could have incorporated these anthropogenic stressors as cost into the reserve selection algorithm function, we decided not to. As in a previous study (Tognelli et al., 2005), when some of these conflicting activities were incorporated into the selection algorithm, most of the flexible latitudinal bands became irreplaceable and, therefore, the options for conservation managers of choosing alternative bands (that would protect the same number of species) was not available any more. Similarly, Fraschetti et al. (2009) found that the inclusion of human activities in the selection of MPAs in Mediterranean ecosystems constrains the selection procedure to a smaller range of possible options.. 3. Results In the No MPA scenario, marine protected areas in 34 latitudinal bands (44.7% of all latitudinal bands) were needed to protect at least one population of each species (Figs. 1a and 2; Table 2). Of the 34 identified bands, 30 were considered irreplaceable and the remaining four (among the 10 identified in Fig. 1a) were flexible. In all cases, flexible bands appeared in groups of two or four contiguous cells. The distribution of the latitudinal bands identified was relatively even along the Chilean coast (Fig. 1a). Under the Fixed existing MPA scenario, five latitudinal bands were considered protected by existing reserves (Fig. 1b and Table 2; two existing protected areas fall within the same latitudinal band at 29°S). These MPAs protect 80.82% of the species (Fig. 2 and Table 2). This level of protection was reached with three latitudinal bands protected under the No MPA scenario. However, the number of species not covered by any protected area was still quite large (Table 2) and more importantly, 82.22% of the species exhibiting limited geographic range (i.e. species present in only one latitudinal band) were not protected (Table 2). Thirty addi-. 100 % species represented. 3150. 80. 60. No MPA Fixed Existing MPA Fixed Existing MPA + Priority Sites. 40. 20 0. 5. 10 15 20 25 Number of latitudinal bands. 30. 35. Fig. 2. Performance of the Fixed existing MPA scenario and the Fixed existing MPA and priority sites scenario compared to the No MPA scenario in representing all species. The gray line represents the No MPA scenario, the black dash-dotted line represents the Fixed existing MPA, and the solid black line represents the Fixed existing MPA and priority sites scenario. The last two scenarios start the selection process with the fixed planning units, and then complete the representation of all species using complementarity analysis. Black arrows indicate the number of planning units that are ‘‘protected” in these two scenarios.. Table 2 Results for the three scenarios analyzed. The numbers indicating MPA in general refer to latitudinal bands (planning units). Note that in the case of existing MPA, the number of MPAs and latitudinal bands may not coincide as some latitudinal bands contain more than one MPA. Classification of latitudinal bands. Number of MPA needed No MPA scenario. Fixed existing MPA. Fixed existing MPA and priority sites. Existing or proposed Irreplaceable bands Flexible bands Total. 0 30 4 34. 5 27 3 35. 7 27 1 35. 100%. 80.82%. 82.37. 0. 482. 443. 0%. 82.22%. 82.22%. Level of protection Percent of species protected Total number of species not protected Percent of restricted species not protected. tional planning units were needed to complement the existing reserve system and represent each species at least once, totaling 35 latitudinal bands (Figs. 1b and 2; Table 2), which is equivalent to 46% of all latitudinal bands. Twenty seven of the additional planning units were irreplaceable, whereas three were flexible bands (Fig. 1b). Under the Fixed existing MPA and priority sites scenario, seven latitudinal bands were considered protected (Fig. 1c). In this scenario, the number of species protected increased to 82.37% (Table 2). However, this increase did not significantly improve the percentage of restricted-range species protected with respect to the previous scenario, which remained in 82.22% (Table 2). To protect all species at least once, 28 additional planning units must be added to the existing reserves and proposed priority sites, totaling 35 latitudinal bands (Fig. 2). Although some gains can be observed in species protection with respect to the previous scenario, the areas selected were less flexible. Of the 28 additional planning units, only one was flexible and the remaining 27 were irreplaceable (Fig. 1c, Table 2). More than half (53.6%) of the latitudinal bands that complement the existing MPA and proposed priority sites on the third scenario were highly vulnerable to one or more anthropogenic threats.
(5) M.F. Tognelli et al. / Biological Conservation 142 (2009) 3147–3153. 3151. 4. Discussion. 20°S. 25°S. 30°S. 35°S. 40°S. 45°S. 0 - 25 26 - 50 51 - 75. 50°S 76 - 100. 55°S Fig. 3. Vulnerability of the sites identified in the Fixed existing MPA and priority sites scenario based on human threatening processes. Horizontal bars on the left show the normalized index for each human activity: diagonal hatch indicates human population density, white indicates TURFs, and horizontal hatch indicates aquaculture areas. Graduated colors of the latitudinal bands (here shown as cells for graphical purposes) indicate the normalized composite index of human activities (see text for details), with darker colors indicating higher vulnerability.. (Fig. 3). As expected, most of these planning units were concentrated in the central portion of the country, where most of the people live and the majority of economic and recreational activities occur (e.g. beach areas, commercial fishing, and major harbors).. Our results present an objective analysis of the performance of the existing and proposed protected areas in Chile and provide a ranking of priority sites for the conservation of marine species using the most comprehensive dataset available. We find remarkable the relatively high level of protection of marine biodiversity that can be reached by the existing ad hoc system of marine protected areas and priority sites (80.82% and 82.37%, respectively). However, they are not as efficient as the optimal solution. A higher fraction of marine species could have been protected (87%) if the selection of the existing five latitudinal bands protected had been guided by a systematic conservation planning approach. These results are not surprising and are in agreement with previous studies where the efficiency of existing reserves has been assessed (e.g., Stewart et al., 2003). In our case, we think that the relatively high level of protection attained by both the second and third scenarios could be related to the wide ranges of species distribution of most invertebrate and fish species (Fernández et al., 2000). In fact, many of the species not covered by the current MPA network are rangerestricted species, which tend to be more vulnerable to extinction (Dulvy et al., 2003). The frequency in which planning units are selected is an indication of conservation priority (Possingham et al., 2000). Thus, completely irreplaceable sites can be thought of as the core of the reserve network (Ferrier et al., 2000; Carwardine et al., 2007). Generally, sites that contain rare or endemic conservation targets (e.g. species or ecosystems) are almost always irreplaceable (Ferrier et al., 2000; Carwardine et al., 2007). The dependence of irreplaceability on rarity and endemism will be strongest when conservation targets are one occurrence of each feature (Ferrier et al., 2000). In our study, the high number of irreplaceable bands is directly related to the high number of species occurring in only one latitudinal band (n = 225). Indeed, 30 of the 76 latitudinal bands contain between 1 and 37 species that occur in one latitudinal band, which is reflected by the number of irreplaceable bands in the first scenario (Table 2). This is rather unusual given that other studies (Leslie et al., 2003; Stewart and Possingham, 2005; Game et al., 2008) have found that most planning units had high flexibility and only a small percentage were irreplaceable. However, the main difference with our study is that they used a relatively small number of habitat types (26–102 habitat types) whereas we used 2513 species. The spatial distribution of irreplaceable sites for the scenarios when the existing MPAs and the proposed priority sites are included reflect the gaps in marine biodiversity conservation in both the southernmost and northernmost extremes of the country, but particularly so in central Chile. We determined that one third of future marine protected areas should be established in central Chile (between 28 and 36°S). However, it is in this region where most of the conflicts between sites of conservation concern and human activities occur. This is not unexpected as it is the area that has the largest human population and, consequently, where the largest impact occur (Fernandez and Castilla, 2005). In the Caribbean region, it has been shown that human population density is negatively related to both richness and abundance of predatory reef fishes (Stallings, 2009). In the same region, the number of people living in close proximity to coastal areas is the main driver of the mortality of corals, loss of fish biomass, and increases in macroalgae abundance (Mora and Ginsburg, 2008). Similar results have been reported for central Chile (Castilla and Durán, 1985). The main pressures associated with human population density are coastal development, with its associated increase in sewage outfalls, and overfishing (Mora and Ginsburg, 2008; Williams et al., 2008; Fraschetti et al., 2009)..
(6) 3152. M.F. Tognelli et al. / Biological Conservation 142 (2009) 3147–3153. It has become increasingly recognized that the effectiveness of marine reserves worldwide is dependent upon management and enforcement (Mora et al., 2006). Enforcement of the existing MPAs in Chile is extremely poor. In fact, the difficulty to implement enforcement is a major issue precluding the creation of new MPAs and the definition of no-take areas within the large mixed-use areas already established. It is important to remark that the TURF system in place could not only set constraints but also offer opportunities to develop a mixed system of no-take and partially protected areas (Lester and Halpern, 2008), given the enforcement difficulties and the increasing need to establish new MPAs. The TURF system incorporates self-imposed rules internal to each organization and also informal agreements between organizations (San Martin et al., 2008). Therefore, enforcement is conducted by fishers. Different levels of regulations and enforcement are observed among TURFs creating a gradient of human impact within TURFs. Thus, the best protected TURFs could serve as partially protected areas. Indeed, abundance of highly valued species such as loco (Concholepas concholepas), limpets (Fissurella spp.), crabs (Homalaspis plana), sea urchins (Loxechinus albus), fish (Aplodactylus punctatus; Cheilodactylus variegatus) and macroalgae is higher in TURFs than in open fishing grounds. Moreover, some TURFs show similar biological performance (biodiversity, species size and abundance) than the no-take area of Las Cruces (Gelcich, Castilla and Fernández, in prep). This preliminary exciting and unexpected result highlights the potential (but unexplored) stewardship value that TURFs may have for coastal ecosystems and offers the opportunity to merge two traditional antagonistic activities, exploitation and conservation, to conserve biodiversity and maximize ecosystem services. Although our analysis is based on latitudinal bands of 0.5°, we do not imply that the latitudinal bands selected should be protected in their entirety. In fact, the marine protected coastal areas already established and the priority sites identified cover from 1.5% to 80% of a latitudinal band. However, the number of sites needed to reach full protection of marine species requires a substantial increase from the number of priority sites identified. In this sense, we feel that our analysis can help guiding the selection of future sites for marine conservation. We recognize, that other sets of solutions may be obtained if microinvertebrates and microalgae are incorporated to the analysis, or if vulnerability to extinction were included as a criteria in the planning exercise (e.g. Edgar et al., 2008) however, as of yet there are not databases on species distribution for these groups and most species remain unknown regarding their extinction vulnerability. Finally, we acknowledge that this is a preliminary, broad-scale analysis with coarse distributional data that allows, with the level of existing information, to narrow down the areas (latitudinal bands) of conservation concern in coastal Chile where more refined analysis should identify the best location to place a marine protected area. We believe that our results could help decision makers in several ways. First, our results could highlight the need to analyze the level of actual protection of existing no-take zones as many of them are extremely small and may not provide the proper representation for the species of the latitudinal bands identified. Second, our analysis may help prioritize future conservation areas based on the vulnerability of the sites to human activities. Finally, and along the same line, the priority sites identified in central Chile, where large fractions of the coast are already assigned to TURFs open the novel possibility of implementing a network that includes these TURFs as well as MPAs to better achieve conservation targets (Gelcich et al., 2008). Moreover, existing TURFs could also help to improve the connectivity of the existing MPA system (Gonzalez, pers. com.). This possibility requires serious assessment by government officials, stakeholders and the marine conservation community in Chile.. Acknowledgements We thank A. Astorga, R. Calderón, and C. Gonzalez for their help. Thanks also to two anonymous reviewers that greatly improved the manuscript. We acknowledge the FONDAP-Fondecyt Grant 1501-0001 to the Center for Advanced Studies in Ecology and Biodiversity and Fondecyt 1020860. We also acknowledge financial support from the Pew Ocean Institute (MF), ICM P05-002 (PM) and Contract PFB-23, Conicyt, Chile (PM). Appendix A. Supplementary material Supplementary data associated with this article can be found, in the online version, at doi:10.1016/j.biocon.2009.08.016. References Allison, G.W., Gaines, S.D., Lubchenco, J., Possingham, H.P., 2003. Ensuring persistence of marine reserves: catastrophes require adopting an insurance factor. Ecological Applications 13, S8–S24. Allison, G.W., Lubchenco, J., Carr, M.H., 1998. Marine reserves are necessary but not sufficient for marine conservation. Ecological Applications 8, S79–S92. Ball, I., Possingham, H., 2000. MARXAN (Marine Reserve Design using Spatially Explicit Annealing). The University of Queensland, Australia. Broitman, B.R., Navarrete, S.A., Smith, F., Gaines, S.D., 2001. Geographic variation of southeastern Pacific intertidal communities. Marine Ecology-Progress Series 224, 21–34. Carwardine, J., Rochester, W.A., Richardson, K.S., Williams, K.J., Pressey, R.L., Possingham, H.P., 2007. Conservation planning with irreplaceability: does the method matter? Biodiversity and Conservation 16, 245–258. Castilla, J.C., Durán, L.R., 1985. Human exclusion from the rocky intertidal zone of Central Chile - the effects on Concholepas concholepas (Gastropoda). Oikos 45, 391–399. Castilla, J.C., Fernandez, M., 1998. Small-scale benthic fisheries in Chile: on comanagement and sustainable use of benthic invertebrates. Ecological Applications 8, S124–S132. Castilla, J.C., Gelcich, S., Defeo, O., 2007. Successes, lessons and projections from experience in marine benthic invertebrate artisanal fisheries in Chile. In: McClanahan, T.R., Castilla, J.C. (Eds.), Fisheries Management Progress Towards Sustainability. Blackwell Publishing, pp. 25–42. Castilla, J.C., Manriquez, P., Alvarado, J., Rosson, A., Pino, C., Espoz, C., Soto, R., Oliva, D., Defeo, O., 1998. Artisanal ‘caletas’ as units of production and co-managers of benthic invertebrates in Chile. In: Jamieson, G.S., Campbell, A. (Eds.). NRC Research Press, Canada, pp. 407–413. Cocks, K.D., Baird, I.A., 1989. Using mathematical-programming to address the multiple reserve selection problem – an example from the Eyre Peninsula, South-Australia. Biological Conservation 49, 113–130. Dulvy, N.K., Sadovy, Y., Reynolds, J.D., 2003. Extinction vulnerability in marine populations. Fish and Fisheries 4, 25–64. Edgar, G.J., Langhammer, P.F., Allen, G., Brooks, T.M., Brodie, J., Crosse, W., De Silva, N., Fishpool, L.D.C., Foster, M.N., Knox, D.H., Mccosker, J.E., McManus, R., Millar, A.J.K., Mugo, R., 2008. Key biodiversity areas as globally significant target sites for the conservation of marine biological diversity. Aquatic ConservationMarine and Freshwater Ecosystems 18, 969–983. Fernandez, M., Castilla, J.C., 2005. Marine conservation in Chile: historical perspective, lessons, and challenges. Conservation Biology 19, 1752–1762. Fernandez, M., Jaramillo, E., Marquet, P.A., Moreno, C.A., Navarrete, S.A., Ojeda, F.P., Valdovinos, C.R., Vasquez, J.A., 2000. Diversity, dynamics and biogeography of chilean benthic nearshore ecosystems: an overview and guidelines for conservation. Revista Chilena de Historia Natural 73, 797–830. Ferrier, S., Pressey, R.L., Barrett, T.W., 2000. A new predictor of the irreplaceability of areas for achieving a conservation goal, its application to real-world planning, and a research agenda for further refinement. Biological Conservation 93, 303– 325. Fox, N.J., Beckley, L.E., 2005. Priority areas for conservation of Western Australian coastal fishes: a comparison of hotspot, biogeographical and complementarity approaches. Biological Conservation 125, 399–410. Fraschetti, S., D’Ambrosio, P., Micheli, F., Pizzolante, F., Bussotti, S., Terlizzi, A., 2009. Design of marine protected areas in a human dominated seascape. Marine Ecology-Progress Series 375, 13–24. Game, E.T., Watts, M.E., Wooldridge, S., Possingham, H.P., 2008. Planning for persistence in marine reserves: a question of catastrophic importance. Ecological Applications 18, 670–680. Gelcich, S., Godoy, N., Prado, L., Castilla, J.C., 2008. Add-on conservation benefits of marine territorial user rights fishery policies in Central Chile. Ecological Applications 18, 273–281. Gell, F.R., Roberts, C.M., 2002. The fishery effects of marine reserves and fishery closures. Washington, DC 20037, USA. Guarderas, A.P., Hacker, S.D., Lubchenco, J., 2008. Current status of marine protected areas in Latin America and the Caribbean. Conservation Biology 22, 1630–1640..
(7) M.F. Tognelli et al. / Biological Conservation 142 (2009) 3147–3153 Halpern, B.S., Walbridge, S., Selkoe, K.A., Kappel, C.V., Micheli, F., D’Agrosa, C., Bruno, J.F., Casey, K.S., Ebert, C., Fox, H.E., Fujita, R., Heinemann, D., Lenihan, H.S., Madin, E.M.P., Perry, M.T., Selig, E.R., Spalding, M., Steneck, R., Watson, R., 2008. A global map of human impact on marine ecosystems. Science 319, 948–952. Harmelin-Vivien, M., Le Diréach, L., Bayle-Sempere, J., Charbonnel, E., GarcíaCharton, J.A., Ody, D., Pérez-Ruzafa, A., Reñones, O., Sánchez-Jerez, P., Valle, C., 2008. Gradients of abundance and biomass across reserve boundaries in six Mediterranean marine protected areas: evidence of fish spillover? Biological Conservation 141, 1829–1839. Klein, C.J., Chan, A., Kircher, L., Cundiff, A.J., Gardner, N., Hrovat, Y., Scholz, A., Kendall, B.E., Airamé, S., 2008. Striking a balance between biodiversity conservation and socioeconomic viability in the design of marine protected areas. Conservation Biology 22, 691–700. Leslie, H., Ruckelshaus, M., Ball, I.R., Andelman, S., Possingham, H.P., 2003. Using siting algorithms in the design of marine reserve networks. Ecological Applications 13, S185–S198. Lester, S., Halpern, B., 2008. Biological responses in marine no-take reserves versus partially protected areas. Marine Ecology-Progress Series 367, 49–56. Micheli, F., Shelton, A.O., Bushinsky, S.M., Chiu, A.L., Haupt, A.J., Heiman, K.W., Kappel, C.V., Lynch, M.C., Martone, R.G., Dunbar, R.B., Watanabe, J., 2008. Persistence of depleted abalones in marine reserves of central California. Biological Conservation 141, 1078–1090. Mora, C., Andrefouet, S., Costello, M.J., Kranenburg, C., Rollo, A., Veron, J., Gaston, K.J., Myers, R.A., 2006. Coral reefs and the global network of marine protected areas. Science 312, 1750–1751. Mora, C., Ginsburg, R., 2008. A clear human footprint in the coral reefs of the Caribbean. Proceedings of the Royal Society B: Biological Sciences 275, 767–773. Navarrete, S.A., Broitman, B., Wieters, E.A., Finke, G.R., Venegas, R.M., Sotomayor, A., 2002. Recruitment of intertidal invertebrates in the southeast Pacific: interannual variability and the 1997–1998 El Nino. Limnology and Oceanography 47, 791–802. Navarrete, S.A., Wieters, E.A., Broitman, B.R., Castilla, J.C., 2005. Scales of benthicpelagic and the intensity of species interactions: from recruitment limitation to top-down control. Proceedings of the National Academy of Sciences of the United States of America 102, 18046–18051. Possingham, H., Ball, I., Andelman, S., 2000. Mathematical methods for identifying representative reserve networks. In: Ferson, S., Burgman, M. (Eds.), Quantitative Methods for Conservation Biology. Springer Verlag, New York, pp. 291–306. Possingham, H.P., Andelman, S.J., Noon, B.R., Trombulak, S., Pulliam, H.R., 2001. Making smart conservation decisions. In: Soule, M., Orians, G. (Eds.), Conservation Biology: Research Priorities for the Next Decade. Island Press, Washington, DC, pp. 225–244. Pressey, R.L., Ferrier, S., Hutchinson, C.D., Sivertsen, D.P., Manion, G., 1995. Planning for negotiation: using an interactive geographic information system to explore alternative protected area networks. In: Saunders, D.A., Craig, J.L., Mattiske, E.M.. 3153. (Eds.), Nature Conservation: The Role of Networks. Surrey Beatty and Sons, Sydney, pp. 23–33. Pressey, R.L., Nicholls, A.O., 1989. Efficiency in conservation evaluation – scoring versus iterative approaches. Biological Conservation 50, 199–218. Rivadeneira, M.M., Fernandez, M., Navarrete, S.A., 2002. Latitudinal trends of species diversity in rocky intertidal herbivore assemblages: spatial scale and the relationship between local and regional species richness. Marine EcologyProgress Series 245, 123–131. Roberts, C., Bohnsack, J., Gell, F., Hawkins, J., Goodridge, R., 2001. Effects of marine reserves on adjacent fisheries. Science 294, 1920–1923. Rondinini, C., Wilson, K.A., Boitani, L., Grantham, H., Possingham, H.P., 2006. Tradeoffs of different types of species occurrence data for use in systematic conservation planning. Ecology Letters 9, 1136–1145. San Martin, G., Parma, A., Orensanz, J., 2008. The Chilean experience with territorial use rights in fisheries. Handbook of Marine Fisheries Conservation and Management, Oxford University Press. Stallings, C.D., 2009. Fishery-independent data reveal negative effect of human population density on Caribbean predatory fish communities. PLoS ONE 4, e5333. Stewart, R.R., Noyce, T., Possingham, H.P., 2003. Opportunity cost of ad hoc marine reserve design decisions: an example from South Australia. Marine EcologyProgress Series 253, 25–38. Stewart, R.R., Possingham, H.P., 2005. Efficiency, costs and trade-offs in marine reserve system design. Environmental Modeling and Assessment 10, 203–213. Thiel, M., Macaya, E.C., Acuna, E., Arntz, W.E., Bastias, H., Brokordt, K., Camus, P.A., Castilla, J.C., Castro, L.R., Cortes, M., Dumont, C.P., Escribano, R., Fernandez, M., Gajardo, J.A., Gaymer, C.F., Gomez, I., Gonzalez, A.E., Gonzalez, H.E., Haye, P.A., Illanes, J.E., Iriarte, J.L., Lancellotti, D.A., Luna-Jorquerai, G., Luxoroi, C., Manriquez, P.H., Marin, V., Munoz, P., Navarrete, S.A., Perez, E., Poulin, E., Sellanes, J., Sepulveda, H.H., Stotz, W., Tala, F., Thomas, A., Vargas, C.A., Vasquez, J.A., Vega, J.M.A., 2007. The Humboldt current system of northern and central Chile. Oceanography and Marine Biology 45, 195–344. Tognelli, M.F., Silva-Garcia, C., Labra, F.A., Marquet, P.A., 2005. Priority areas for the conservation of coastal marine vertebrates in Chile. Biological Conservation 126, 420–428. Williams, I.D., Walsh, W.J., Schroeder, R.E., Friedlander, A.M., Richards, B.L., Stamoulis, K.A., 2008. Assessing the importance of fishing impacts on Hawaiian coral reef fish assemblages along regional-scale human population gradients. Environmental Conservation 35, 261–272. Worm, B., Barbier, E.B., Beaumont, N., Duffy, J.E., Folke, C., Halpern, B.S., Jackson, J.B.C., Lotze, H.K., Micheli, F., Palumbi, S.R., Sala, E., Selkoe, K.A., Stachowicz, J.J., Watson, R., 2006. Impacts of biodiversity loss on ocean ecosystem services. Science 314, 787–790. Zacharias, M.A., Gregr, E.J., 2005. Sensitivity and vulnerability in marine environments: an approach to identifying vulnerable marine areas. Conservation Biology 19, 86–97..
(8)
Figure

Documento similar