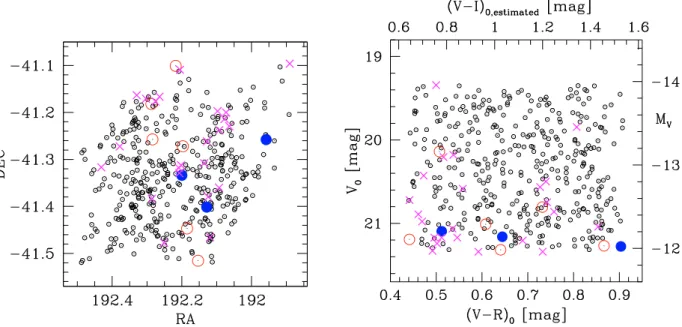
A search for massive ultra compact dwarf galaxies in the Centaurus galaxy cluster
Texto completo
Figure


Documento similar
In this paper, we present new IZJHK s -band photometry and a re-analysis of previous data of the σ Orionis cluster, allowing us to search for faint candidates in an area of ∼790
The separation into in-situ and accreted stars indicates that the negative slope partly origi- nates from the in-situ stars, but the steepening of the gradi- ents in the outer
Plotting the luminosity functions for the two galaxies we find a break in the slope for M51 at log(L) = 38.5 dex (units in erg s −1 ) for M51 in good agreement with the
The circularized stellar mass density profiles for the galaxies in our sample, comparing them with similar mass SDSS ETGs and the massive compact galaxies in Szomoru et al..
- Can affect age by ~0.5 Gyr.. Initial Mass Function.. 2010). - Larger characteristic mass at
Abstract: This paper introduces jNEP: a general, flexible, and rigorous implementation of NEPs (the basic model) and some interestenting variants; it is specifically designed to
We also plotted the total oxygen abundances calculated from the electron temperatures measured using the direct method, only for the long-slit data of knot B, and those estimated
We observed these BCDs by using PMAS integral field spectroscopy in the optical spectral range (3700–6900 Å) and mapping the brightest emission lines, hence their interstellar
