Access resistance in protein nanopores A structure based computational approach
20
0
0
Texto completo
(2) 1. INTRODUCTION Recent advances in microfabrication techniques in the last decades allowed the production of individual nanopores on thin layers of polymeric or solid-state substrates [1-4]. In addition, single-channel electrophysiology made possible analyzing ionic current across biological protein channels of dimensions below the nanometer as well as resolving small current fluctuations. Both in biological and synthetic nanopores, ionic conductance measurements reveal key information about ion-protein interactions, nanopore charge, geometry and size, passage of neutral and charged solutes, partial blockages and other solute properties. In parallel, there has been an increasing awareness that the convergence of ions from bulk to any confined volume may affect the overall ionic transport rate and even become the rate-limiting step in the system. In this connection, some recent experimental studies have stressed the importance of this interfacial contribution for a correct interpretation of the measured current in pores of nanometer dimensions [5-10]. Not only many protein channels but also some nanopores with low aspect ratio (length over aperture radius) exhibit interfacial resistance comparable to the pore proper resistance. In fact, those low aspect ratio nanopores show the best properties for sensing and sequencing purposes. Pores drilled in graphene [11], boron nitride [12] and molybdenum disulfide [13, 14] are a token within this promising field of 2D materials [15] with important biosensing applications. The well-known concept of Access Resistance (AR), also called Entrance Resistance or Convergence Resistance [16-22], first measured in 1992 for alamethicin channels [23], becomes key in the description of ionic transport across nanopores. An analogous concept of hydrodynamic entrance resistance applies to the viscous dissipation in pressure-driven solvent flow [4]. AR is the contribution to the total measured resistance arising from the electrodiffusive limitation that ions experience in passing from bulk solution to confinement within the pore. The method used for measuring AR is the following, with slight variations among different labs: The measured single-channel resistance is assumed to be the sum of the resistance of the pore itself and the AR. Experiments are designed to change the AR without affecting the channel proper resistance. This means varying bulk solution conductivity while pore conductivity remains constant. In practice, this is accomplished by using electrolyte solutions of neutral polymers that are sterically excluded from the pore and only induce variations in the AR. A series of experiments in polymer solutions of different (low) concentrations yield as a limiting value the channel proper resistance and AR is then obtained by substracting this value from the overall channel resistance. The result is essentially the same for polymers of different (high enough) molecular weight. Detailed information can be found elsewhere [6, 23]. It was recently reported [6] that AR may become a dominant contribution to the total channel resistance (nearly 80%) under conditions of low ion concentration or solute crowding in the surrounding solutions, two conditions that are often met in the cell environment. A milestone in the history of AR estimates is due to Hall [17], who developed the analytical expression. 2.
(3) Rac 4 a . 1. (1). for the access resistance to a pore with a circular aperture of radius a set at constant electric potential, in contact with an homogeneous electrolyte solution of conductivity . Hall’s equation is based on the analogy between resistance in conductive media and capacitance in insulating media. Eq. (1) gives the “resistance between a conductive disk on an insulator and a half-spherical electrode very far from the disk” [17, 24]. Because of its simplicity, Eq. (1) has been widely used for both biological and synthetic nanopores. It was also used to size alamethicin pores in several conductance states by measuring AR [25] However, Eq. (1) involves several assumptions (homogeneous solutions, neutral pore and membrane, circular aperture on the membrane plane and constant potential at the pore mouth) that are often approximations to real nanopores [15]. Later, continuum model calculations of AR were reported by using more realistic boundary conditions at the circular pore entrance and by assuming the existence of fixed charges either on the membrane/substrate where the pore is located or within the pore itself [21]. Numerically computed values for a neutral model pore in a neutral membrane were consistent with those using Hall’s expression. It was also found that Eq. (1) overestimated AR in charged pores [21]. Sahu and Zwolak [11] developed a finite-size scaling analysis to make AR estimation in graphene nanopores accessible to Molecular Dynamics (MD) simulations and highlighted the importance of AR in nanopores on 2D materials. To date all attempts to compute AR rely on idealized pore-membrane structures and no comparison with AR measurements in protein channels has been reported. Motivated by the fact that AR cannot be overlooked in a number of biological channels, we focus here on a more realistic calculation in some protein channels. Our aim is computing AR starting from their atomic 3D structure, in solutions of varying ionic concentrations. We use a classical continuum electrodiffusion approach based on NernstPlanck and Poisson (PNP) equations adapted to a 3D framework capable of capturing the actual pore geometry (particularly at the channel mouth), the spatial distribution of protein fixed charges and, in some cases, the membrane charges. Because the channel selectivity may induce ion concentration gradients near the channel-membrane interface, it is necessary to consider the AR as an electrodiffusive problem, not simply the convergence of field lines in a homogeneous medium (as done to obtain Eq. (1)). The PNP theory has been successfully used for estimating conductance across wide channels, although mostly in its one-dimensional version, by using cross-section averaged ion concentrations and electric potential [26-29]. The PNP-3D code adds notable improvements to 1D mean field approaches because it incorporates the channel 3D atomic structure and the actual location of ionizable residues, which is largely responsible for the potential distribution along the aqueous pore and in the surrounding solution. Notwithstanding its limitations, the PNP-3D approach is a valuable tool and it has proved complementary to other more computationally demanding approaches like MD simulations. It has a reasonably good predictive power when used for calculations over a wide range of ion concentrations and solution pH.. 3.
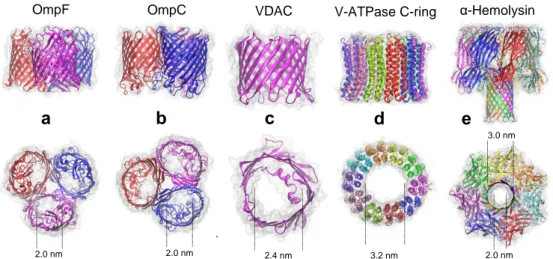
(4) OmpF. a. OmpC. b. VDAC. c. V-ATPase C-ring. d. α-Hemolysin. e 3.0 nm. 2.0 nm. 2.0 nm. 2.4 nm. 3.2 nm. 2.0 nm. Figure 1. Protein channels studied. Cartoon representation from the corresponding Protein Data Bank (PDB) structure and approximate aperture size of a) Outer Membrane Protein F (OmpF, PDB ID = 2OMF), b) Outer Membrane Protein C (OmpC, PDB ID = 2J1N), c) Voltage-dependent anion channel (VDAC, PDB ID = 3EMN), d) Proteolipid ring of Yeast V-ATPase enzyme (V-ATPase C-ring PDB ID = 3J9T) and e) -hemolysin (PDB ID = 7AHL).. The common trait of the five protein channels studied here (Fig. 1) is their multiionic character and moderate charge selectivity. In addition, almost all of them share a relatively low aspect ratio, so AR contribution may be important. The differences between them lie in their oligomeric structure: the bacterial porins OmpF [30] and OmpC [31] from E. Coli are three-pore trimers, the mitochondrial porin VDAC is a single-pore monomeric channel [32], and the Proteolipid ring of V-ATPase enzyme [33] and the toxin -hemolysin from S. Aureus [34] are single-pore multimeric channels. We perform here AR calculations based on real pore-solution interfaces and the corresponding channel and membrane charge distributions. First, to validate our numerical approach, we compare our AR computations with the only available experimental AR measurements over a wide salt concentration range (5 mM–1 M KCl) reported for the bacterial porin OmpF in neutral and charged membranes [6]. Then, we apply the same computational procedure to the other four protein channels and show that in very diluted solutions our numerical calculations differ from analytical (Hall’s eq.) estimates in most channels studied, whereas Eq. (1) can be safely used to estimate AR in concentrated solutions. We discuss the particular case of -hemolysin where some AR measurements [35] and calculations yield values apparently inconsistent with the size of channel apertures. Finally, we discuss AR measurements in channels where oligomerization implies that several aqueous pores contribute to single-channel conductance. Our calculations show that pore clustering increases the effective overall AR. This enables us to interpret correctly the relationship between pore size and AR measurements or calculations in three-pore channels or in other pore cluster structure.. 4.
(5) 2. MATERIAL AND METHODS The mean field phenomenological equations describing ion transport through ionic channels are the Poisson-Nernst-Planck equations (PNP). These equations assume than ion are point particles that can be described through local concentration functions. PNP approach neglects some ion-ion correlations, hydration of charged species and atom thermal fluctuations, wich are present in all atom treatments such as molecular dynamics [28]. These include the Poisson equation, 0 ,. (2). where is the relative dielectric constant, ε0 is the vacuum permittivity, is the electric charge volume density and is the local electrostatic potential. The electric charge density contains two main contributions arising from the protein ionizable groups and from ions in solution, which rearrange in the presence of electric fields. Nernst-Planck equations rely on the assumption of ion flux linearity with the electrochemical potential gradient, and are often expressed as: ji Di ci zi ci e k BT .. (3). In Eq. (3) ji stands for the flux density of ionic species i with charge number zi, diffusion coefficient Di and concentration ci. e is the elementary charge, kB the Boltzmann's constant and T the absolute temperature. The above equations are usually rewritten using Slotboom variables, defined as: ci cio exp zi e k BT ,. (4). ji Di exp zi e k BT cio .. (5). so that Eq. (2) becomes:. Under steady state conditions, Nernst-Planck equation is numerically solved together with Poisson’s equation and the continuity equation for each ionic species (here, K+ and Cl-): ji 0. (6). To solve numerically this coupled system of second order partial differential equations we used FiPy [36], written in Python [37]. The cubic box used combines two different mesh sizes: a finer one of 1 Å for the protein region and a coarser one for the rest of the box. See for details Figures S1-S2 in Supplementary Material. This is accomplished by calling the gmsh code [38] from FiPy. An additional in-house code, developed for this purpose, allowed reading and processing the 3D protein structures in the PQR protein format (a modification of the PDB format to include the charge and radius of each atom in the structure). The procedure is the following: First, the structure is oriented with the channel axis approximately parallel to the z-axis. Then, to mimic the lipid membrane, a structureless. 5.
(6) domain inaccessible to the electrolyte solution is added, which divides the box into two regions connected by the protein. As a result, the integration box comprises two regions with different dielectric constant ( = 80 in the solution and = 20 in the protein and the membrane [39, 40]) and different ion and solvent accessibilities. Since FiPy does not allow internal boundary conditions, ionic- and solvent-accessible regions and other positiondependent variables are built using a mask, so that the internal boundary conditions are automatically satisfied (although with some extra numerical cost). FiPy automatically assigns boundary conditions on the external surfaces of the integration box to no-flow/fields (Neumann type). Therefore, we only need to define specific concentration and potential values (Dirichlet type) on the outer surfaces perpendicular to the channel axis. We assume that diffusion coefficients are local functions and use for OmpF and OmpC the expression proposed by Im and Roux [28], while for the other channels we use a hydrodynamic expression [41, 42] derived to match experiments and MD simulations. FiPy used by default PySparse [43], which in our tests proved to be extremely stable and robust in terms of convergence under different conditions and geometries. The solution procedure performs a first iteration to solve (to the required accuracy) Poisson's Eq. (2) and successive iterations to solve, using Slotboom variables, for Eqs. (2) and (5)-(6) until the desired convergence is achieved (residual less than 5 ×·10-7). All calculations were carried out in a 12-core Intel-i7 workstation with 140 GB of RAM. The outputs of numerical calculations are electric potential profiles and ionic concentrations. Additionally, we computed the ionic fluxes and averaged the electrostatic potential over any z-crossection of the solvent-accessible region in the simulation box. These profiles were later used to calculate the total channel resistance (defined as the ratio between the total potential drop across the system ΔV and the electric current I) and the channel AR. The access resistance on each side Rac was defined as the ratio ΔVmouth/I, where ΔVmouth is the external potential drop across the solution on each side of the channel. ΔVmouth is obtained by subtracting the equilibrium potential profile (when ΔV = 0) from the total potential drop. This procedure required to solve the PNP equations twice, both under an applied external potential and under equilibrium conditions (ΔV = 0).. 3. RESULTS AND DISCUSSION 3.1 Access resistance in OmpF channel: measurements vs calculations We started by comparing the PNP-3D numerical calculations with available AR measurements in the literature. The only AR measurements for a channel over a large concentration range were recently reported for the OmpF channel [6]. Earlier AR measurements focused only on concentrated (1 M) solutions. Bezrukov and colleagues measured AR for several conductance states of Alamethicin in 1 M NaCl solutions [44] and for -hemolysin in 1 M KCl [45]. Aksoyoglu et al. [35] measured AR in three wide channels (VDAC, -hemolysin and OmpC) in 1 M KCl solutions. All these experiments were based on measuring the single-channel conductance in neutral membranes upon changing the conductivity of the solution with varying concentrations of neutral polymers (polyethylene glycol (PEG) or Dextran with sufficiently high molecular weight to exclude them sterically from the pore).. 6.
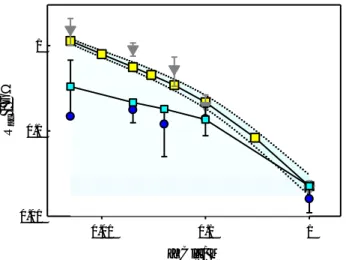
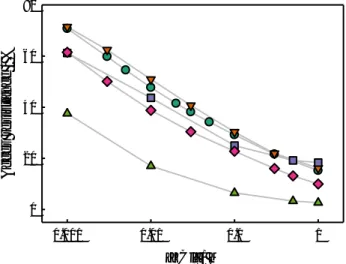
(7) R ac / GW. 1. 0.1. 0.01 0.01. 0.1. 1. [KCl] / M. Figure 2. Access resistance Rac on each side of the (trimeric) OmpF channel in neutral and charged membranes as a function of bulk KCl concentration. Triangles and circles correspond to measurements reported by Alcaraz et al. [6] in neutral and charged membranes, respectively. Yellow and cyan squares correspond to our PNP calculations in neutral and charged membranes, respectively. Dotted lines correspond to Rac calculations (for neutral membranes) when the selected pore region is made 4 Å shorter (top curve) and 4 Å longer (see main text). Solid lines are drawn only to guide the eye. The experimental error of the Rac measurement in PS membranes (blue circles) in 5 mM KCl is very large and the lower part of the error bar is not drawn.. To validate our numerical approach, we first compare our Rac computations with experimental Rac measurements reported for the bacterial porin OmpF [6] in KCl solutions of different concentrations (5 mM-1 M). Figure 2 shows Rac calculations (yellow squares), i.e. AR on each pore mouth, and experimental measurements (grey triangles) reported by Alcaraz et al. [6] for a single OmpF channel inserted in a neutral DiphytanoylPhosphatidylcholine (DPhPC) membrane in KCl solutions. Because of the extracellular loops of OmpF channel and the turns in the cytosolic side (see cartoon in Figure 1), the channelsolution interface is not sharply defined (the channel aperture does not resemble a circle parallel to the membrane plane as in a model pore). This poses a problem to discriminate the AR contribution from the total calculated channel resistance. For our calculations (squares) we assumed that the pore spans the region between axial coordinates 15-45 Å (zcoordinate from the PDB structure 2OMF). Since channel openings are somewhat ill-defined, there is some flexibility in the selection of the limits of the pore. Therefore, we also calculated Rac assuming that the pore spans a little longer region (13-47 Å, bottom dotted line) or a little shorter region (17-43 Å, top dotted line). The shaded region indicates the range of calculations between these two cases. The difference in Rac between these two extreme assumptions of boundary position (±0.2 nm on each side) is not that large: between -5 M and +7 M with respect to the accepted calculation of 22.5 M at 1 M KCl. PNP-3D calculations of Rac for a neutral membrane agree reasonably well with measurements over a wide range of concentrations, with computed values falling within the experimental error except for 20 mM solutions.. 7.
(8) The other two plots show Rac calculations (cyan squares) and experimental measurements (blue circles) [6] for a single OmpF channel inserted in a negatively charged DiphytanoylPhosphatidylserine (DPhPS) membrane. Except for the membrane surface charge density of 0.36 C/m2 (a standard value for DPhPS), all parameters used in numerical calculations are the same as those used in neutral membranes. The net negative charge of lipid polar head groups increases the conductivity of the solution near the pore mouth and this yields a lower Rac than in the case of the channel embedded in a neutral membrane. This effect becomes greater as ion screening is weaker, i.e. upon decreasing concentration. Note that the standard deviation of Rac measurements in charged membranes is considerably higher than in neutral membranes, particularly in very diluted solutions (Note that the the lower part of the error bar of the 5 mM KCl measurement in PS is not drawn). Numerical calculations show agreement with Rac measurements within the experimental error. This fact enables us to use this numerical approach to calculate Rac in other channels for which there are no Rac measurements or at least not over a wide range of salt concentrations. The two series of Rac calculations (in PC and PS membranes) plotted in Figure 2 show that the PNP-3D numerical approach using the OmpF atomic structure captures the decrease of conductivity in the solution next to the channel mouth due to channel charged residues (PC membranes) and to channel and lipid charges (PS membranes). This effect, originated by counterion accumulation at the channel-solution interface, is enhanced in low ionic strength solutions. Both series of experiments and calculations depart from the predictions of Eq. (1) in diluted solutions.. 3.2 Access resistance in other low aspect ratio channels Next, we calculated Rac in other four multiionic channels with known atomic 3D structure. The aim was a) to check whether Rac computations follow a concentration dependence pattern similar to that of OmpF and see how well those values match the predictions of Eq. (1); and b) to compare numerical results at 1 M KCl with AR measurements in 1 M KCl previously reported for three of them (VDAC, OmpC and -hemolysin) in neutral membranes. The voltage dependent anion channel of the outer mitochondrial membrane, commonly known as VDAC [46] is a monomeric channel with beta-barrel structure and a pore diameter around 2.4 nm (Fig. 1c). The proteolipid C-ring of the Yeast V-ATPase enzyme forms a channel [47] with approximate cylindrical structure and a helix bundle that opens a large pore about 3.2 nm in diameter (Fig. 1d), although each mouth is slightly different in size. OmpC is a porin with three 16-stranded hollow β-barrels associated to form a tight trimer (Fig 1b). Its periplasmic outlet is very similar to OmpF, whereas extracellular loops arrange in a somewhat different manner. Rather than pore size (mouths are about 2 nm in diameter) what differentiates OmpC from OmpF is the configuration of charged residues that yield a little higher cationic selectivity in OmpC.. 8.
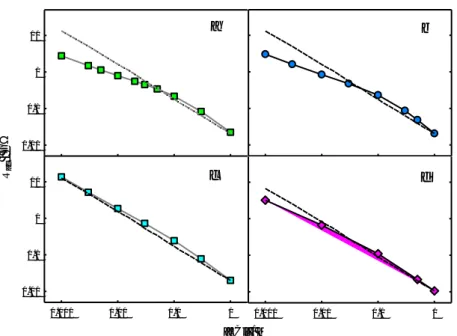
(9) 10. a. b. c. d. 1. Rac / GW. 0.1. 0.01. 10. 1. 0.1. 0.01 0.001. 0.01. 0.1. 1. 0.001. 0.01. 0.1. 1. [KCl] / M. Figure 3. Calculated Rac (average of AR on both sides) for the protein channels OmpF (a), OmpC (b), VDAC (c) and V-ATPase C-ring (d) in neutral membranes as a function of bulk solution concentration. Solid symbols correspond to PNP-3D calculations using the corresponding PDB channel structures (OmpF: 2OMF; OmpC: 2J1N; VDAC: 3EMN; V-ATPase C-ring: 3J9T) and solid lines are only to guide the eye. Dashed lines represent Rac values calculated using Eq. (1).. Figure 3 shows calculated Rac (average of AR on both mouths) for OmpF, OmpC, VDAC and VATPase C-ring, as labeled, in neutral membranes over a wide range of KCl concentrations, from 1 mM up to 1 M. The calculated Rac values are very similar for both mouths in these four channels, so that for plotting the concentration dependence we use the average Rac of the two mouths. Solid symbols correspond to PNP-3D calculations using as input the corresponding PDB channel structures (OmpF: 2OMF; OmpC: 2J1N; VDAC: 3EMN; V-ATPase C-ring: 3J9T). The pattern in these four channels is similar. Upon a concentration decrease of 3 orders of magnitude, Rac increases more than two orders of magnitude. In the two singlepore channels (VDAC and V-ATPase C-ring) Rac is almost inversely proportional to solution concentration. In the three-pore channels (OmpF and OmpC), a slight deviation from the 1/ law is predicted in very diluted solutions. This fact might be due to the enhancement of electrostatic interactions caused by the proximity of the three monomers with their charged residues. The effective protein charge “seen” by permeating ions in one pore is probably higher than the sole charge of that particular monomer (and it includes buried charged residues [39,40]). We already showed for an ideal pore in 0.1 M KCl (see figure 7 in ref. [21]) that the higher the pore charge, the greater is the overestimation of Rac by Hall’s equation. At very low ionic strength (e.g. c ≤ 10 mM) Debye’s length is greater than 3 nm and comparable to channel length, so this increase in the pore electrostatic potential may cause local conductivity at the channel entrance to be higher than the bulk conductivity entering Eq. (1). This small deviation from the 1/ law is also seen in OmpF Rac measurements in very diluted solutions (Figure 2). It might be tentatively explained by an enlargement of the channel mouth in low screening conditions. However, there is no experimental evidence for. 9.
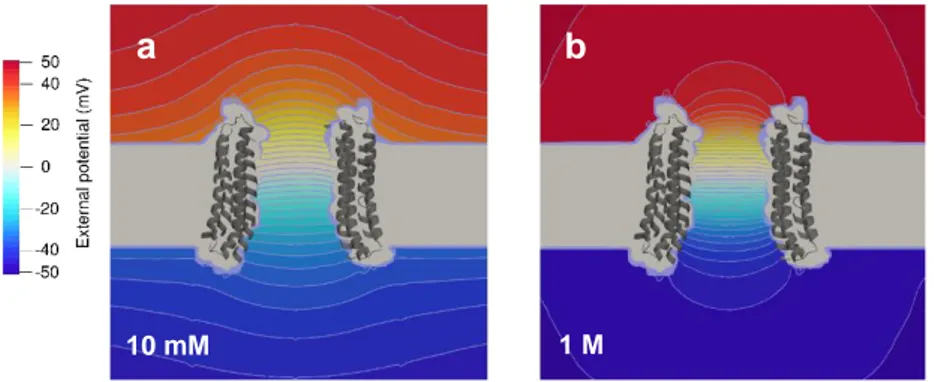
(10) this effect. In addition, the deviation is also seen in our PNP-3D calculations, which use a fixed size of the channel mouth given by the crystal structure. The range of concentrations explored spans three orders of magnitude and goes from very diluted solutions (ideal solutions) to concentrated solutions where ion activity coefficients differ considerably from unity. Since deviations from the 1/ law occur at low concentrations where activity coefficients approach unity, they can hardly be adscribed to non-ideality of solutions (see Supplementary Material, Figures S3-S4). Dashed lines show Rac values calculated from the classical Hall’s expression, Eq. (1), using measured KCl conductivities at each concentration and the pore radius value obtained from the PNP-3D computation of Rac for 1 M KCl. The comparison of the two series of Rac values on each figure demonstrates that using Eq. (1) for computing Rac is equivalent to performing a more detailed structure-based numerical computation, provided salt concentration is not very low and the aperture size is known. Only in the case of the two trimeric channels, OmpF and OmpC, in very diluted solutions, the differences between PNP-3D calculations and Eq. (1) predictions become large.. a. 10 mM. b. 1M. Figure 4. Spatial variation of the externally applied potential (for a total ΔV = 100 mV) across the V-ATPase C-ring channel in concentrated and diluted solutions. a) Contour plot of equipotential lines in 10 mM KCl; b) Contour plot in 1 M KCl.. Figure 4 helps to visualize this large change of Rac with salt concentration seen in the above calculations. It shows the different distribution of the external voltage drop across the VATPase C-ring channel in concentrated (1 M KCl) and diluted solutions (10 mM KCl) that causes a hundred-fold increase in Rac. The contour plots of the externally applied potential show a much larger potential drop outside the channel in a 10 mM solution (left) than in a 1 M solution (right), which implies a larger Rac in the diluted solution. Equipotential lines in the right panel are almost semicircular, which means that the assumption of hemispheric equipotential surfaces made in the derivation of Hall’s expression for an ideal circular hole fits well the real mouth of a single-pore channel in concentrated solutions. The above PNP3D calculations (Figure 3) are in good agreement with reported Rac measurements in 1 M KCl solutions for OmpF, OmpC and VDAC as shown in Table 1.. 10.
(11) Table 1 Comparison of PNP-3D calculations and measured Rac in 1 M KCl Channel OmpF OmpC VDAC. Calculated Rac (M) 22.5 20.5 20.0. Measured Rac (M) 21 ± 5 [6] 28.1 ± 0.1 [35] 19.8 [35]. Additionally, we calculated Rac in another wide, multiionic channel, the toxin -hemolysin from Staphylococcus aureus [34], which is not a low aspect ratio channel as the other four. However, its mouths on each side are different in size (what implies asymmetry in Rac ) and this deserves a separate discussion. Its importance in biosensing applications and as a promising alternative to conventional DNA sequencing technology makes it one of the beststudied bacterial toxins [48]. Seven heptamers oligomerize to form a mushroom-like shaped channel (Fig. 1e), with a β-barrel stem spanning the membrane and a large cap protruding on the extracellular side. The two openings of the aqueous pore are different in size, the cap one (3 nm) being wider than the stem one (2 nm). Therefore, Rac should be slightly different on each side. Calculations of Rac for both sides (Fig. 5) show some unexpected results. First, the ratio between Rac on each side does not scale with the inverse of the ratio of their mouth diameters as predicted by Eq. (1). The calculated Rac values for the stem mouth (semi-filled right circles) follow a similar pattern to the other four channels (Fig. 3) but Rac calculations for the cap mouth (semi-filled left circles) yield unusually low values that are virtually zero at high salt concentrations. Bezrukov et al. [45] reported a total AR for this channel in 1 M KCl of 26 ± 5 M and Aksoyoglu et al. [35] obtained 147 ± 6 M from their 1 M KCl experiments. Our calculated value for this concentration is 35.3 M (which corresponds totally to the stem mouth), not much different from the first of the two previous measurements. However, there is no clear explanation for such disparity between calculated Rac on each channel mouth. Interestingly, Aksimentiev and Schulten [49] showed in their MD simulations that the cap vestibule is practically equipotential with the adjacent bulk solution, which implies a very small Rac on this side of the channel. They also reported the existence of several small side channels close to the membrane surface, connecting the large cap vestibule with the external solution, which might act as electrical shunt and reduce Rac on the extracellular side opening of the channel. This fact could potentially explain why Rac on the cap mouth of the channel becomes so small and even negligible for concentrations of 0.5 M and above. The contour plot of equipotential lines shown in Figure 5b confirms this conjecture. There is hardly any potential drop at the cap mouth. The whole cap vestibule is practically equipotential, in contrast with the applied potential drop near the stem mouth. This case of -hemolysin is an example of how Rac calculations need to take into account subtle structural details beyond the pore opening size. Using Eq. (1) and the structural data [34] for the size of the two channel mouths might overestimate the value of the total AR.. 11.
(12) a-Hemolysin (+100 mV). a. b. R ac / GW. 100. 10. 1. 0.1. 0.001. 0.01. 0.1. 1. [KCl] / M. Figure 5. a) Calculated Rac on both pore sides for -hemolysin channel in neutral membranes as a function of solution concentration (The applied potential was 100 mV). Green semi-filled right symbols correspond to the stem mouth and red semi-filled left symbols to the cap mouth. Solid lines are drawn only to guide the eye. b) Contour plot of equipotential lines in 1 M KCl.. Finally, rather than the absolute value of the total AR, what is often more important is its contribution to the overall channel conductance measurement so that interfacial effects may be left out when the focus is on the relationship between conductance and the channel intrinsic properties. Figure 6 summarizes our calculations in the five channels studied. It displays the ratio of the total AR over the whole channel resistance, 2Rac/(Rp+2Rac) as percentage (note that the total AR in the case of -hemolysin is the sum of the Rac values on each side, which are different).. Acces resistance / %. 80. 60. 40. 20. 0 0.001. 0.01. 0.1. 1. [KCl] / M. Figure 6. Percentage of the total access resistance in relation to the overall channel resistance in neutral membranes as a function of solution concentration. Different symbols stand for each channel: VDAC (down triangles), OmpF (circles), V-ATPase C-ring (squares), OmpC (diamonds) and -hemolysin (up triangles). Lines are drawn only to guide the eye.. 12.
(13) At physiological concentrations (0.1 M), percentages range from 7% in -hemolysin (a channel with a much higher aspect ratio than the others) to 30% in VDAC and OmpF. In more diluted solutions, the AR contribution rockets up to very high values and it becomes even higher than the resistance Rp of the pore itself. The asymptotic behavior of some of the plots in Figure 6 for large ion concentrations is consistent with the prediction for an ideal cylindrical, neutral (or slightly charged) pore of aspect ratio L/a .. 3.3 The relationship between access resistance and the size of the channel aperture Measurements of Rac have been used for sizing several ion channels by using PEG or Dextran solutions [44, 45, 48]. Channel conductance measurements in PEG solutions had been used earlier to estimate the size of the narrowest part of the channel. For a survey of references, see [50]. Using Eq. (1) in the high concentration range (where it is valid) allows obtaining the size of the channel aperture from measurements of Rac and bulk solution conductivity. Several authors have noted that such diameter value is just an approximation and it is in fact a context-dependent value because of the limitations of the analytical expression used for the Rac, as made clear in our calculations. It would only make sense in channels resembling ideally neutral cylindrical pores like VDAC, where the estimated diameter from Rac measurements (19.8 M in 1 M KCl as reported in [35]) and Eq. (1) is 2.4 nm, in good agreement with structural data. Our calculations for V-ATPase C-ring pore in 1 M KCl are consistent with a diameter of 3.1 nm, essentially the same value from structure (see Fig.1, d). However, in trimeric channels like OmpF and OmpC single-channel measurements involve the transport of ions across three aqueous pores and the measured Rac is the result of limited electrodiffusion not to a single aperture but to three pores that belong to the same oligomeric channel structure. Therefore, AR is the result of the converging current lines to the three pore mouths on each side. A simplistic view could be considering the effective Rac like the equivalent of three resistors in parallel, each one corresponding to the Rac to a single monomer pore. According to this interpretation, for an ideal three-pore system, the relationship between the measured Rac and the radius of a single pore would be, in accordance with Eq. (1), Rac = (4 a)-1/3. Thus, the value of Rac = 21 M reported for OmpF in 1 M KCl [6] would be consistent with a pore diameter of 0.7 nm, which is considerably lower than the actual diameter, ca. 2 nm [30]. It seems that the picture is a bit more complex in protein channels with several openings. Ion current lines may interfere with each other if pores are closely packed together (particularly in concentrated solutions), thus producing an effective Rac that is slightly bigger than one third of the Rac corresponding to each pore (i.e. the equivalent to three independent pores). Gadaleta et al. [51] reported sub-additive ionic transport across arrays of solid-state nanopores and discussed the overall access resistance of a pore array by using the analogy between ion transport and electrostatic capacitance that led to Eq. (1) [16, 17]. For a 2D array of N ideally cylindrical, neutral pores, they obtained the following approximate expression for the effective Rac:. 13.
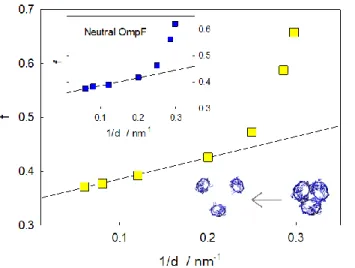
(14) Rac N . 1 1 a 1 N N 4 a d. (7). Where N is a geometric factor (dependent on N) and d is the distance between pore centers. Consequently, the ratio f between the Rac of each single pore and the overall Rac for three pores would be given by f Ractrim Racmon. a 1 / 3 d . (8). For a three-pore array their approach yields a geometric factor 1.3. Then, by assuming the three pores are closely packed together so that the distance d is very similar to the actual pore diameter (2a/d 1), we get f 0.6. This gives an overall Rac for the trimer of more than one-half of the Rac of each single pore instead of the one-third factor anticipated for the case of non-interacting pores. To check this prediction with our numerical approach using the actual channel 3D structure, we calculated Rac for an OmpF trimeric channel as well as for a single OmpF monomer in 1 M KCl. Then, we did a series of calculations by modifying the trimer structure so that monomers were artificially separated from each other a distance d and we calculated the corresponding value of Rac for the trimer for several values of d. For each separation between monomers we obtained the ratio f Ractrim Racmon .. Figure 7. Calculated ratio f between Rac for the OmpF trimer and Rac for a single OmpF monomer for different artificial separations d between monomers (yellow filled squares). The lowest value of d corresponds to the actual distance between pore centers in the OmpF trimer (3.36 nm). PNP-3D calculations are made for 1 M KCl solutions in a neutral membrane. Inset show calculations for an OmpF channel with all ionizable residues set in neutral state (blue filled squares). Regression lines correspond to linear fits of the f values for the four largest monomer separations (d = 5-16.8 nm). The regression equations are f = 0.35 + 3.94/d (r2 = 0.998) for the main panel and f = 0.36 + 2.94/d (r2 = 0.980) for the inset.. 14.
(15) The results for the ratio f are plotted in Figure 7 as yellow squares. For the actual distance between pore centers in the OmpF trimer (d 3.36 nm, according to the PDB 3D structure), the ratio f is 0.66. This means that interference between the three pores causes an increase in the overall Rac that yields Ractrim 2 / 3 Racmon . When we increased five times the distance between monomers (d = 16.8 nm), f dropped to 0.37, almost half the initial value. Therefore, according to our calculations, the overall Rac is sensitive to the proximity of pores. For large enough pore separations (d ≥ 5 nm), f scales with the inverse distance 1/d. This agrees with the prediction of Eq. (8) for an array of equally spaced neutral nanopores, although OmpF is not a neutral pore. According to the linear fit of PNP-3D calculations for the four largest separations (d = 5-16.8 nm), the limiting value of f for three hypothetical OmpF monomers separated a distance much larger than their pore diameters would be 0.35, as seen in the intercept value. This is equivalent to Ractrim Racmon 3 , i.e. the initial assumption of three resistors in parallel. Comparison of this linear fit with Eq. (8) yields an effective geometric factor for OmpF trimer of 3 1.2, which agrees with the same factor predicted for an array of three neutral pores. It might be argued that electrostatic interactions between charged residues of each OmpF monomer could influence the overall Rac of the channel. To assess this hypothetical effect, we wondered what the result of calculations on the same channel would be under conditions resembling a set of three neutral pores. For this purpose, we manipulated the ionization state of the OmpF protein to set all ionizable residues uncharged, while keeping the atomic 3D structure of the channel unaltered. The result of this new series of PNP-3D calculations is shown in Figure 7 as an inset (blue squares). For the neutral trimer, the ratio f is 0.62, very similar to the 0.66 reported above. The way this ratio f changes with monomer separation is qualitatively similar to the case of OmpF in its native (weakly charged) state. f scales with 1/d for large monomer separation and the linear fit of the f values for the largest separations (d = 5-16.8 nm) yields a limiting value of f = 0.36, essentially the same as the 1/3 factor for three independent pores. The similarity between both series of calculations allows concluding that the enhancement of AR in a three-pore channel is mainly of geometric rather than electrostatic origin. This explains why the treatment by Gadaleta et al. [51], originally developed for neutral pores (where surface conduction is negligible), agrees with our calculations in a moderately selective channel in concentrated solutions. Interestingly, there is increasing experimental evidence that biological channels frequently form clusters on membrane surfaces [52]. Berezhkovskii et al. [53] theoretically analyzed the effect of channel clustering, which leads to single pores to compete for diffusing molecules. They obtained simple formulas for the effective rate constants that characterize trapping of diffusive point particles by perfectly absorbing circular disks (with different structures and packing lattices) on a reflecting flat surface. Their treatment, although purely diffusive and based on ideal geometries, shows interesting analogies with ours and leads to the conclusion that the trapping efficiency of an individual disk decreases as the number of absorbing disks of the cluster increases and/or the distance between disks increases. By considering that the decrease in trapping efficiency goes parallel to the increase in pore AR, the analogy is clear. In the case of tight packing, this coincidence between their reduction in the cluster trapping efficiency and our enhanced AR underlines the importance of channel clustering in estimation of AR. After all these calculations of the AR enhancement for arrays of several pores we come back. 15.
(16) to the initial issue raised at the beginning of this section: the use of Eq. (1) to estimate the pore aperture radius from Rac measurements or, vice versa, using Hall’s equation to calculate Rac provided the pore radius is known. According to our calculations in a real weakly selective channel, it appears that the correct relationship between the measured Rac in concentrated solutions and the radius of a single pore in a trimeric channel should be Ractrim f 4 a . Thus, the measurement of Rac = 21 ± 5 M for OmpF in 1 M KCl [6] (Table 1) would yield a diameter ca. 1.5 ± 0.4 nm. Analogously, the value Rac = 28.1 ± 0.1 M reported for OmpC in 1 M KCl [35] would give a diameter about 1.12 nm. Both values are closer to structural data than previous estimations from measured overall Rac. Finally, we want to point out that the AR enhancement effect should be even more relevant in biological pores of lower aspect ratio than the two trimeric channels OmpF and OmpC as well as in other single-pore channels that are frequently clustered on membrane surfaces.. 4. CONCLUSIONS Motivated by the need of a correct interpretation of channel conductance measurements, we have calculated the access resistance for several protein channels by using a continuum electrodiffusion approach based on 3D Poisson-Nernst-Planck equations. The computing procedure uses as input each channel atomic 3D structure instead of an ideal pore model. This enables us to account for the actual pore geometry, the spatial distribution of charged ionizable residues in the protein, the membrane lipid charges and the ion concentration gradients near the channel-membrane interface. In this way we add specific channel structural information to classical Rac estimations based on idealized pore models. Rac calculations agree within experimental error with measurements in the bacterial porin OmpF for a wide range of concentrations in neutral and charged membranes. Numerical computations are also consistent with measurements performed in other mesoscopic channels (VDAC, OmpC and -hemolysin) in 1 M KCl solutions. In concentrated electrolyte solutions our numerical calculations give Rac values similar to those obtained with the widely used Hall’s equation (Eq. (1)) [18]. In contrast, for some channels (OmpF and OmpC) the structure-based calculations predict much lower values of Rac in diluted solutions. We analyze in detail the case of -hemolysin where calculations based on Eq. (1) and the channel mouths size overestimate Rac values and overlook the fact that in concentrated solutions the access resistance to the cap mouth is virtually zero. This is especially illustrative of the fact that considering only the size of the channel mouth and the bulk conductivity of the adjacent solution can sometimes lead to Rac miscalculation. Finally, we show that the overall Rac in three-pore trimeric channels like OmpF and OmpC is higher than the equivalent to adding up each pore Rac (as three resistors arranged in parallel) because of mutual interaction between converging ionic fluxes. This fact has practical implications in low aspect ratio nanopores when Eq. (1) is used to estimate the pore aperture radius from Rac measurements or, vice versa, when the pore radius is known and Rac is calculated by using Eq. (1). This enhancement of access resistance may be important not only in three-pore trimeric channels but also in several monomeric pores that are known to form tightly packed clusters on membrane surfaces [52, 53] .. 16.
(17) 5. ACKNOWLEDGEMENTS This work was supported by the Government of Spain (project no. FIS2016-75257-P AEI/FEDER, UE), and Universitat Jaume I (project no. UJI-B2018-53). The authors thank Dr. Antonio Alcaraz and Dr. María Queralt-Martín for helpful discussions and critical reading of the manuscript.. Declarations of interest: none.. REFERENCES 1 2. 3. 4. 5. 6. 7. 8 9. 10. S. Howorka, Building membrane nanopores, Nat. Nanotechnol. 12 (2017) 619–630. doi:10.1038/nnano.2017.99. J.R. Werber, C.O. Osuji, M. Elimelech, Materials for next-generation desalination and water purification membranes, Nat. Rev. Mater. 1 (2016). doi:10.1038/natrevmats.2016.18. K. Lee, K.B. Park, H.J. Kim, J.S. Yu, H. Chae, H.M. Kim, K.B. Kim, Recent Progress in Solid-State Nanopores, Adv. Mater. 30 (2018) 1704680. doi:10.1002/adma.201704680. J. Buchheim, K.P. Schlichting, R.M. Wyss, H.G. Park, Assessing the ThicknessPermeation Paradigm in Nanoporous Membranes, ACS Nano. 13 (2019) 134–142. doi:10.1021/acsnano.8b04875. J. Wang, J. Ma, Z. Ni, L. Zhang, G. Hu, Effects of access resistance on the resistivepulse caused by translocating of a nanoparticle through a nanopore, RSC Adv. 4 (2014) 7601–7610. doi:10.1039/c3ra46032k. A. Alcaraz, M.L. López, M. Queralt-Martín, V.M. Aguilella, Ion Transport in Confined Geometries below the Nanoscale: Access Resistance Dominates Protein Channel Conductance in Diluted Solutions, ACS Nano. 11 (2017) 10392–10400. doi:10.1021/acsnano.7b05529. M. Queralt-Martín, M.L. López, M. Aguilella-Arzo, V.M. Aguilella, A. Alcaraz, Scaling Behavior of Ionic Transport in Membrane Nanochannels, Nano Lett. 18 (2018) 6604– 6610. doi:10.1021/acs.nanolett.8b03235. Y. Ma, J. Guo, L. Jia, Y. Xie, Entrance Effects Induced Rectified Ionic Transport in a Nanopore/Channel, ACS Sensors. 3 (2018) 167–173. doi:10.1021/acssensors.7b00793. H. Arjmandi-Tash, A. Bellunato, C. Wen, R.C. Olsthoorn, R.H. Scheicher, S.L. Zhang, G.F. Schneider, Zero-Depth Interfacial Nanopore Capillaries, Adv. Mater. 30 (2018) 1703602. doi:10.1002/adma.201703602. J. Gao, X. Liu, Y. Jiang, L. Ding, L. Jiang, W. Guo, Understanding the Giant Gap between Single-Pore- and Membrane-Based Nanofluidic Osmotic Power Generators, Small. 15. 17.
(18) 11 12. 13. 14. 15. 16 17 18 19 20. 21. 22 23 24 25. 26 27. 28. (2019) 1804279. doi:10.1002/smll.201804279. S. Sahu, M. Zwolak, Maxwell-Hall access resistance in graphene nanopores, Phys. Chem. Chem. Phys. 20 (2018) 4646–4651. doi:10.1039/c7cp07924a. S. Liu, B. Lu, Q. Zhao, J. Li, T. Gao, Y. Chen, Y. Zhang, Z. Liu, Z. Fan, F. Yang, L. You, D. Yu, Boron nitride nanopores: Highly sensitive DNA single-molecule detectors, Adv. Mater. 25 (2013) 4549–4554. doi:10.1002/adma.201301336. M. Graf, M. Lihter, M. Thakur, V. Georgiou, J. Topolancik, B.R. Ilic, K. Liu, J. Feng, Y. Astier, A. Radenovic, Fabrication and practical applications of molybdenum disulfide nanopores, Nat. Protoc. 14 (2019) 1130–1168. doi:10.1038/s41596-019-0131-0. K. Liu, C. Pan, A. Kuhn, A.P. Nievergelt, G.E. Fantner, O. Milenkovic, A. Radenovic, Detecting topological variations of DNA at single-molecule level, Nat. Commun. 10 (2019). doi:10.1038/s41467-018-07924-1. S. Sahu, M. Zwolak, Colloquium: Ionic Phenomena in nanoscale pores through 2D materials, Rev. Mod. Phys. 91 (2019) 021004, 1-28. doi:10.1103/RevModPhys.91.021004. B. Hille, Pharmacological modifications of the sodium channels of frog nerve., J. Gen. Physiol. 51 (1968) 199–219. doi:10.1085/jgp.51.2.199. B. Hille, Ion Channels of Excitable Membranes, 3rd ed., Sinauer Associates Inc, Sunderland, MA, 2001. J.E. Hall, Access resistance of a small circular pore., J. Gen. Physiol. 66 (1975) 531–2. doi:10.1085/jgp.66.4.531. P. Läuger, Diffusion-limited ion flow through pores, BBA - Biomembr. 455 (1976) 493– 509. doi:10.1016/0005-2736(76)90320-5. A. Peskoff, D.M. Bers, Electrodiffusion of ions approaching the mouth of a conducting membrane channel, Biophys. J. 53 (1988) 863–875. doi:10.1016/S00063495(88)83167-9. M. Aguilella-Arzo, V.M. Aguilella, R.S. Eisenberg, Computing numerically the access resistance of a pore, Eur. Biophys. J. 34 (2005) 314–322. doi:10.1007/s00249-0040452-x. V. Levadny, V.M. Aguilella, and M. Belaya, Access resistance of a single conducting membrane channel, Biochim. Biophys. Acta - Biomembr. 1368 (1998) 338-342. I. Vodyanoy, S.M. Bezrukov, Sizing of an ion pore by access resistance measurements, Biophys. J. 62 (1992) 10–11. doi:10.1016/S0006-3495(92)81762-9. J.C. Maxwell, A treatise on electricity and magnetism, Vol.1, Clarendon Press, Oxford, UK, 1892 S.M. Bezrukov, I. Vodyanoy, Probing alamethicin channels with water-soluble polymers. Effect on conductance of channel states, Biophys. J. 64 (1993) 16-25. doi:10.1016/S0006-3495(93)81336-5 R.S. Eisenberg, Computing the field in proteins and channels, J. Membr. Biol. 150 (1996) 1–25. doi:10.1007/s002329900026. B. Corry, S. Kuyucak, S.-H. Chung, Tests of Continuum Theories as Models of Ion Channels. II. Poisson–Nernst–Planck Theory versus Brownian Dynamics, Biophys. J. 78 (2009) 2364–2381. doi:10.1016/s0006-3495(00)76781-6. W. Im, B. Roux, Ion permeation and selectivity of OmpF porin: a theoretical study based on molecular dynamics, Brownian dynamics, and continuum electrodiffusion theory., J. Mol. Biol. 322 (2002) 851–69. doi:https://doi.org/10.1016/S00222836(02)00778-7.. 18.
(19) 29. 30. 31. 32. 33. 34. 35. 36 37 38. 39. 40. 41. 42. 43. M. Aguilella-Arzo, J.J. García-Celma, J. Cervera, A. Alcaraz, V.M. Aguilella, Electrostatic properties and macroscopic electrodiffusion in OmpF porin and mutants, Bioelectrochemistry. 70 (2007) 320–327. doi:10.1016/j.bioelechem.2006.04.005. S.W. Cowan, T. Schirmer, G. Rummel, M. Steiert, R. Ghosh, R.A. Pauptit, J.N. Jansonius, J.P. Rosenbusch, Crystal structures explain functional properties of two E. coli porins, Nature. 358 (1992) 727–733. doi:10.1038/358727a0. A. Baslé, G. Rummel, P. Storici, J.P. Rosenbusch, T. Schirmer, Crystal Structure of Osmoporin OmpC from E. coli at 2.0 Å, J. Mol. Biol. 362 (2006) 933–942. doi:10.1016/j.jmb.2006.08.002. R. Ujwal, D. Cascio, J.-P. Colletier, S. Faham, J. Zhang, L. Toro, P. Ping, J. Abramson, The crystal structure of mouse VDAC1 at 2.3 Å resolution reveals mechanistic insights into metabolite gating, Proc. Natl. Acad. Sci. 105 (2008) 17742–17747. doi:10.1073/pnas.0809634105. J. Zhao, S. Benlekbir, J.L. Rubinstein, Electron cryomicroscopy observation of rotational states in a eukaryotic V-ATPase, Nature. 521 (2015) 241–245. doi:10.1038/nature14365. L. Song, M.R. Hobaugh, C. Shustak, S. Cheley, H. Bayley, J.E. Gouaux, Structure of staphylococcal α-hemolysin, a heptameric transmembrane pore, Science. 274 (1996) 1859–1866. doi:10.1126/science.274.5294.1859. M.A. Aksoyoglu, R. Podgornik, S.M. Bezrukov, P.A. Gurnev, M. Muthukumar, V.A. Parsegian, Size-dependent forced PEG partitioning into channels: VDAC, OmpC, and α-hemolysin, Proc. Natl. Acad. Sci. 113 (2016) 9003–9008. doi:10.1073/pnas.1602716113. J.E. Guyer, D. Wheeler, J.A. Warren, FiPy: Partial differential equations with python, Comput. Sci. Eng. 11 (2009) 6–15. doi:10.1109/MCSE.2009.52. The Python Language Reference — Python 2.7.16 documentation, (n.d.). https://docs.python.org/2/reference/index.html (accessed May 13, 2019). C. Geuzaine, J.F. Remacle, Gmsh: A 3-D finite element mesh generator with built-in pre- and post-processing facilities, Int. J. Numer. Methods Eng. 79 (2009) 1309–1331. doi:10.1002/nme.2579. A. Alcaraz, E.M. Nestorovich, M. Aguilella-Arzo, V.M. Aguilella, S.M. Bezrukov, Salting out the ionic selectivity of a wide channel: The asymmetry of OmpF, Biophys. J. 87 (2004) 943–957. doi:10.1529/biophysj.104/043414. E. García-Giménez, A. Alcaraz, M. Aguilella-Arzo, V.M. Aguilella, Selectivity of Protein Ion Channels and the Role of Buried Charges. Analytical Solutions, Numerical Calculations, and MD Simulations, J. Phys. Chem. B. 119 (2015) 8475–8479. doi:10.1021/acs.jpcb.5b03547. S.Y. Noskov, W. Im, B. Roux, Ion permeation through the α-hemolysin channel: Theoretical studies based on Brownian dynamics and Poisson-Nernst-Planck electrodiffusion theory, Biophys. J. 87 (2004) 2299–2309. doi:10.1529/biophysj.104.044008. N.A. Simakov, M.G. Kurnikova, Soft wall ion channel in continuum representation with application to modeling ion currents in α-hemolysin, J. Phys. Chem. B. 114 (2010) 15180–15190. doi:10.1021/jp1046062. R. Geus, P. Arbenz, PySparse and PyFemax: A Python framework for large scale sparse linear algebra, PyCon’03. (2003). https://www.researchgate.net/profile/Peter_Arbenz/publication/2865381_PySparse. 19.
(20) 44. 45. 46. 47. 48 49. 50. 51. 52 53. _and_PyFemax_A_Python_framework_for_large_scale_sparse_linear_algebra/links/0 2bfe50f70d1219062000000.pdf (accessed May 13, 2019). S.M. Bezrukov, I. Vodyanoy, Probing alamethicin channels with water-soluble polymers. Effect on conductance of channel states, Biophys. J. 64 (1993) 16–25. doi:10.1016/S0006-3495(93)81336-5. S.M. Bezrukov, I. Vodyanoy, R.A. Brutyan, J.J. Kasianowicz, Dynamics and free energy of polymers partitioning into a nanoscale pore, Macromolecules. 29 (1996) 8517– 8522. doi:10.1021/ma960841j. S.Y. Noskov, T.K. Rostovtseva, A.C. Chamberlin, O. Teijido, W. Jiang, S.M. Bezrukov, Current state of theoretical and experimental studies of the voltage-dependent anion channel (VDAC), Biochim. Biophys. Acta - Biomembr. 1858 (2016) 1778–1790. doi:10.1016/j.bbamem.2016.02.026. S. Couoh-Cardel, Y.C. Hsueh, S. Wilkens, L. Movileanu, Yeast V-ATPase Proteolipid Ring Acts as a Large-conductance Transmembrane Protein Pore, Sci. Rep. 6 (2016). doi:10.1038/srep24774. B.J. Berube, J.B. Wardenburg, Staphylococcus aureus α-toxin: Nearly a century of intrigue, Toxins (Basel). 5 (2013) 1140–1166. doi:10.3390/toxins5061140. A. Aksimentiev, K. Schulten, Imaging α-hemolysin with molecular dynamics: Ionic conductance, osmotic permeability, and the electrostatic potential map, Biophys. J. 88 (2005) 3745–3761. doi:10.1529/biophysj.104.058727. B.J. Nablo, K.M. Halverson, J.W.F. Robertson, T.L. Nguyen, R.G. Panchal, R. Gussio, S. Bavari, O. V. Krasilnikov, J.J. Kasianowicz, Sizing the Bacillus anthracis PA63 Channel with Nonelectrolyte Poly(Ethylene Glycols), Biophys. J. 95 (2008) 1157–1164. doi:10.1529/biophysj.107.121715. A. Gadaleta, C. Sempere, S. Gravelle, A. Siria, R. Fulcrand, C. Ybert, L. Bocquet, Subadditive ionic transport across arrays of solid-state nanopores, Phys. Fluids. 26 (2014) 12005. doi:10.1063/1.4863206. R.P. Gonçalves, N. Buzhysnskyy, S. Scheuring, Mini review on the structure and supramolecular assembly of VDAC, J. Bioenerg. Biomembr. 40 (2008) 133-138. A.M. Berezhkovskii, L. Dagdug, V.A. Lizunov, J. Zimmerberg, S.M. Bezrukov, Trapping by Clusters of Channels, Receptors and Transporters: Quantitative Description, Biophys. J. 106 (2014) 500-509. doi:10.1016/j.bpj.2013.12.015.. 20.
(21)
Figure
+3
Documento similar
We remark that we do not take advantage of fast Fourier transforms for linear terms, because the corresponding matrices are constant at each time step as we will see below..
Keywords: Metal mining conflicts, political ecology, politics of scale, environmental justice movement, social multi-criteria evaluation, consultations, Latin
Plotinus draws on Plato’s Symposium (206c4–5) – “procreate in what is beautiful” – 3 in order to affirm that mixed love (which is also a love of beauty) is fecund, although
This table contains the probabilities of finding a dimer, monomer or double contact (D.C.) in the MD simulations for the two structures (A and B) studied during the formation or
As a means to probe the possible fractal structure of the galaxy distribution we have studied the scaling of the num- ber density and angular correlation function of galaxies
Even though the 1920s offered new employment opportunities in industries previously closed to women, often the women who took these jobs found themselves exploited.. No matter
Ab initio protein-protein docking (PP docking) algorithms are a set of computational techniques employed to model the 3D quaternary structure of protein complexes given the
The expansionary monetary policy measures have had a negative impact on net interest margins both via the reduction in interest rates and –less powerfully- the flattening of the
