TítuloHighly stable complexes of divalent metal ions (Mg2+, Ca2+, Cu2+, Zn2+, Cd2+, and Pb2+) with a dota‐like ligand containing a picolinate pendant
17
0
0
Texto completo
(2) Introduction Selective complexation of metal ions is an important requirement for the use of metal complexes for a range of applications in medicine. Indeed, chronic intoxication with a range of metal ions can be treated with the administration of a suitable chelating agent.[1] Chelates for application in the treatment of metal ion intoxication must form stable complexes with the target metal ion while providing a clear selectivity for the metal ion to be removed with respect to those essential for vital processes (for instance Ca2+, Zn2+ or Cu2+).[2] Metal ion complexes also have important implications in the fields of magnetic resonance imaging (MRI) and positron emission tomography (PET). In MRI, image contrast is normally improved with the administration of a contrast agent, often a paramagnetic complex of Mn2+ or Gd3+.[3,4] It has been shown that the toxicity of such contrast agents depends not only on the thermodynamic stability of the chelate, but also on the selectivity of the particular ligand for the paramagnetic metal ion over endogenous ions such as Zn2+.[5] Additionally, a high kinetic inertness of the complex towards metal ion dissociation is also very important to avoid the undesirable release of the metal ion.[5] Significant progress has also been achieved in the last years in nuclear medicine to prepare new imaging and therapeutic agents containing radioactive copper ions such as 64Cu and 67Cu.[6] The use of these radioisotopes for PET imaging requires the development of specific ligands that are able to form highly stable complexes with the radioactive metal ions and good selectivity over Zn2+ to avoid their transchelation in biological media.[7] Macrocyclic ligands are endowed with a certain degree of rigidity that often results in superior selectivity for the complexation of specific metal ions when compared with non‐macrocyclic analogues. Among the different macrocyclic platforms designed for metal ion complexation, tetraazamacrocycles such as cyclen (cyclen = 1,4,7,10‐tetraazacyclododecane) play an important role. Furthermore, cyclen can be easily functionalized with different types and number of pendant arms, ranging from one to four, which allows a wide variety of systems to be designed for specific applications. The cyclen‐based ligand containing four acetate pendant arms H4dota [1,4,7,10‐tetraazacyclododecane‐1,4,7,10‐tetraacetic acid, Scheme 1] remains one of the more efficient chelators for large metal ions such as the lanthanide ions, Y3+ and Pb2+.[8,9] On the other hand, cyclen‐based ligands containing one or two pendant arms have been shown to provide very stable complexes with different transition‐metal ions including Cu2+.[10,11] In recent papers, we have reported a series of macrocyclic[12–14] and non‐macrocyclic[15,16] ligands containing picolinate units that show interesting coordination properties towards divalent metal ions such as Pb 2+. Some of these ligands showed an significant degree of selectivity for Pb2+ over endogenous metal ions such as Zn2+ and Ca2+,[13,15] which paves the way for their application in chelation treatment of metal ion intoxication. As a continuation of these works, herein we report a detailed characterization of the complexes with the macrocyclic ligand do3a‐pic4– and the divalent metal ions Pb2+, Cd2+, Zn2+, Cu2+, Ca2+, and Mg2+. The thermodynamic stability constants of the different complexes have been determined by using pH‐ potentiometry, whereas the structure of the complexes in solution has been investigated by using NMR spectroscopy and density functional theory (DFT) calculations.. Results and Discussion Stability Constants of the [M(do3a‐pic)]2– Complexes The stability constants of the do3a‐pic4– complexes formed with different divalent metal ions (Mg2+, Ca2+, Cu2+, Zn2+, Cd2+, and Pb2+) were determined by pH‐potentiometric titrations. The relatively fast complexation kinetics of do3a‐pic4– complexes with the divalent metal ions allowed the determination of stability constants by using direct potentiometric titrations, in contrast to those formed with the lanthanide(III) ions, which required the use of the “out‐of‐cell” technique.[17] The protonation constants of.
(3) do3a‐pic4– in 0.1 M KCl have been reported previously (log K1 = 10.91, log K2 = 9.41, log K3 = 4.89, and log K4 = 3.79).[17] All titrations were performed with solutions containing equimolar amounts of ligand and the corresponding divalent metal ion. No evidence for the formation of complex species with different stoichiometry was obtained from analysis of the 1:1 titration curves. Furthermore, high‐resolution mass spectra (ESI–) recorded from aqueous solutions containing equimolar amounts of ligand and divalent metal ion (pH 5.4–6.9) show intense peaks due to the [M(L)Na]– and [M(LH)]– entities, whereas no peaks attributable to complex entities with different metal/ligand ratios were detected. This confirms the formation of 1:1 complexes in solution (see Figures S1–S5 in the Supporting Information).. Scheme 1. Ligands discussed in the present work.. The stability constants of the metal chelates and the protonation constants of the complexes are expressed in Equations (1) and (2), respectively.. [ML]. 𝐾ML = [M][L]. (1). [MHi L]. 𝐾MHiL = [MH. 𝑖−1 L][H. +]. (2). The constants and standard deviations are given in Table 1, which also lists the stability constants of metal complexes with related ligands (Scheme 1)..
(4) Table 1. Stability constants of the [M(do3a‐pic)]2– complexes (I = 0.1 M KCl, 0.1 M KNO3 or 0.1 M Me4NNO3 25 °C) and related systems. M2+ Mg. Ca. Cu[h]. Zn. Pb. Cd. 0.1 M:. do3a‐pic4– do3a‐sa4– KCl[a] KCl[b]. do3a3– KCl[b]. dota4– Me4NNO3[c]. bp12c42– KCl[d]. log KMgL log KMgHL log KMgH2L log KCaL log KCaHL log KCaH2L log KCuL log KCuHL log KCuH2L log KCuH3L log KZnL log KZnHL log KZnH2L log KZnH3L log KPbL log KPbHL log KPbH2L log KPbH3L log KCdL log KCdHL log KCdH2L log KCdH3L. 10.44(7) 6.89(11) 6.37(8) 14.82(4) 4.59(5) 4.32(10) 23.20(4) 4.17(2) 3.31(3) 1.97(7) 20.25(3) 4.42(2) 3.06(1) 1.98(10) 21.04(1) 4.29(1) 3.11(1) 2.13(1) 21.33(5) 4.24(3) 2.94(2) 2.59(2). 11.87(4) 10.93(3). 11.64(3). 11.91 3.92. 11.15. 13.68(3) 10.64(2) 5.20(3) 26.27(6) 10.14(1) 3.97(2) 2.00(2) 21.79(2) 10.29(2) 3.74(2) 2.99(1). 12.57(1) 4.60(9). 16.37 3.60. 25.75(7) 3.65(2) 1.69(6). 17.23 3.54 4.19 22.25 3.78 3.77. 21.57(1) 3.47(1) 2.07(1). 21.09 4.18 3.52 23.69 3.86. 21.31 4.39 3.03. KNO3[e]. Me4NNO3[g] 5.62. 10.0 3.76. 22.72 4.45 3.92 15.78 2.31. 24.3 3.3. ba12c42– KCl[f]. 12.09. 8.50. 19.56 6.52. 15.95. 18.12. 12.28. 15.44 2.52. 12.43. 16.84. 14.09. [a] This work. [b] Ref. 24a. [c] Ref. 18,19. [d] Ref. 20. [e] Ref. 12. [f] Ref. 21. [g] Ref. 22. [h] Determined by simultaneous fitting of UV/Vis and pH‐potentiometric data (ΔA = 0.0103). The following fitting parameter values were observed for 40–165 data pairs fitted: 3.47 × 10⁻³ cm3 (Mg2+), 2.73 × 10⁻³ cm3 (Ca2+), 5.08 × 10⁻³ cm3 {for the Cu2+ system, but only the deprotonation of [Cu(H3do3a‐pic)]+ can be assumed}, 0.99 × 10⁻³ cm3 (Pb2+) and 3.68 × 10– 3 cm3 (Cd2+).. The titration data obtained for Ca2+ and Mg2+ ions were fitted to a model in which only mononuclear complexes were assumed. However, the fitting considerably improved (by lowering the fitting parameter close to 0.003 cm3) when protonated (mono and di protonated) complexes were included in the model. The fitting of the titration data obtained for Cu2+, Zn2+, Cd2+, and Pb2+ ions indicated large differences between the fitted and measured titrations curves in the acidic pH range (pH 1.80–2.60), which indicates that a third protonated form of the complex (tri protonated [M(H3L)]) must be taken into account. The Mg2+ complex form protonated complexes that are characterized by high protonation constants [log KMgHL = 6.89(11) and log KMgH2L = 6.37(8)] compared with those obtained for the other systems investigated (log KMHL < 4.6). These high protonation constants can only be explained by protonation of the N atoms of the macrocycle, which reflects a weak coordination of these donor atoms to Mg2+. For the Cu2+–do3a‐pic4––H+ system, the titration data indicated the absence of free metal ion at the beginning of the titration (at pH = 1.754 in our case), hence only the lower limit of the stability constant can be estimated from pH‐potentiometric data, which turned out to be log K[Cu(do3a–pic)] ≥ 23.0 (this value would result in 5 % of the total Cu2+ present in uncomplexed form at this actual pH). A slightly higher stability constant of the [Cu(do3a‐pic)]2– complex log K[Cu(do3a–pic)] = 23.20(4) was obtained by simultaneous fitting of the UV/Vis.
(5) (batch samples in which the acid concentrations were varied so that UV/Vis spectra were obtained in the pH range of 1.80–10.94) and pH‐potentiometric data measured at two different total concentrations (1.93 and 2.97 mM). By studying the equilibrium in the Cu2+:do3a3– system, Kaden et al. pointed out that the stability constant of the [Cu(do3a)]– complex was highly dependent on the equilibrium model used for the fitting.[23] By considering only [Cu(L)]–, [Cu(HL)], and [Cu(H2L)]+ species, a stability constant of log K([Cu(do3a)]–) = 23.1 was calculated, whereas when the triprotonated [Cu(H3L)]2+ complex was included, a stability constant of log K([Cu(do3a)]–) = 26.49 was obtained. Besides these, the triprotonated Cu2+complex was also detected recently for a do3a derivative ligand incorporating a sulfonamide pendant arm.[24] Similarly, for the Cu2+:do3a‐pic4– system, the fitting of pH‐potentiometric data by considering [Cu(L)]2–, [Cu(HL)]–, and [Cu(H2L)] species resulted in a stability constant of log K[Cu(do3a‐pic)]2– = 22.32(9), with an acceptable fitting parameter (0.0088 cm3). However, the formation of the tripotonated complex in acidic samples with pH < 1.80 (the usual starting point of the pH‐potentiometric titrations) containing mostly [Cu(H2do3a‐pic)] was evident when the given sample was acidified further (Figure 1, see also Figures S6 and S7 in the Supporting Information). Lowering the pH of a sample containing equimolar amounts of Cu2+ and do3a‐pic4– ligand at pH 2.0 results in an increase in the color intensity, which indicates the formation of a triprotonated species under these conditions. The decomplexation ([Cu(H2do3a‐pic)] + H+ [lrarr2] Cu2+ + H3do3a‐pic–) would lead to a decrease in absorption due to the much lower molar absorption coefficient of the Cu2+ aqua ion in comparison to the molar absorption coefficient of the [Cu(H2do3a‐pic)] species. The formation of the [Cu(H2do3a‐pic)] complex from [Cu(H3do3a‐pic)]+ resulted in a blue hypochromic shift of the absorption maxima (of ca. 15–16 nm), whereas further deprotonations resulted in pure hyperchromic shift of the band maxima. These results suggest that in [Cu(H 2do3a‐pic)] and [Cu(Hdo3a‐pic)]– complexes protonation most likely occurs at the sidearms that are not coordinated to the Cu2+ ion. However, it is difficult to propose the third protonation site in the [Cu(H3do3a‐pic)]+ complex. Indeed, protonation of Cu2+ complexes with concomitant decoordination of a pendant arm often results in significant shifts of the absorption maximum associated with d‐d transitions.[25] The redshift in the absorption maximum observed for the [Cu(H3do3a‐pic)]+ complex is close to that found for the axial displacement of a carboxylate donor group (19 nm) in [Cu(nta)2]4– (nta = nitrilotriacetic acid), which suggests that the protonation is very likely affecting the donor atom coordinated in the axial position of the complex.[25]. Figure 1. Absorption spectra of the Cu2+–do3a‐pic system as a function of pH recorded at pH 0.25–10.95 ([HCl]+[KCl] = 0.1 M, [Cu2+] = [do3a‐pic] = 2.0 mM, l = 1 cm, 25 °C)..
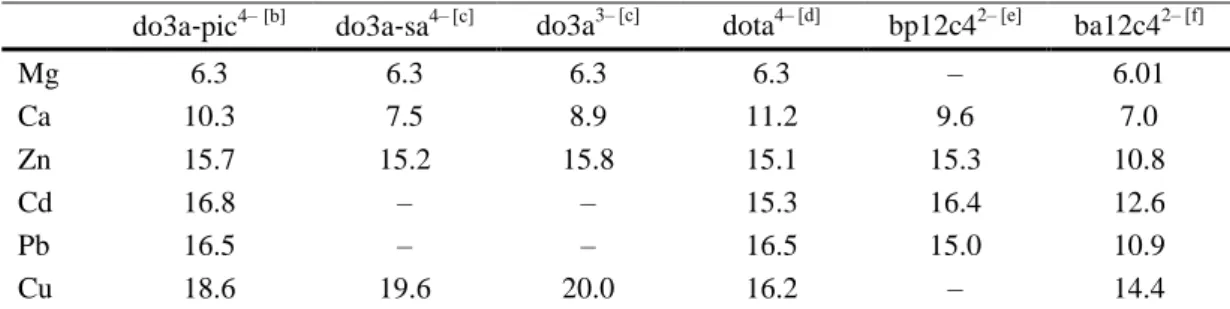
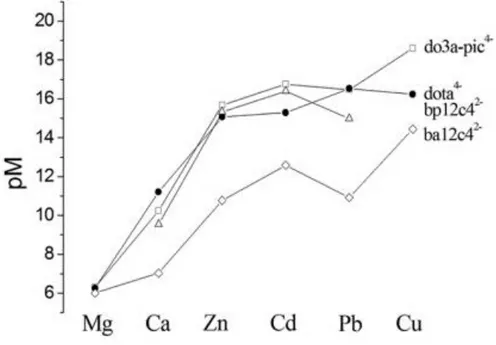
(6) The stability constants shown in Table 1 indicate that the stability of the complexes formed with do3a‐pic4– are somewhat lower than the stability of analogous [M(dota)]2– complexes. This can be explained in terms of lower overall basicity of the do3a‐pic4– ligand (Σlog KiH = 29.0) in comparison to dota4– (Σlog KiH = 30.4). However the stability constant of the [Cu(do3a‐pic)]2– complex is approximately 1 log K unit larger than that reported for the [Cu(dota)]2– complex. The explanation for this is not yet clear, but it is very likely that the published stability constants of the [Cu(dota)]2– complex are underestimated. There are some published data available supporting this explanation: the stability of the [Pb(dota)] 2–complex determined by Pippin and co‐ workers by UV/Vis measurements turned out to be 1.5–2.0 log K units higher than that of [Cu(dota)]2–.[8] On the other hand, the less basic do3a3–ligand also seems to form more stable complexes with the Cu2+ ion than dota4– (log KCuL = 25.75 vs. log KCuL = 22.25 for do3a3– and dota4–, respectively).[24,26] The log KML determined for the Cu2+ complex is approximately 2 log K units higher than those of the Pb2+ and Cd2+ complexes, and 3 log K units higher than that of the Zn2+analogue. The stability constants determined for the Ca2+ and Mg2+ complexes are considerably lower. However, the comparison of the complexometric ability of ligands with different basicity is not correct if the competition of the ligands for the proton is not taken into account. Thus, we have calculated the residual free M2+ concentration in solution at physiological pH, defined as pM =–log [M2+]free with [M2+] = 1 μM and [do3a‐pic4–] = 10 μM. The results are shown in Figure 2 and Table 2. The pM values calculated for the complexes of ba12c42– are clearly lower than those obtained for do3a‐pic4–, dota4–, and bp12c42–, which reflects a lower stability of the complexes of the former ligand. The do3a‐pic4–, dota4–, and bp12c42– ligands provide similar pM values for all complexes investigated of a particular metal ion, with the notable exception of the Cu 2+ complex of dota4–, which shows a pM value lower than expected taking into account that determined for do3a‐pic4–. Furthermore, the trends observed for the pM values obtained for do3a‐pic4– and ba12c42– are very similar, with the highest pM value being observed for Cu2+. These results appear to confirm the hypothesis that the reported stability of the Cu2+ complex of dota4– has been underestimated. We also notice that the stability of the Pb2+ complex of dota4– is slightly higher than that of the Cd2+ analogue, whereas this situation is reversed for do3a‐pic4–, bp12c42–, and ba12c42–. The results presented in Figure 2 indicate that ligands based on 12‐membered macrocycles such as 1,7‐diaza‐12‐crown‐6 and 1,4,7,10‐tetrazacyclododecane do not provide a significant discrimination between Zn2+, Cd2+, and Pb2+ ions, but show clear selectivity for any of those over Ca 2+ and Mg2+.. Table 2. Comparison of the pM values calculated for do3a‐pic4– complexes and related systems.[a]. Mg Ca Zn Cd Pb Cu. do3a‐pic4– [b]. do3a‐sa4– [c]. do3a3– [c]. dota4– [d]. bp12c42– [e]. ba12c42– [f]. 6.3 10.3 15.7 16.8 16.5 18.6. 6.3 7.5 15.2 – – 19.6. 6.3 8.9 15.8 – – 20.0. 6.3 11.2 15.1 15.3 16.5 16.2. – 9.6 15.3 16.4 15.0 –. 6.01 7.0 10.8 12.6 10.9 14.4. [a] pM =–log [M]free at pH 7.4 for [M2+] = 1 μM, [L] = 10 μM. [b] this work, I = 0.1 M KCl. [c] Ref. 24a. [d] Ref. 18,19 0.1 M Me4NNO3. [e] Ref. 12 0.1 M KNO3. [f] Ref. 22 0.1 M Me4NNO3..
(7) Figure 2. pM values calculated for the complexes reported in this work and related systems.. NMR Spectra The 1H and 13C NMR spectra of diamagnetic [M(do3a‐pic)]2– complexes (M = Mg, Ca, Zn, Cd, Pb) were recorded in D2O solution at 298 K (pD 7.4). The 1H NMR spectra of Pb2+, Cd2+, Ca2+, and Cd2+ complexes (Figure 3) show broad signals for the proton nuclei of the cyclen unit at approximately 2.0–4.0 ppm. This indicates the presence in solution of intramolecular dynamic exchange processes. In the case of the Ca2+ and Pb2+ complexes, our DFT calculations (see below) provide nine‐coordinate minimum energy conformations that correspond to the Λ(λλλλ)/Δ(δδδδ) enantiomeric pair, with other minimum energy geometries presenting considerably higher energies. Thus, the intramolecular dynamic exchange processes observed for these complexes are probably related to the Λ(λλλλ)↔Δ(δδδδ) enantiomerization process, which requires both rotation of the pendant arms and inversion of the cyclen unit.[27] For the Cd2+ complex, similar interconversion processes, most likely involving six‐ or seven‐coordinate species, are also responsible for the line broadening observed in the 1H NMR spectra. The situation is probably different for the Mg2+ complex, which presents a significant population of a protonated complex species at the pH values used for NMR measurements (Figure S9). The 1H NMR spectrum of the Zn2+ complex is well resolved, and could be assigned with the aid of standard homonuclear 2D COSY and heteronuclear 2D HSQC and HMBC experiments (Table 3). Both the 1H and 13C NMR spectra are in agreement with an effective Cs symmetry of the complex in solution, which points to a fast interconversion between the Δ and Λ optical isomers arising from the different orientations of the pendant arms. As a result, the signals of the methylenic protons H7, H10, and H14 are observed as singlets in the 1H spectrum, instead of the AB spin patters normally observed when the arm rotation process is slow on the NMR timescale.[12] In contrast, the proton nuclei of the cyclen unit are diastereotopic, indicating that the ring inversion process leading to a (λλλλ)↔(δδδδ) interconversion is slow on the NMR timescale. These results point to the presence in solution of two diastereoisomers, Λ(λλλλ) and Δ(λλλλ), in fast exchange within the NMR timescale. This fast interconversion is related to a low energy barrier for the arm rotation process, which is probably related to the non‐coordination of one of the pendant arms of the ligand.[28].
(8) Figure 3. 1H spectra [500 MHz] of [M(do3a‐pic)]2– complexes recorded in D2O solution at 298 K and pD 7.4.. Table 3. 1H and 13C NMR spectroscopic data [ppm] for [Zn(do3a‐pic)]2– at 298 K and pD 7.4.[a] 1. 13. H. H3 H4 H5 H7 H8 H9 H10 H12 H13 H14. 3.77 7.84 7.56 3.93 2.93 2.64 2.95 2.79 3.13 3.24 3.11 3.07 2.80 3.21. C. C1 C2 C3 C4 C5 C6 C7 C8 C9 C10 C11 C12 C13 C14 C15. 173.0 [b]. 122.9 138.4 127.3 153.6 60.4 50.6 54.0 58.1 178.0 58.1 51.8 59.7 176.6. [a] See Scheme 1 for labeling. The assignments were supported by COSY, HSQC, and HMBC experiments; 3JH3,H4 = 7.6 Hz; 3JH5,H4 = 7.6 Hz; 4JH5,H3 = 1.1 Hz. [b] Not observed..
(9) DFT Calculations With the aim of obtaining information on the structure in solution of the [M(do3a‐pic)]2–complexes (M = Mg, Ca, Zn, Cu, Cd, or Pb) we have performed DFT calculations based on the TPSSh model. A syn conformation of the ligand in these complexes implies the occurrence of two helicities: one associated with the layout of the picolinate pendant arms (absolute configuration Δ or Λ), and the second to the four five‐ membered chelate rings formed by the binding of the cyclen moiety (each of them showing absolute configuration δ or λ).[29] Different studies have shown that the four five‐membered chelate rings formed upon coordination of the cyclen moiety present the same helicity, which leads to two possible macrocyclic conformations: (λλλλ) or (δδδδ). Thus, we have explored the conformational space for the different [M(do3a‐ pic)]2– complexes taking into account the Λ(δδδδ) and Δ(δδδδ) isomers [or their corresponding enantiomeric forms Δ(λλλλ) and Λ(λλλλ)]. The X‐ray structures of Cu2+ complexes with protonated forms of do3a3– derivatives revealed mixed conformations of the macrocyclic moiety [(δλδλ) and (δλλλ)], with the ligands providing a trans‐N4O2 coordination.[24] Thus, we have also performed DFT calculations for these mixed configurations to explore whether these conformations stabilize the complexation of the small cations. Considering the different ionic radius and coordination properties of the divalent metal ions investigated in this work, it is very likely that the complexes will present different coordination numbers ranging from six to nine. Indeed, both six‐[30] and seven‐coordinate[31] complexes of Zn2+ and six‐coordinate[24] complexes of Cu+2 with cyclen‐based ligands have been reported. Seven‐ and eight‐coordinate Pb2+ complexes with ligands containing cyclen units have been also published,[32] but Pb2+ complexes with higher coordination numbers are not rare.[33] Thus, in our DFT calculations we have considered different coordination numbers ranging from nine, where all available donor atoms of the ligand coordinate to the metal ion, to six, where only the nitrogen atoms of the macrocycle and two acetate pendant arms are involved in coordination to the metal ion (Scheme 2). The relative free energies of the different isomers of [M(do3a‐pic)]2– complexes obtained from DFT calculations are shown in Figure 4. The most stable form in the case of the Ca2+and Pb2+ complexes corresponds to the N5O4‐Δ(δδδδ) isomers, in which the metal ions are nine‐coordinate. The coordination polyhedron around the metal ions can be described as a capped twisted‐square antiprism, which can be considered to be comprised of two virtually parallel pseudo‐planes: the four amine nitrogen atoms define the lower plane (PN4), while the three oxygen atoms of the acetate groups coordinated to the metal ion and the nitrogen atom of the pyridine unit define the upper plane (PNO3). The oxygen atom of the picolinate moiety involved in coordination to the metal ion caps the upper plane (Figure 5). The mean twist angles between the upper and lower planes (20.7 and 24.1° for the Pb2+ and Ca2+complexes, respectively) are close to those expected for a regular twisted square antitiprism (22.5°). An inverted‐antiprismatic coordination environment has also been found for [Ca(dota)]2– in the solid state.[34] The bond lengths of the metal coordination environment in [Pb(do3a‐pic)]2– (Table 4) are characteristic of the so‐called holodirected compounds, in which the 6s lone‐pair of Pb2+ is not stereochemically active.[35,36] This is confirmed by an analysis of the natural bond orbitals (NBOs), which shows that the Pb2+ lone pair orbital possesses a nearly exclusive 6s character with only a minor 6p contribution: s[99.82 %]p[0.17 %]. Calculations performed on the Cd2+, Zn2+, Cu2+, and Mg2+ complexes (Figure 5) lead to minimum energy conformations for which the picolinate pendant arm is not coordinated to the metal ion. In the case of the Mg2+ and Zn2+ complexes, the minimum energy conformations correspond to the Δ(δδδδ) forms, whereas for the Cd2+ complex the most stable geometry corresponds to the Λ(δδδδ) [or Δ(λλλλ)] form. For the Cu2+ complex, two minimum energy conformations [Δ(δδδδ) and Λ(δδδδ)] with virtually identical energies have been obtained. Both Mg2+ and Cd2+ are seven‐coordinate, being directly bound to three oxygen atoms of the acetate groups and the four nitrogen atoms of the cyclen unit. For [Zn(do3a‐pic)]2– and [Cu(do3a‐pic)]2–, the metal ions are however six‐coordinate, because the calculated M–N1 distances.
(10) (3.14 Å for Zn and 3.17 Å for Cu) are too long to be considered as bond lengths. The ligand conformation observed for the Zn2+ complex seems to favor a distorted trigonal prismatic coordination in which the upper pseudo‐plane of the prism is defined by the three oxygen atoms of the acetate pendant arms [O(2), O(3) and O(4)] and the lower pseudo‐plane is defined by the three coordinated nitrogen atoms of the cyclen moiety [N(2), N(3) and N(4)]. The mean twist angle, ω, between these parallel triangles amounts to (26.4°), which indicates a significant distortion of the coordination polyhedron from the trigonal prism (ideal value 0°) to an octahedron (60°). A different situation is observed in the case of the Cu 2+ complex, in which a distorted octahedral coordination is observed as a result of the rotation of the aforementioned pseudo‐planes about the C3 perpendicular axis. In this case, the mean twist angle, ω, between the parallel triangles amounts to (44.4°), which is also indicative of a significant distortion of the polyhedron. The equatorial plane of the octahedron is defined by two of the nitrogen atoms of the cyclen unit [N(2) and N(4)] and two oxygen atoms of the coordinated acetate pendant arms [O(3) and O(4)] [deviation from planarity (0.245 Å)]. The apical positions are occupied by the oxygen atom of the remaining acetate pendant arm [O(2)] and one nitrogen atom of the cyclen unit [N(3)]. Both bond lengths [Cu–O(2): 2.387 Å and Cu–N(3): 2.576 Å] are very long, as expected for a tetragonal elongation due to a strong Jahn–Teller distortion (ca. 0.3–0.5 Å longer than the distances to the donor atoms of the equatorial plane).. Scheme 2. Structures of the [M(do3a‐pic)]2– complexes considered for DFT calculations. The different forms are identified by the donor set involved in metal ion coordination, with cis and trans denoting the relative positions of coordinated acetate groups. Noncoordinated pendant arms are shown in gray. For each form, two diastereoisomers [Λ(δδδδ) and Δ(δδδδ)] have been considered. For the trans‐N4O2form, Λ(δλδλ) and Δ(δλδλ) conformations have been also considered..
(11) Figure 4. Relative free energies of the different isomers of [M(do3a‐pic)]2– complexes obtained from DFT calculations performed in aqueous solution. Two of the forms investigated, trans‐N5O3 and cis‐N4O2, present very high energies and are not represented.. Figure 5. Minimum energy conformations obtained for [M(do3a‐pic)]2– complexes from DFT calculations performed in aqueous solution..
(12) Table 4. Bond lengths of the metal coordination environments [Å] obtained for the [M(do3a‐pic)]2– complexes from DFT calculations in aqueous solution; see Figure 5 for labeling. Pb M–N1 M–N2 M–N3 M–N4 M–N5 M–O1 M–O2 M–O3 M–O4. 2.991 2.837 2.843 2.950 2.825 2.697 2.578 2.514 2.730. Ca 2.947 2.808 2.806 2.908 2.658 2.526 2.464 2.427 2.504. Cd. Zn. Mg. Cu. 2.569 2.461 2.555 2.505. [a]. [a]. 2.282 2.195 2.451. 2.445 2.338 2.593 2.511. [a]. [a]. [a]. [a]. [a]. [a]. [a]. [a]. 2.321 2.290 2.264. 2.041 2.167 2.008. 2.114 2.079 2.050. 1.943 2.387 1.942. 2.052 2.063 2.576. [a] The distance is too long to be considered as a bond length.. Conclusions The do3a‐pic4– ligand forms stable complexes with several divalent metal ions in aqueous solution. Among the metal ions investigated in this work, the complex formed with Cu2+turned out to be particularly stable, with the stability constant of the [Cu(do3a‐pic)]2–complex being one order of magnitude higher than that reported for the [Cu(dota)]2–. The complexes of do3a‐pic4– with Cu2+, Zn2+, Cd2+, and Pb2+ present very similar stabilities, which are clearly higher than those of the Ca 2+ and Mg2+ analogues. A detailed conformational investigation using DFT calculations provided nine‐coordinate geometries for the Pb2+ and Ca2+ complexes, the coordination number being reduced to seven for the Mg2+ and Cd2+complexes and to six for Zn2+ and Cu2+ analogues. The Zn2+, Mg2+, and Cu2+ complexes of do3a‐pic4– are somewhat less stable than the [M(do3a)]– derivatives, which is related to: (i) the lower overall basicity of do3a‐pic4– (Σlog KiH = 29.0) in comparison to do3a3– (Σlog KiH = 31.3), and (ii) the lack of coordination of the picolinate unit to the metal ion, as suggested by DFT calculations. However, the [Ca(do3a‐pic)]2– complex is two orders of magnitude more stable than the do3a3– analogue, which can only be explained by the contribution of the picolinate donor atoms to the overall stability of the complex. Unfortunately, no stability constant has been reported for the Pb2+ complex derived from do3a3–; according to our DFT calculations, it is expected that in the [Pb(do3a‐pic)]2– complex the coordination of the picolinate donor atoms should increase the stability, as observed in the calcium analogue.. Experimental and Computational Section Solvents and Starting Materials All chemicals were purchased from commercial sources and used without further purification, unless otherwise stated. The H4do3a‐pic ligand was prepared as previously reported.[17] Physical Methods 1. H and 13C NMR spectra were recorded at 25 °C with a Bruker Avance 500 MHz spectrometer. For measurements in D2O, tert‐butyl alcohol was used as an internal standard with the methyl signal calibrated at δ = 1.2 (1H) and 31.2 ppm (13C). Samples of the Mg, Ca,Zn, Cd, and Pb complexes of do3a‐pic4– for NMR.
(13) measurements were prepared by dissolving equimolar amounts of the ligand and the corresponding hydrated perchlorate M(ClO4)2 (M = Mg, Ca, Zn, Cd or Pb) in D2O, followed by an adjustment of the pD with ND4OD and DCl (Aldrich) solutions in D2O. High‐resolution ESI‐TOF mass spectra were recorded with an LC‐Q‐q‐TOF Applied Biosystems QSTAR Elite spectrometer in the negative mode. Potentiometric Measurements Stock solutions of MgCl2, CaCl2, ZnCl2, CuCl2, Cd(NO3)2, Pb(NO3)2, and Pb(ClO4)2 (used for the UV/Vis experiments) were prepared from analytical‐grade salts in double distilled water. The concentrations of the stock solutions were determined by complexometric titrations using a standardized Na 2H2EDTA solution in the presence of eriochrom black T (MgCl2), murexide (CaCl2 and CuCl2) and xylenol orange [ZnCl2, Cd(NO3)2, Pb(NO3)2 and Pb(ClO4)2] as indicators. The stock solution of the ligand was prepared by dissolving the solid ligand in double distilled water and the ligand concentration was determined by pH‐ potentiometry on the basis of the titration curves obtained in the absence and presence of high (ca. 50 fold) excess of Ca2+. The difference in the inflection points of the two titration curves corresponds to 2 equiv. of the ligand (the protons of the two macrocyclic ring nitrogen atoms). The pH of the sample solutions were set to approximately 1.70–1.80 before each titration with a known volume of standardized strong acid (either HCl or HNO3). The pH‐potentiometric titrations were carried out with a Metrohm 785 DMP Titrino titration workstation with the use of a combined pH glass electrode (Metrohm 6.0233.100). For the calibration of the pH‐meter, KH‐phthalate (pH 4.005) and borax (pH 9.177) buffers were used, and the H+ concentrations were calculated from the measured pH values by applying the method of Irving et al. [37] The titrations were performed in a N2 atmosphere using total volumes of 6.00 mL and KOH kept also under N2atmosphere. The equilibrium was sufficiently fast for the titrations to be acquired in a direct titration mode by allowing 1 min for the samples to be equilibrated after each addition. The software PSEQUAD[38] was used to process the titration data; that is, to calculate the protonation and stability constants expressed by Equation (1) and Equation (2). The reliability of the constants are characterized by the calculated standard deviation values shown in parentheses and the fitting of parameter values [ΔV, which is the difference between the experimental and calculated titration curves expressed in mL of the titrant (for pH‐potentiomety) or ΔA, which is the difference between the measured and calculated absorbance (for the UV/Vis method)]. UV/Vis Method The spectrophotometric measurements were performed with a Cary 1E spectrophotometer at 25.0 ± 0.1 °C, using quartz Hellma semi‐micro cells of 1.0 or 2.0 cm path length. The molar absorption coefficients of the CuCl2, and [Cu(do3a‐pic)]2– complex were determined at 13 wavelengths (630–750 nm range) by recording the spectra of 2.50 × 10⁻³, 5.00 × 10⁻³, 7.50 × 10⁻³, and 1.00 × 10⁻² M (CuCl2) or 1.93 × 10⁻³, 2.50 × 10⁻³, and 2.97 × 10⁻³ M {[Cu(do3a‐pic)]2–} solutions, respectively. The molar absorption coefficients of the protonated species ([Cu(Hdo3a‐pic)]–), [Cu(H2do3a‐pic)], and [Cu(H3do3a‐pic)]+ were derived by simultaneous fitting the pH‐potentiometric data (1.66 × 10⁻³ M and 2.97 × 10⁻³ M complex solutions in the pH range of 1.70–6.0) and the UV/Vis spectra (in the pH range of 1.40–11.42 by using 1.93 × 10⁻³ M and 2.50 × 10⁻³ M complex concentrations). The stability constant of the [Cu(H3do3a‐pic)]+ complex was determined by using batch samples prepared in the acid concentration range of 0.5621–0.01358 M (the sample with 0.5621 M H+ was not taken into account because of some precipitate formation). The equilibrium involving the Pb 2+ ion was also studied by using UV/Vis spectrophotometry to judge the reliability of the stability constants obtained by pH‐potentiometric titrations. The effect of the pH on the UV‐spectra of the complex was followed by using a 0.242 mM solution of the [Pb(do3a‐pic)]2– complex in the pH‐range of 1.25–5.90 and was compared to the equilibrium distribution curve calculated by using the stability constants obtained with the use of pH‐ potentiometric titration data (Figure S8 in the Supporting Information)..
(14) Computational Methods All calculations presented in this work were performed by employing the Gaussian 09 package (Revision B.01).[39] Full geometry optimizations of the [M(do3a‐pic)]2– systems (M = Mg, Ca, Cu, Zn, Cd, or Pb) were performed in aqueous solution employing DFT within the hybrid meta generalized gradient approximation (hybrid meta‐GGA), with the TPSSh exchange‐correlation functional.[40] In the case of the Mg, Ca, and Zn complexes, we used the standard all electron 6‐31G(d) basis set, whereas for the Cd and Pb systems, relativistic effects were considered through the use of relativistic effective core potentials (RECP). In particular, we used the energy‐consistent ECP28MDB and ECP60MDF RECPs of the Stuttgart family[41] for Cd and Pb, which replace the 1s‐3d and 1s‐4f cores, respectively, and their associated (12s12p9d3f2g)/[6s6p4d3f2g] basis sets.[42,43] The standard 6‐31G(d) basis set was used for C, H, N and O atoms. Symmetry constraints were not imposed during the optimizations. Calculations on the Cu complexes were performed by using an unrestricted model with an assigned spin state S(S+1) = 0.75. The default values for the integration grid (“fine”) and the SCF energy convergence criteria (10–8) were used. The stationary points found on the potential energy surfaces as a result of the geometry optimizations have been tested to represent energy minima rather than saddle points by frequency analysis. The relative free energies of the different conformations calculated for each system include non‐potential‐energy contributions (that is, zero point energy and thermal terms) obtained by frequency analysis. Throughout this work, solvent effects were included by using the polarizable continuum model (PCM) with the integral equation formalism (IEFPCM) variant as implemented in Gaussian 09.[44] Supporting Information Figures S1–S5 showing HRMS of [M(do3a‐pic)]2– complexes, Figures S6–S7 and Figure S8 showing absorption spectra of the CuII and PbII complexes, respectively, as a function of pH, and Cartesian Coordinates [Å] of [M(do3a‐pic)]2– complexes (M = Pb, Cd, Cu, Zn, Ca, or Mg) and [M(dota)]2– complexes (M = Pb and Ca) obtained from DFT calculations performed in aqueous solution.. Acknowledgements The authors thank Xunta de Galicia (CN 2012/011), (EM 2012/088) and the Universidade da Coruña for financial support. The authors are indebted to Centro de Supercomputación de Galicia (CESGA) for providing the computer facilities. E. R., G. T. and I. T. thank the Hungarian Scientific Research Fund (OTKA K‐84291 and K‐109029) and the European Social Fund and the European Regional Development Fund who co‐financed the ENVIKUT project implemented through the New Hungary Development Plan (TÁMOP‐4.2.2.A‐11/1/KONV‐2012‐0043). This work was also supported by the János Bolyai Research Scholarship of the Hungarian Academy of Sciences. This work has been carried out in the frame of the COST TD1004 “Theragnostics Imaging and Therapy: An Action to Develop Novel Nanosized Systems for Imaging‐Guided Drug Delivery” Action.. References [1] O. Andersen, Chem. Rev. 1999, 99, 2683–2710. [2] a) O. Andersen, Mini‐Rev. Med. Chem. 2004, 4, 11–21. b) H. V. Aposhian, R. M. Maiorino, D. Gonzalez‐ Ramirez, M. Zunuga‐Charles, Z. Xu, K. M. Hurlbut, P. Junco‐Muñoz, R. C. Dart, M. M. Aposhian, Toxicology 1995, 97, 23–38..
(15) [3] B. Drahos, I. Lukes, E. Toth, Eur. J. Inorg. Chem. 2012, 1975–1986. [4] a) K. W.‐Y. Chan, W.‐T. Wong, Coord. Chem. Rev. 2007, 251, 2428–2451. b) E. Terreno, D. D. Castelli, A. Viale, S. Aime, Chem. Rev. 2010, 110, 3019–3042. [5] L. Sarka, L. Burai, E. Brucher, Chem. Eur. J. 2000, 6, 719–724. [6] a) S. V. Smith, J. Inorg. Biochem. 2004, 98, 1874–1901. b) M. Shokeen, C. J. Anderson, Acc. Chem. Res. 2009, 42, 832–841. [7] S. Abada, A. Lecointre, M. Elhabiri, L. J. Charbonniere, Dalton Trans. 2010, 39, 9055–9062. [8] C. P. Pippin, T. J. McMurry, M. W. Brechbiel, M. McDonald, R. Lambrecht, D. Milenic, M. Roselli, D. Colcher, O. A. Gansow, Inorg. Chim. Acta 1995, 239, 43–51. [9] L. Burai, I. Fabian, R. Kirali, E. Szilagyi, E. Brucher, J. Chem. Soc., Dalton Trans. 1998, 243–248. [10] A. Bianchi, L. Calabi, C. Giorgi, P. Losi, P. Mariani, D. Palano, P. Paoli, P. Rossi, B. Valtancoli, J. Chem. Soc., Dalton Trans. 2001, 917–922. [11] L. M. P. Lima, D. Esteban‐Gomez, R. Delgado, C. Platas‐Iglesias, R. Tripier, Inorg. Chem. 2012, 51, 6916–6927. [12] R. Ferreiros‐Martinez, D. Esteban‐Gomez, A. de Blas, C. Platas‐Iglesias, T. Rodriguez‐Blas, Inorg. Chem. 2009, 48, 11821–11831. [13] R. Ferreiros‐Martinez, D. Esteban‐Gomez, E. Toth, A. de Blas, C. Platas‐Iglesias, T. Rodriguez‐ Blas, Inorg. Chem. 2011, 50, 3772–3784. [14] R. Ferreiros‐Martinez, C. Platas‐Iglesias, A. de Blas, D. Esteban‐Gomez, T. Rodriguez‐Blas, Eur. J. Inorg. Chem. 2010, 2495–2503. [15] R. Ferreiros‐Martinez, D. Esteban‐Gomez, C. Platas‐Iglesias, A. de Blas, T. Rodriguez‐Blas, Inorg. Chem. 2009, 48, 10976–10987. [16] R. Ferreiros‐Martinez, D. Esteban‐Gomez, C. Platas‐Iglesias, A. de Blas, T. Rodriguez‐Blas, Dalton Trans. 2008, 5754–5765. [17] M. Regueiro‐Figueroa, B. Bensenane, E. Ruscsak, D. Esteban‐Gomez, L. J. Charbonniere, G. Tircso, I. Toth, A. de Blas, T. Rodriguez‐Blas, C. Platas‐Iglesias, Inorg. Chem. 2011, 50, 4125–4141. [18] R. Delgado, J. J. R. F. Da Silva, Talanta 1982, 29, 815–822. [19] S. Chaves, R. Delgado, J. J. R. F. Da Silva, Talanta 1992, 39, 249–254. [20] E. T. Clarke, A. E. Martell, Inorg. Chim. Acta 1991, 190, 27–36. [21] Z. Palinkas, A. Roca‐Sabio, M. Mato‐Iglesias, D. Esteban‐Gomez, C. Platas‐Iglesias, A. de Blas, T. Rodriguez‐Blas, E. Toth, Inorg. Chem. 2009, 48, 8878–8889. [22] M. T. S. Amorim, R. Delgado, J. J. R. F. Da Silva, Polyhedron 1992, 11, 1891–1899. [23] H. Z. Cai, T. A. Kaden, Helv. Chim. Acta 1994, 77, 383–398..
(16) [24] a) A. Takács, R. Napolitano, M. Purgel, A. Csaba Bényei, L. Zékány, E. Brücher, I. Tóth, Z. Baranyai, S. Aime, Inorg. Chem. 2014, 53, 2858–2872. b) K. Kumar, M. F. Tweedle, M. F. Malley, J. Z. Gougoutas, Inorg. Chem. 1995, 34, 6472–6480. [25] E. Prenesti, P. G. Daniele, S. Berto, S. Toso, Polyhedron 2006, 25, 2815–2823. [26] H. Z. Cai, T. A. Kaden, Helv. Chim. Acta 1994, 77, 383–398. [27] a) U. Cosentino, A. Villa, D. Pitea, G. Moro, V. Barone, A. Maiocchi, J. Am. Chem. Soc. 2002, 124, 4901–4909. b) V. Jacques, J.‐F. Desreux, Inorg. Chem. 1994, 33, 4048–4053. c) S. Aime, A. Barge, M. Botta, M. Fasano, J. D. Ayala, G. Bombieri, Inorg. Chim. Acta 1996, 246, 423–429. d) C. Platas‐ Iglesias, Eur. J. Inorg. Chem. 2012, 2023–2033. [28] M. Regueiro‐Figueroa, D. Esteban‐Gomez, A. de Blas, T. Rodriguez‐Blas, C. Platas‐Iglesias, Eur. J. Inorg. Chem. 2011, 50, 3586–3595. [29] a) E. J. Corey, J. C. Bailar Jr, J. Am. Chem. Soc. 1959, 81, 2620–2629. b) J. K. Beattie, Acc. Chem. Res. 1971, 4, 253–259. [30] W. Niu, E. H. Wong, G. R. Weisman, Y. Peng, C. J. Anderson, L. N. Zakharov, J. A. Golen, A. L. Rheingold, Eur. J. Inorg. Chem. 2004, 3310–3315. [31] M. Di Vaira, F. Mani, P. Stoppioni, J. Chem. Soc., Dalton Trans. 1998, 1879–1884. [32] a) C. Bazzicalupi, A. Bianchi, E. Berni, L. Calabi, C. Giorgi, P. Mariani, P. Losi, B. Vantalcoli, Inorg. Chim. Acta 2002, 329, 93–99. b) R. D. Hancock, J. H. Reibenspies, H. Maumela, Inorg. Chem. 2004, 43, 2981–2987. c) F. Cuenot, M. Meyer, E. Espinosa, A. Bucaille, R. Burgat, R. Guilard, C. Marichal‐ Westrich, Eur. J. Inorg. Chem. 2008, 267–283. [33] M. L. Hu, Y. P. Lu, H. M. Zhang, B. Tu, Z. M. Jin, Inorg. Chem. Commun. 2006, 9, 962–965. [34] O. P. Anderson, J. H. Reibenspies, Acta Crystallogr., Sect. C 1996, 52, 792–795. [35] L. Shimoni‐Livny, J. P. Glusker, C. W. Bock, Inorg. Chem. 1998, 37, 1853–1867. [36] D. Esteban‐Gomez, C. Platas‐Iglesias, T. Enriquez‐Perez, F. Avecilla, A. de Blas, T. Rodriguez‐ Blas, Inorg. Chem. 2006, 45, 5407–5416. [37] H. M. Irving, M. G. Miles, L. D. Pettit, Anal. Chim. Acta 1967, 38, 475–488. [38] L. Zekany, I. Nagypal, in: Computational Methods for the Determination of Formation Constants (Ed.: D. J. Leggett), Plenum Press, New York, 1985, p. 291. [39] M. J. Frisch, G. W. Trucks, H. B. Schlegel, G. E. Scuseria, M. A. Robb, J. R. Cheeseman, G. Scalmani, V. Barone, B. Mennucci, G. A. Petersson, H. Nakatsuji, M. Caricato, X. Li, H. P. Hratchian, A. F. Izmaylov, J. Bloino, G. Zheng, J. L. Sonnenberg, M. Hada, M. Ehara, K. Toyota, R. Fukuda, J. Hasegawa, M. Ishida, T. Nakajima, Y. Honda, O. Kitao, H. Nakai, T. Vreven, J. A. Montgomery Jr., J. E. Peralta, F. Ogliaro, M. Bearpark, J. J. Heyd, E. Brothers, K. N. Kudin, V. N. Staroverov, R. Kobayashi, J. Normand, K. Raghavachari, A. Rendell, J. C. Burant, S. S. Iyengar, J. Tomasi, M. Cossi, N. Rega, J. M. Millam, M. Klene, J. E. Knox, J. B. Cross, V. Bakken, C. Adamo, J. Jaramillo, R. Gomperts, R. E. Stratmann, O. Yazyev, A. J. Austin, R. Cammi, C. Pomelli, J. W. Ochterski, R. L. Martin, K. Morokuma, V. G. Zakrzewski, G. A. Voth, P. Salvador, J. J. Dannenberg, S. Dapprich, A. D. Daniels, O. Farkas, J. B. Foresman, J. V. Ortiz, J. Cioslowski, D. J. Fox, Gaussian 09, revision B.01, Gaussian, Inc., Wallingford CT, 2009..
(17) [40] J. M. Tao, J. P. Perdew, V. N. Staroverov, G. E. Scuseria, Phys. Rev. Lett. 2003, 91, 146401–146404. [41] Energy‐consistent ECPs and associated basis sets are available at http://www.theochem.uni‐ stuttgart.de/index.en.html. [42] D. Figgen, G. Rauhut, M. Dolg, H. Stoll, Chem. Phys. 2005, 311, 227–244. [43] B. Metz, H. Stoll, M. Dolg, J. Chem. Phys. 2000, 113, 2563–2569. [44] J. Tomasi, B. Mennucci, R. Cammi, Chem. Rev. 2005, 105, 2999–3093.. i. Supporting information for this article is available online: https://doi.org/10.1002/ejic.201402693..
(18)
Figure
![Table 1. Stability constants of the [M(do3a‐pic)] 2– complexes (I = 0.1 M KCl, 0.1 M KNO 3 or 0.1 M Me 4 NNO 3 25 °C) and related systems](https://thumb-us.123doks.com/thumbv2/123dok_es/7241342.433359/4.892.79.825.141.663/table-stability-constants-complexes-kcl-kno-related-systems.webp)
![Figure 1. Absorption spectra of the Cu 2+ –do3a‐pic system as a function of pH recorded at pH 0.25–10.95 ([HCl]+[KCl] = 0.1 M, [Cu 2+ ] = [do3a‐pic] = 2.0 mM, l = 1 cm, 25 °C)](https://thumb-us.123doks.com/thumbv2/123dok_es/7241342.433359/5.892.138.755.755.1091/figure-absorption-spectra-pic-function-recorded-hcl-kcl.webp)
+4
![Figure 3. 1 H spectra [500 MHz] of [M(do3a‐pic)] 2– complexes recorded in D 2 O solution at 298 K and pD 7.4](https://thumb-us.123doks.com/thumbv2/123dok_es/7241342.433359/8.892.213.685.76.523/figure-h-spectra-mhz-pic-complexes-recorded-solution.webp)
![Figure 5. Minimum energy conformations obtained for [M(do3a‐pic)] 2– complexes from DFT calculations performed in aqueous solution](https://thumb-us.123doks.com/thumbv2/123dok_es/7241342.433359/11.892.152.743.613.1076/figure-minimum-conformations-obtained-complexes-calculations-performed-solution.webp)
![Table 4. Bond lengths of the metal coordination environments [Å] obtained for the [M(do3a ‐pic)] 2–](https://thumb-us.123doks.com/thumbv2/123dok_es/7241342.433359/12.892.150.743.142.361/table-bond-lengths-metal-coordination-environments-å-obtained.webp)
Documento similar
Hence, although the enol–enethiol tautomers of uracil and its thio derivatives should not be observed in the gas phase, the corresponding Ca 2+ complexes are the most stable
A general evaluation of the capability of COSMO-RS to predict the Henry’s law constants of propane and propylene in ILs was per- formed by the comparison of the computed results with
0.17 wt% of PAA-BRO was considered to be the optimum weight for coating the PBAE/DNA complexes due to their relatively small size, higher stability, and even higher particle
The composition of these messenger ribonucleoprotein (mRNP) complexes is dynamic and determines the mRNA fate. Trans-regulatory proteins promoting translation like PAB1 and
In the previous sections we have shown how astronomical alignments and solar hierophanies – with a common interest in the solstices − were substantiated in the
Hence, the higher resistance to acidification of the hydride originating from complex 1 results in higher TON and FA concentrations compared to the performance of complexes 2 and
However, in the case of copper, hundreds of complexes based on picolinic acid derivatives have been prepared, giving rise to molecular complexes [20, 21]
b Departamento de Química Inorgánica, Universidad Autónoma de Madrid, 28049 Madrid, Spain.. c Departamento de Química Orgánica y Química Inorgánica, Universidad
