1
Quantifying the respective roles of aerosols and clouds in the strong brightening
1
since the early 2000s over the Iberian Peninsula
2
3
D. Mateos1*, A. Sanchez-Lorenzo2,3, M. Antón4,5, V.E. Cachorro1, J. Calbó2, M.J. 4
Costa5, B. Torres1, M. Wild6 5
1
Grupo de Óptica Atmosférica, University of Valladolid, Valladolid, Spain, *e-mail: 6
2
Group of Environmental Physics, University of Girona, Girona, Spain 8
3
Instituto Pirenaico de Ecología, Consejo Superior de Investigaciones Científicas (IPE-9
CSIC), Zaragoza, Spain 10
4
Department of Physics, University of Extremadura, Badajoz, Spain 11
5
Évora Geophysics Centre and Dep. Physics, University of Évora, Évora, Portugal 12
6
Institute for Atmospheric and Climate Science, ETH Zurich, Zurich, Switzerland 13
14
2
Abstract
16
The contribution of clouds and aerosols to the decadal variations of downward surface 17
shortwave radiation (SSR) is a current controversial topic. This study proposes a 18
method, which is based on surface-based SSR measurements, aerosol observations, and 19
radiative transfer simulations (in cloud-free and cloud- and aerosol-free scenarios), to 20
evaluate cloud-aerosol (CARE), cloud (CRE), and aerosol (ARE) radiative effects. This 21
method is applied to quantify the role played by, separately, clouds and aerosols on the 22
intense brightening of the SSR observed in the Iberian Peninsula. Clouds and Earth’s 23
Radiation Energy Budget System (CERES) and surface-based data exhibit an increase 24
in SSR between 2003 and 2012, exceeding +10 Wm-2 over this period for some areas of 25
the peninsula. The calculations are performed for three surface-based sites: Barcelona 26
and Valladolid (Spain), and Évora (Portugal). Ranges in monthly values of CARE, 27
CRE, and ARE are (-80, -20), (-60, -20), and (-30, 0), respectively (in Wm-2). The 28
average trends for the analyzed period of CARE, CRE, and ARE are +7, +5, and +2 29
Wm-2 per decade, respectively. Overall, three-fourths of the SSR trend is explained by 30
clouds, while the other one-fourth is related to aerosol changes. The SSR trends 31
explained by the clouds and aerosol radiative effects are in line with the observed 32
reductions in total cloud cover and aerosol load (both at the surface and in the whole 33
atmospheric column). Furthermore, the CRE values are compared against CERES data 34
showing good agreement between both data series, although some discrepancies are 35
observed in their trends. 36
37
Keywords: downward shortwave radiation trend; brightening period; cloud and aerosol 38
3 Key Points:
40
1) A strong brightening is observed between 2003 and 2012 in the Iberian Peninsula 41
2) Solar radiation change is explained 75% by clouds and 25% by aerosols 42
4
1. Introduction
44
Trends of downward surface shortwave radiation (SSR) have received much attention 45
due to their role in climate change. Variations of the SSR levels may cause a relevant 46
effect on the planetary radiative budget [Trenberth et al., 2009; Stephens et al., 2012; 47
Wild et al., 2013], hydrological cycle [e.g., Niemeier et al., 2013; Wang and Yang, 48
2014], and carbon cycle [e.g., Ramanathan and Carmichael, 2008]. 49
Regarding trends in SSR, two different periods have been distinguished in many regions 50
worldwide: a decreasing trend in SSR from the early 1960s to the 1980s, and an 51
increasing trend beyond the late 1980s. The first period is known as the dimming period 52
[Stanhill and Cohen, 2001], while the second one is the brightening period (BP) [Wild 53
et al., 2005]. All these decadal variations in SSR were mainly attributed to variations in 54
clouds and aerosols and the interactions between them [Wild, 2009]. Changes in the 55
concentration of various atmospheric gases such as ozone and water vapor play a 56
negligible role on the significant long-term variations detected in the incoming SSR at 57
the surface [e.g., Kvalevag and Myhre, 2007; Antón and Mateos, 2013; Mateos et al., 58
2013]. Nevertheless, the relative contribution of clouds and aerosols to the temporal 59
changes in SSR is not clear yet [e.g., Norris and Wild, 2009; Chiacchio and Vitolo, 60
2012; Kawamoto and Hayasaka, 2012]. On the one hand, the discussion of aerosol 61
radiative effects is usually restricted to cloud-free conditions. For instance, Ruckstuhl et 62
al. [2008] have found for Northern Germany and Switzerland a strong decline in aerosol 63
load of about 60% since the 1980s, which is responsible for the BP under cloud-free 64
skies. Hence, the direct aerosol effect is suggested as the dominant one on modulating 65
the radiative budget [Philipona et al., 2009]. Equally, Kudo et al. [2012] attributed the 66
5
since clouds exhibit no significant trend for the same period. With respect to aerosol 68
indirect effect, Ruckstuhl et al. [2010] found a small contribution (five times smaller 69
than the direct effect) to the BP over Europe. All of these studies agree in pointing out 70
aerosols as the main factor modulating the BP during the last decades. 71
Nevertheless, the long-term contribution of the cloud radiative effect is a matter of 72
controversy. Some studies state that clouds seem to contribute in a lesser extent to the 73
SSR changes than aerosols [e.g., Norris and Wild, 2007; Ruckstuhl et al., 2008; 74
Ruckstuhl and Norris, 2009]. However, other studies indicate that decrease in cloud 75
cover as well as changes in the cloud types and cloud optical properties are the main 76
responsible for the BP. For instance, Hatzianastassiou et al. [2005] found that low-level 77
clouds can explain up to 70% of the BP observed between 1984 and 2000 on a detailed 78
global-scale analysis. Stjern et al. [2009] analyzed the relationship between SSR records 79
and cloud cover and aerosol information at 11 stations in northwestern Europe and the 80
European Arctic. Their results showed that SSR changes can be mainly explained by 81
variations in cloud cover in most cases. Yang et al. [2011] stated that cloud and aerosol 82
effects on BP over the Tibetan Plateau are comparable. In addition, Liley [2009] 83
suggested that brightening in New Zealand was also due to changes in cloudiness. 84
Similarly, Long et al. [2009] and Augustine and Dutton [2013] concluded that changes 85
in aerosols alone cannot explain the observed SSR changes in the USA since 1996. 86
Therefore, the contribution of the atmospheric factors responsible for the increasing 87
trend in SSR needs to be more thoroughly investigated. 88
In a previous study, Mateos et al. [2013] described a methodology to obtain the 89
radiative effects for the cloud-aerosol system as a whole. The current study goes further 90
6
method proposed in this paper to discriminate between cloud and aerosol radiative 92
effects is based on measurements of SSR and aerosol properties, and radiative transfer 93
simulations. Therefore, it can be applied at a large number of stations worldwide. To 94
our knowledge, this study is the first effort in the use of surface-based data (both SSR 95
and columnar aerosols observations) in the separate retrieval of the long-term radiative 96
effects related to clouds and aerosols. As discussed in the present study, an intense and 97
recent BP was observed for the Iberian Peninsula (Southwestern Europe) starting in the 98
early 2000s [e.g., Bilbao et al., 2011; Sanchez-Lorenzo et al., 2013a]. Taking advantage 99
of this phenomenon, the proposed method is applied to obtain separate cloud and 100
aerosol radiative effects, and their temporal variations, for this region and time period. 101
102
2. Database
103
Spanish SSR measurements were provided by the Spanish Meteorological Agency 104
(AEMET). The same collection of 13 data series extensively described by Sanchez-105
Lorenzo et al. [2013a] is used in this study to document brightening over the Iberian 106
Peninsula. Details about calibration, quality control, and homogenization were 107
described by these authors. SSR measurements (305-2800 nm) have been performed by 108
using Kipp & Zonen pyranometers with an expected daily relative uncertainty <5% 109
[e.g., Bilbao et al., 2011]. In addition, the site Barcelona is also used because it has 110
coincident aerosol data. The same procedures are applied to this latter time series. The 111
Portuguese station used in this study is located in the city of Évora and maintained by 112
the University of Évora. At this station, an Eppley black and white pyranometer records 113
SSR. This time series was validated against a nearby site (Mitra, with a Kipp&Zonen 114
7
Monthly mean of aerosol properties are obtained from the Aerosol Robotic Network 116
(AERONET). Level 2.0 data are downloaded in order to obtain reliable aerosol 117
information of aerosol optical depth (AOD) and Ångström coefficient α [e.g., Toledano 118
et al., 2007]. The advantage of level 2.0 (quality-assured) with respect to other levels is 119
that the data are calibrated before and after a measurement period (usually about one 120
year), cloud-screened, and manually inspected to ensure high quality aerosol data. 121
According to Holben et al. [1998], the estimated uncertainty is 0.01–0.02 for the aerosol 122
optical depth. Monthly gaps of aerosol data are filled with the corresponding monthly 123
climatological mean for the whole analyzed period. The number of filled gaps are 3, 17, 124
and 19 for the sites Valladolid, Barcelona and Évora, respectively. The data gaps in the 125
Barcelona and Evora time series all occurred in the first year of each time series and in 126
2006. The filling of these gaps (<15% of the entire dataset) is necessary to better 127
reproduce the temporal trends of the aerosol effects [e.g., Bennouna et al., 2014]. 128
Values of AOD at 440 and 1020 nm, and α coefficient are used as input in the 129
simulations described in the next section. 130
Locations with both aerosol and SSR measurements are required in this study for the 131
longest possible period. Only three sites in the Iberian Peninsula offer high-quality, 132
long-term, and collocated SSR and aerosol data: Barcelona, Évora, and Valladolid 133
(which uses aerosol information from 40 km away at Palencia). All required variables 134
are available since 2003 for Valladolid and Évora, and since 2004 for Barcelona. Table 135
1 shows the geographical information of the three stations. The distance between 136
aerosol and radiation sites seems not to be a disadvantage since the columnar aerosol 137
observations are representative for the background aerosols over each area. For 138
8
which is not affected by high pollution conditions; hence, they are adequate to 140
characterize the aerosol information of the site Valladolid. 141
The Clouds and the Earth's Radiant Energy System (CERES) EBAF 142
(Energy Balanced And Filled)-Surface data set (Ed2.7) [Kato et al., 2013] is also used 143
in this study. This data set provides a wide spatial and long temporal coverage of 144
radiative products that can be compared with the surface-based results presented in this 145
study. These data were obtained from the NASA Langley Research Center 146
(http://ceres.larc.nasa.gov/). CERES is a three-channel radiometer measuring solar 147
radiation (0.3-5 μm), emitted terrestrial radiation (8-12 μm), and total radiation (0.3- 148
>100 μm) with a spatial resolution of 20 km at nadir. The EBAF-Surface product 149
provides computed monthly mean surface radiative fluxes [Kato et al., 2013]. Two 150
products from the CERES EBAF-Surface database are used: downward surface 151
shortwave radiation (SSRCERES), and surface shortwave cloud radiative effect 152
(CRECERES). This database is provided as a monthly grid with a resolution of 1º x 1º. 153
Computed fluxes are based on cloud and aerosol observations from instruments onboard 154
Earth Observing System (EOS) Terra and Aqua satellites and other meteorological 155
assimilation data from the Goddard Earth Observing System (GEOS). Further details 156
about CERES are provided by Wielicki et al. [1996]. To compare the monthly 157
anomalies of surface measurements to those computed from 1° by 1° CERES monthly 158
data, the CERES data were interpolated to the locations of the surface measurements 159
using a two-dimensional spatial interpolation from the four closest pixels. A previous 160
comparison [Kato et al., 2013] between CERES and surface-based observations 161
(monthly mean irradiances) from 10 years of data has shown a bias of -1.7 Wm-2 and a 162
9
Additional information for this analysis including ozone, water vapor, and surface 164
albedo are obtained using the methodology described by Mateos et al. [2013]. Total 165
ozone column and precipitable water column are retrieved from the ERA-Interim 166
reanalysis produced by the European Centre for Medium-Range Weather Forecasts 167
(ECMWF), while monthly land surface albedo is obtained from the MERRA (Modern 168
Era Retrospective‐analysis for Research and Applications) reanalysis. 169
170
Table 1. Details of the three sites (SSR measurements) used in this study.
171
Station Latitude (ºN) Longitude (ºE) Altitude (m a.s.l.) Time period AERONET Aerosol station
Barcelona 41.39 2.12 125 2004-2012 Barcelona
Valladolid 41.65 -4.77 735 2003-2012 Palencia
Évora 38.57 -7.91 293 2003-2012 Évora
172
173
3. Methodology
174
Radiative flux calculations are required in the evaluation of the radiative effects. 175
Reanalysis information (ozone, water vapor, and surface albedo) and AERONET level 176
2.0 aerosol data are used as input [see Valenzuela et al., 2012; Mateos et al., 2014; 177
among others] for the libRadtran model [Mayer and Kylling, 2005]. The rest of the 178
information required to run the model is the same as explained in detail by Mateos et al. 179
[2013]. The simulations are performed each month (with the corresponding monthly 180
means of ozone, aerosols, water vapor, and albedo as input) between 2003 and 2012. 181
Hence, monthly SSR can be estimated under different conditions: SSRcloud&aer-free for a 182
cloud- and aerosol-free atmosphere; and SSRcloud-free for a cloud-free atmosphere (i.e., 183
10
With these simulations, the radiative effects of the cloud-aerosol, cloud, and aerosol 185
systems can be derived as [Ramanathan et al., 1989]: 186
187
CARE = ( 1 - albsur) (SSRSB - SSRcloud&aer-free) (1) 188
CRE = ( 1 - albsur) (SSRSB - SSRcloud-free) (2) 189
ARE = ( 1 - albsur) (SSRcloud-free - SSRcloud&aer-free) (3) 190
where SSRSB is the surface-based SSR measurement for all-sky conditions. 191
As can be deduced from the three equations, CARE = CRE + ARE. The separate 192
contribution of clouds and aerosols can be obtained with this method. CRE obtained 193
from this method is also called the surface-based CRE (CRESB) to distinguish it from 194
CERES data (CRECERES). 195
Temporal trends are evaluated following the Sen’s slope method and the Mann-Kendall 196
test for significance. In order to remove the seasonal dependence from the results, trends 197
are calculated analyzing the monthly anomalies, which are defined as the difference 198
between the actual value and the corresponding climatic monthly value (i.e., mean of 199
the 10 years analyzed). The trends are obtained in W m-2 per year for the analyzed 200
period; however, to simplify the notation of the numbers, the units chosen to show the 201
trends are Wm-2 per decade. 202
203
4. Results and discussion
204
4.1. Brightening in the Iberian Peninsula since the 2000s
11
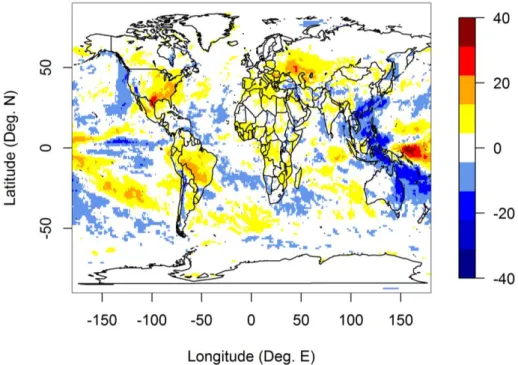
Satellite derived observations are a useful tool to evaluate global scale SSR trends [e.g., 206
Pinker et al., 2005; Hatzianastassiou et al., 2005; 2012]. In this sense, Figure 1 shows 207
the SSR trends as determined from CERES data on a global basis between 2003 and 208
2012. Most of the Earth’s surface shows small changes of SSR (white areas in Figure 209
1). However, several parts of the world present large trends, mainly: Brazil, USA, South 210
America, Southern and Eastern Europe, and Oceania. Some regions present SSR 211
changes around +10 W m-2 per decade, although extreme values of -20 and over +20 W 212
m-2 per decade are also observed. For the latitudinal belt between 60ºS and 60ºN, we 213
obtained an average SSR trend in the period 2003-2012 of +0.4 W m-2 per decade using 214
CERES data. At the global scale, a slight BP for SSR is, therefore, observed. The large 215
negative trends shown in Figure 1 in the western Pacific area cannot balance the global 216
SSR increase in this period. Wild [2012] reported the average values of SSR trends after 217
2000 for five different regions by using surface-based observations: USA (+8 Wm-2 per 218
decade), Europe (+3 Wm-2 per decade), China/Mongolia (-4 Wm-2 per decade), Japan (0 219
Wm-2 per decade), and India (-10 Wm-2 per decade). Regarding Europe, the value 220
reported by Wild [2012] is in line with the majority of the studies reporting SSR trends 221
since the 1980s. In summary, a dimming of SSR is seen in the western Pacific area, 222
while the brightening is observed in the tropical and southeastern Pacific, USA, South 223
America, and Europe. The intensity of the brightening depends on the area and its local 224
conditions. For instance, Table 2 summarizes some of the results of previous studies 225
dealing with the BP in Europe. One of the areas with a notable interest is the Iberian 226
Peninsula (Southwestern Europe) with a recent strong BP that shows higher rates than 227
the surrounding areas. 228
229
12
Table 2. SSR trends for different sites in Europe. More references and regions can be found in the review
231
by Wild (2009).
232
Reference SSR trend Time period Region
Sanchez-Lorenzo et al. [2013a] +3.9a 1985-2010 Spain
Bilbao et al. [2011] -15b 1991-2000 Central Spain
Bilbao et al. [2011] +7.5b 2001-2010 Central Spain
Wild [2009] +5a 1985-2005 Iberian Peninsula
Wild [2009] +3.6a 1985-2005 France
Ruckstuhl et al. [2008] +2.6a 1981-2005 Switzerland
Ruckstuhl et al. [2008] +3.3a 1981-2005 Northern Germany
Stjern et al. [2009] +4.4b 1983-2003 Northern Europe
Lindfors et al. [2007] +1.2b 1983-2005 Norway
Lindfors et al. [2007] +4.4b 1983-2005 Sweden
Lindfors et al. [2007] +2.5b 1983-2005 Finland
Lindfors et al. [2007] +3.8b 1983-2005 Finland
Sanchez-Lorenzo et al. [2013b] +4.5a 1994-2005 Europe
Chiacchio and Wild [2010] +0.4a 1985-2000 Europe
Hakuba et al. [2013a] +7.0a 2000-2007 Europe
Norris and Wild [2007] +1.4a 1987-2002 Europe
a. W/m2 per decade. b. % per decade 233
234
235
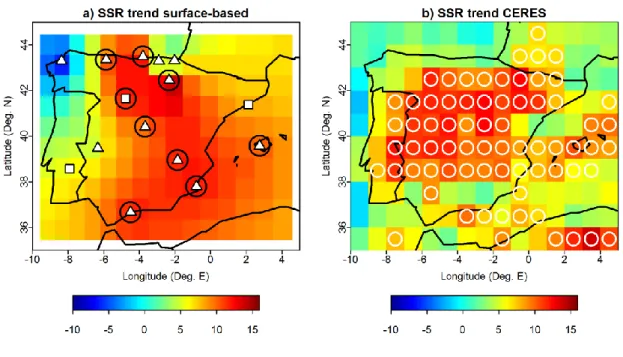
The temporal trends of SSR are established for the period 2003-2012 in the present 236
work for the Iberian Peninsula using data from 15 surface-based stations and are shown 237
in Figure 2a. The spatial interpolation is carried out by an ordinary Kriging method 238
[Ribeiro et al., 2001]. This kind of interpolation is usually carried out with 239
meteorological and atmospheric variables [e.g., Jolly et al., 2005; Ruiz-Arias et al., 240
2013]. This process is performed with the following characteristics: sill of 10 W2m-4, 241
range of 3.33º, nugget of 0 W2m-4, and exponential correlation function. In order to 242
minimize possible uncertainties in the results [e.g., Yamamoto, 2000], we decided to 243
limit the discussion of this figure to areas close to each surface-based site. The results 244
are statistically significant (with a level over 90%) for those stations highlighted by a 245
circle. The sites located in the central area of the Iberian Peninsula (Valladolid, Madrid, 246
Logroño, and Albacete) present a strong brightening in SSR with values greater than 247
13
Mediterranean coast (Málaga and Murcia). The sites at the Atlantic and Cantabric 249
(Northern Iberian Peninsula) coasts exhibit a weaker brightening, although their results 250
are generally not statistically significant. Particularly, only one station, A Coruña 251
(Northwestern coast), shows a negative trend of SSR around -7 W m-2 per decade. 252
In order to corroborate this strong brightening over the Iberian Peninsula, data from 253
CERES over the same period are also analyzed, and the results are presented in Figure 254
2b. Areas of 1º x 1º showing statistically significant trends are highlighted by circles in 255
Figure 2b. All the central area again presents an enhancement of the SSR over +10 W 256
m-2 per decade. We observe good agreement between the surface-based and satellite 257
values. Besides the central area, the trend for the Balearic Islands (Mallorca station) is 258
very similar, and again the trends over the Northern and Western coasts of the peninsula 259
exhibit lower values, in line with the surface-based observations shown in Figure 2a. 260
Therefore, the intense BP over the Iberian Peninsula between 2003 and 2012 is 261
corroborated by the surface- and satellite- based results in Figure 2 showing trend 262
values greater than +10 W m-2 per decade. Table 3 shows the information of the SSR 263
temporal trends over the three sites which are used in the following sections. 264
Considering the other 12 sites shown in Figure 2a, the average rate over the peninsula is 265
+7.0 W m-2 per decade (confidence interval of [1.6, 12.9] at the 99% significance level), 266
while the trend for the whole area using CERES data is +6.3 W m-2 per decade 267
(confidence interval of [1.6, 11.9] at the 99% significance level). These rates are in line 268
with the values obtained for Barcelona and Évora sites, although smaller than the trend 269
rate for Valladolid. The strong change of SSR levels at Valladolid site was also reported 270
14
SSR, they found a trend of 0.75% per year in contrast to the −1.5% per year obtained in 272
the period 1991-2000. 273
274
275
Table 3. Temporal trends for the SSR in three stations of the Iberian Peninsula (units in W m-2 per
276
decade); rel.trend is the relative trend with respect to the monthly mean (% per decade), CI is the
277
confidence interval of the trend and SL is the statistical significance level.
278
Station SSR trend rel.trend CI SL Time period
Barcelona 7.6 4.1 [-1.6, 16.7] 88% 2004-2012
Valladolid 12.6 6.7 [4.8, 20.9] 99% 2003-2012
Évora 6.1 3.0 [-4.7,16.6] 70% 2003-2012
Average 7.9 4.1 [0.1,15.3] 96% 2003-2012
279
280
4.2. Quantifying the aerosol and cloud effects in the BP
281
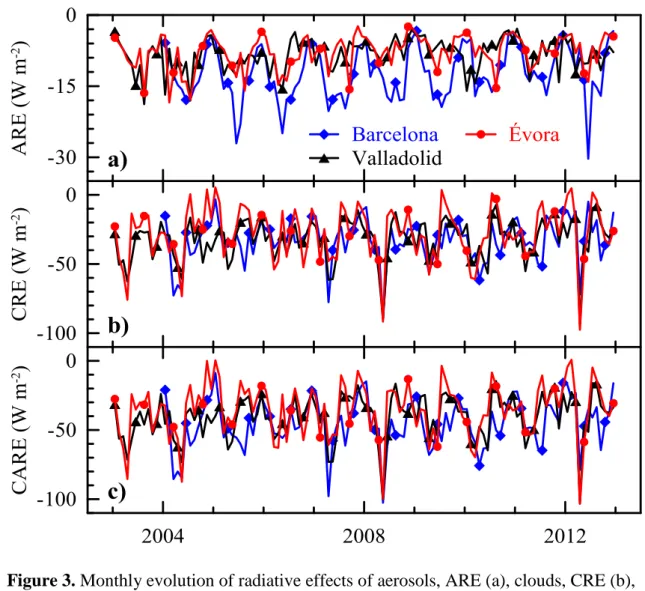
Monthly values of CARE, CRE, and ARE are obtained for the sites Barcelona, 282
Valladolid, and Évora, using the methods described in Section 3. Their temporal 283
evolutions are shown in Figure 3. There are common features for particular periods. For 284
instance, the maximum radiative effects of the clouds-aerosol system (minimum CARE 285
values) obtained in April-2003, May-2008, and April-2012 can be explained by the 286
evolution of clouds since the ARE/CARE ratio is around 0.1, or even less. Hence, 287
clouds explain more than 90% of the CARE values of these peaks (as CARE = CRE + 288
ARE). However, other peaks in May-2004 and April-2007 present a higher contribution 289
of ARE around 20%. The largest ARE values (in absolute term) are obtained in 290
Barcelona, June-2005 and June-2012, with radiative effects around -30 W m-2. For 291
instance, the peak of June-2012 can be explained by the large monthly AOD at 440nm 292
15
with Saharan dust intrusions in Northeastern Spain during that month. As a 294
consequence, ARE represents 86% of the CARE value for this month. The stronger 295
aerosol effect in the Barcelona is in line with previous studies which show larger AOD 296
values at this site [e.g., Mateos et al., 2014], and this is expected since Barcelona is a 297
large city. The well known AOD annual cycle with larger values during summer months 298
is translated to an ARE annual cycle. This seasonal pattern is not as evident for CRE 299
values. 300
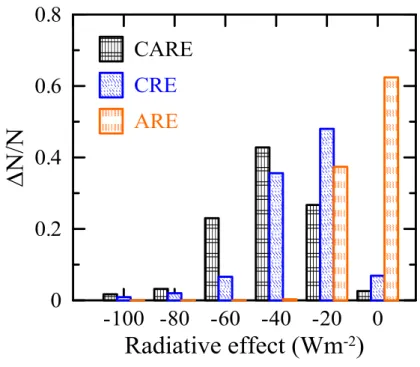
Figure 4 presents the histogram of relative frequency of values for the CARE, CRE and 301
ARE for the three stations. Six intervals are selected between -100 and 0 Wm-2 at 20 302
Wm-2 steps (e.g., -100 ± 10 Wm-2; -80 ± 10 Wm-2;...). As expected from Figure 3, the 303
ARE shows the highest percentage for the smallest (absolute) values (60% of data 304
falling in the interval of 0 ± 10 Wm-2). The maximum contribution of CRE is achieved 305
in the -20 ± 10 Wm-2 interval for almost half of the data, although there is also an 306
significant CRE occurrence in the -40 ± 10 Wm-2 interval. The maximum occurrence of 307
CARE values (around 40%) is in the interval -40 ±10 Wm-2, but with regard to CARE, 308
the intervals at -60 and -20 Wm-2 are also relevant. The magnitude of the values 309
obtained in this study can be compared with the results presented by previous studies 310
(see Table 4). Particularly, ARE values for the three Mediterranean stations 311
(Lampedusa, Valencia, and Granada) are of the same magnitude than the results 312
presented in this study. With respect to CRE, it is very difficult to extract any 313
conclusions since the methodologies to retrieve the cloud radiative effect are very 314
different (using surface-based data, satellite observations, model simulations, or 315
combinations among them); but the values are, in general, similar to what we find here. 316
16
Table 4. Range of radiative effects (monthly or annual scale) obtained by previous studies. Units are W
318
m-2.
319
Reference Station or Region ARE values CRE values Time period
Chen et al. [2000] Worldwide - (-80, 0) 1989-1993
Gautier and Landsfeld [1997] Oklahoma (USA) - (-90, -22) 1993-1994
Ruckstuhl et al. [2008] Switzerland - (-45, 0) 1981-2005
Dong et al. [2006] ARM SCF (USA) - (-120, -50) 1997–2002
Kim and Ramanathan [2008] Worldwide -7 -47 2000-2002
Allan [2011] Worldwide - -52.8 2001-2007
Esteve et al. [2014] Valencia (Spain) (-30, 0) - 2003-2011
Di Biagio et al. [2010] Lampedusa (Mediterranean) (-30,0) - 2004-2007
Valenzuela et al. [2012] Granada (Spain) (-35, 0) - 2005-2011
Pandithurai et al. [2008] New Delhi (-100,0) - 2006
Li et al. [2011] Worldwide - (-400, -50) 2007-2008
García et al. [2014] Canary Islands -7 - 2009-2012
Alam et al. [2012] Pakistan (-110,-70) - 2010-2011
Alam et al. [2012] India (-80,-50) - 2010-2011
320
321
The temporal evolutions of CARE, CRE, and ARE are analyzed, and the results are 322
summarized in Table 5. On average, the positive trend for CARE is +7.5 W m-2 per 323
decade. Note that the average series was built by averaging the monthly anomaly series 324
of each variable (it is not the average of the trends obtained for each series). The 325
average individual trends for CRE and ARE are +5.2 and +1.6 W m-2 per decade, 326
respectively. Evaluating the mean contribution of clouds and aerosols to the CARE 327
trend, we can estimate that almost 3/4 of the trend is explained by clouds, while the 328
other 1/4 is due to aerosol changes. The high statistical significance in the three rates for 329
the site Valladolid supports this relevant result. The mean ARE trend of around +2 Wm -330
2
per decade is in line with the cloud-free SSR trends reported in Europe by previous 331
studies [e.g., Norris and Wild, 2007; Ruckstuhl et al., 2008]. In particular, Folini and 332
Wild [2011] found for the Iberian Peninsula (using the global climate model ECHAM5-333
HAM) a brightening period between 1989 and 2004 under cloud-free conditions of +1.4 334
17
Europe. This fact, together with the CRE decrease, has produced the strong increase in 336
SSR since the 2000s in the Iberian Peninsula. 337
338
339
Table 5. Temporal trends of CARE, CRE (both CRESB and CRECERES), and ARE. The units for the 340
temporal trends are W m-2 per decade, rel.trend is the relative trend with respect to the monthly mean (%
341
per decade), CI is the confidence interval of the trend, SL is the statistical significance level, and CCLOUD 342
and CAEROSOL are the mean contribution of clouds, and aerosols, respectively, to the CARE trend. 343
Barcelona Valladolid Évora Average
CARE
trend 7.0 10.2 5.5 7.5
rel.trend -15.5 -25.1 -15.4 -18.5
CI [-0.8,15.1] [4.1,16.4] [-3.0,13.8] [1.6,13.3]
SL (%) 91 100 77 99
CRESB
trend 4.0 7.7 3.3 5.2
rel.trend -12.2 -23.9 -11.7 -16.7
CI [-4.8,11.8] [1.6,13.4] [-5.3,11.1] [-0.2,11.2]
SL (%) 58 99 57 94
ARE
trend 2.8 2.0 2.1 1.6
rel.trend -22.6 -23.9 -26.7 -17.0
CI [1.2,4.3] [0.4,3.6] [0.8,3.4] [0.3,3.0]
SL (%) 100 95 99 98
CCLOUD (%) 57 75 60 69
CAEROSOL (%) 40 20 38 21
CRECERES
trend 0.5 2.8 -0.6 -
rel.trend -1.3 -7.1 1.9 -
CI [-6.6,8.4] [-2.2,8.0] [-6.8,5.9] -
SL (%) 24 68 19 -
344
345
346
In order to corroborate the decrease in the radiative effects of clouds and aerosols over 347
the Iberian Peninsula in the last decade, the temporal trends of cloud observations, 348
aerosol optical depth at 440 nm (AOD440nm), and particulate matter under 10 μm (PM10) 349
are also analyzed. The AEMET database also contains visual observations of total cloud 350
cover (TCC) three times per day (6, 12, and 18h GMT) [Mateos et al., 2010; Sanchez-351
18
evaluated as percentage of sky covered by clouds (1 okta = 12.5%). Then, monthly 353
values are used to identify the trends in three sites close to the stations analyzed in this 354
study: Valladolid airport (Valladolid), Barcelona airport (Barcelona), and Badajoz 355
(Évora). Aerosol AERONET stations are the same as mentioned in Section 2. It is worth 356
mentioning here that in a previous paper, Mateos et al. [2014] observed a decreasing 357
trend in yearly AOD values over the whole Iberian Peninsula around -0.04 AOD500nm -358
unit per decade. In the same study, the site Barcelona exhibited a statistically significant 359
trend of -0.09 AOD440nm-unit per decade (2004-2012 period). This rate is stronger than 360
the average decrease in AOD of around -0.04 AOD440nm-unit per decade reported over 361
the Euro-Mediterranean region from 1979 and 2009 using satellite and model data 362
[Nabat et al., 2013]. In two sites of the western Mediterranean, Avignon (France) and 363
Ispra (Italy), the AOD trends are insignificant or decreasing in the early 2000s [Yoon et 364
al., 2012]. In the present study, the monthly database described above is used for this 365
purpose. The results are similar to those obtained by Mateos et al. [2014], although the 366
use of a monthly scale adds more significance level to the results. To reinforce the 367
aerosol trends, the more stable database of particulate matter given by PM10 is used. PM 368
data are recorded under all-sky conditions, in contrast to AOD observations which are 369
obtained under cloud-free conditions. In a recent paper focusing on the Palencia-370
AERONET site, Bennouna et al. [2014] have shown the influence of sampling on the 371
PM-AOD relationship and trends, corroborating AOD trends based on the more stable 372
PM series. The PM10 sites used in this study are: the European Monitoring and 373
Evaluation Programme (EMEP) database [Aas et al., 2013] for Valladolid (Peñausende 374
site) and Évora (Barcarrota site); and for the Barcelona station the site of Castellbisball 375
(managed by Generalitat de Catalunya) is selected to present the evolution of PM10 over 376
19
the urban conditions in the Barcelona area. The temporal trends for all these variables 378
and stations are computed following the same methodology that was explained in 379
Section 3. The results are summarized in Table 6. 380
In the Valladolid region, a strong decrease in the cloud cover (-24% per decade) is 381
observed during the analyzed period, which is in line with the large positive CRE trend 382
shown in Table 5. This fact has produced, together with a reduction of the aerosol load 383
(-18% per decade), one of the largest recent BP over the Iberian Peninsula. The 384
reduction in the atmospheric aerosols in this period is corroborated by the negative 385
trends observed in PM10 and AOD440nm. Barcelona station presents the largest negative 386
trend for AOD440nm (-0.06 AOD-unit per decade), which is in line with the slightly more 387
positive trend observed in Table 5 for ARE (+2.8 Wm-2 per decade). The difference 388
between Barcelona and the other two sites for the PM10 results is based on the suburban 389
characteristics of Castellbisball site. The other two sites considered (Peñausende and 390
Barcarrota) are rural, and therefore, represent background aerosols. Local regulations to 391
reduce air pollution in urban environments and the impact of the current economic crisis 392
have produced this large decline of the particulate matter [e.g., Cusack et al., 2012; 393
Querol et al., 2014]. Furthermore, natural aerosols such as intense desert dust events 394
(AOD at 550nm over 0.4) are found to decrease in the western Mediterranean Basin 395
between 2000 and 2007 [Gkikas et al., 2013]. The decreases of cloud cover are slightly 396
smaller for Évora and notably lower for Barcelona, but the low statistical significance of 397
these results for CRE make it difficult to draw firm conclusions for these sites. ARE 398
trends are similar for the three stations (between -0.06 and -0.03 AOD-unit per decade), 399
hence the differences in the SSR trends can be understood as differences in the temporal 400
20
decreases of total cloud cover and aerosol load over the Iberian Peninsula seem to 402
corroborate the strong BP during the last decade. 403
404
405
Table 6. Temporal trends of several variables between 2003 and 2012; rel.trend is the relative trend with
406
respect to the mean monthly value, CI is the confidence interval of the trend, SL is the statistical
407
significance level.
408
Barcelona Valladolid Évora
TCC
trenda -3.2 -9.4 -6.6
rel.trenda -8.5 -23.8 -20.0
CIa [-6.9,0.8] [-13.3,-5.3] [-11.9,-1.5]
SL (%) 85 100 94
PM10
trendb -18.4 -4.7 -3.3
rel.trenda -54.2 -43.9 -21.0
CIb [-23.7,-13.6] [-6.4,-3.0] [-6.0,-0.1]
SL (%) 100 100 99
AOD440nm
trendc -0.06 -0.03 -0.04
rel.trenda -27.8 -18.4 -29.3
CIc [-0.08, -0.03] [-0.05,-0.01] [-0.06,-0.02]
SL (%) 100 97 100
a) units in % per decade. b) units in μg/m3 per decade. c) units in AOD-unit per decade 409
410
411
4.3. CRE comparison between CERES and surface-based data
412
The estimations of CRE performed by CERES instrument (CRECERES) can help to 413
assess the robustness of the proposed method (CRESB). Figure 5 shows the monthly 414
evolution of both CRE series. A good agreement can be observed between them because 415
the two series follow the same pattern and reproduce the same peaks with a similar 416
magnitude. To minimize the impact of the seasonal dependence on this comparison, the 417
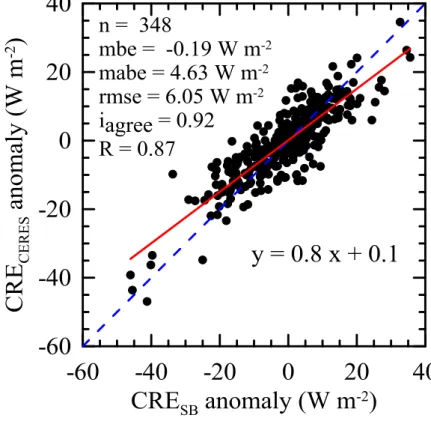
monthly CRE anomalies are used to establish a linear relationship (see Figure 6) 418
between both methods. The results show a good agreement between CRE from CERES 419
21
Nevertheless, the trends calculated from CERES EBAF-Surface are notably smaller 421
than those presented for CRESB (see Table 5). Actually, CRECERES trends indicate no 422
change and slight decrease for the cloud radiative effects in Barcelona and Évora, 423
respectively, although with very low statistical significance. The results for Valladolid 424
site exhibit the highest reduction of cloud effects, which is again linked to the strong BP 425
observed over this station. The differences in the temporal trends can be understood due 426
to two possible reasons: a) the spatial representativeness of 1º x 1º grid as compared to 427
local data [e.g., Hakuba et al., 2013b], which can produce several uncertainties because 428
it is possible that non-homogeneous clouds (non-spatially continuous or different 429
types/levels) can exist in that area; and b) artificial trends in the evaluation of surface 430
clear-sky SSR flux caused by the two versions of satellite aerosol products used in the 431
CERES_EBAF-Surface_Ed2.7 dataset (see the Data Quality Summary, June 7 2013, 432
https://eosweb.larc.nasa.gov/). Looking again at Table 6, the observed trends for TCC 433
over the three stations are in line with those trends obtained for CRESB. Therefore, 434
CRECERES and CRESB are in agreement, but some kind of uncertainty is observed 435
regarding temporal trends. 436
437
438
5. Conclusions
439
Monthly surface shortwave radiation (SSR) data from three surface-based sites 440
(Barcelona, Valladolid, and Évora) of the Iberian Peninsula between 2003 and 2012, 441
and simulations under cloud-free and cloud- and aerosol-free conditions by the 442
libRadtran model are used to obtain the cloud-aerosol (CARE), cloud (CRE), and 443
aerosol (ARE) radiative effects separately. The simulations are performed considering, 444
22
to corroborate the surface-based findings. The main conclusions obtained in this study 446
are summarized next: 447
1) A strong brightening phenomenon is observed in the Iberian Peninsula in the early 448
2000s, around +7 Wm-2 between 2003 and 2012 corroborated by surface-based and 449
satellite data. The central area presents an SSR trend (significance level >90%) greater 450
than 10 Wm-2 per decade. Large trends are also observed in the eastern area. However, 451
the west and northwest areas show weaker trends with values near zero and even 452
negative. 453
2) More than 95% of the CARE values in these stations and time period range between 454
-90 and -10 Wm-2. A similar amount of CRE data is between -70 and 0 Wm-2, and 455
between -30 and 0 Wm-2 for ARE. 456
3) On average, CARE, CRE, and ARE trends exhibit rates of +7, +5, and +2 Wm-2 over 457
the 2003-2012 period, respectively. Therefore, three-fourths of the SSR trend is 458
explained by clouds, while the other one-fourth is due to aerosol changes in this period. 459
4) The increase of the SSR radiation levels is consistent with the reductions in total 460
cloud cover, PM10, and columnar aerosol load in the three sites of study. 461
5) CERES CRE estimations show good agreement with the surface-based data, although 462
some discrepancies are observed in the evaluation of temporal trends. 463
464
The method proposed in this study can be applied to solar radiation databases (such as 465
Global Energy Balance Archive, GEBA) which present both large spatial and long 466
temporal coverage to obtain the separate contribution of clouds and aerosols in other 467
worldwide regions during the last decades. 468
23
Acknowledgments
470
We thank the Spanish Meteorological Agency (AEMET) for providing the surface solar 471
radiation and cloud cover data. We thank the PI investigators and their staff for 472
establishing and maintaining the RIMA/PHOTONS sites of Palencia, Barcelona, and 473
Évora, belonging to AERONET-EUROPE network. The authors also acknowledge the 474
project and support of the European Community - Research Infrastructure Action under 475
the FP7 "Capacities" specific program for Integrating Activities, ACTRIS Grant 476
Agreement no. 262254. CERES data were obtained from the NASA Langley Research 477
Center Atmospheric Science Data Center. We would like to acknowledge EMEP for 478
allowing free access to ambient PM levels recorded at a large number of sites in the 479
Iberian Peninsula. PM10 levels for stations around Barcelona were kindly provided by 480
David Pagès from the Xarxa de Vigilància i Previsió de la Contaminació Atmosfèrica 481
(XVPCA) from the Generalitat de Catalunya. ECMWF ERA-Interim data used in this 482
study have been obtained from the ECMWF data server: http://data.ecmwf.int/data. 483
Analyses and visualizations of MERRA data used in this paper were produced with the 484
Giovanni online data system, developed and maintained by the NASA GES DISC. 485
Manuel Antón thanks Ministerio de Ciencia e Innovación and Fondo Social Europeo for 486
the award of a postdoctoral grant (Ramón y Cajal). Arturo Sanchez-Lorenzo thanks the 487
“Secretaria per a Universitats i Recerca del Departament d'Economia i Coneixement, de 488
la Generalitat de Catalunya i del programa Cofund de les Accions Marie Curie del 7è 489
Programa marc d'R+D de la Unió Europea” (2011BP-B00078) and the postdoctoral 490
fellowship #JCI-2012-12508. Financial support to the University of Valladolid was 491
provided by the Spanish MINECO (Ref. Projects CGL2011-23413 and CGL2012-492
33576). Josep Calbó is supported by the Spanish Ministry of Science and Innovation 493
24
supported by MINECO (ref. CGL2011-29921-C02-01). M. J. Costa thanks the funding 495
provided by the Évora Geophysics Centre, Portugal, under the contract with FCT (the 496
Portuguese Science and Technology Foundation), PEst-OE/CTE/UI0078/2014. 497
498
499
500
References
501
Aas, W., et al. (2013), Transboundary particulate matter in Europe Status report 2013, 502
EMEP Report, 4/2013 (Ref. O-7726), ISSN: 1504-6109 (print), 1504-6192 (online). 503
Alam, K., T. Trautmann, T. Blaschke, and H. Majid (2012), Aerosol optical and 504
radiative properties during summer and winter seasons over Lahore and Karachi, 505
Atmos. Environ., 50, 234–245. 506
Allan, R.P. (2011), Combining satellite data and models to estimate cloud radiative 507
effect at the surface and in the atmosphere, Meteorol. Appl., 18, 324-333. doi: 508
10.1002/met.285. 509
Antón, M., and D. Mateos (2013), Shortwave radiative forcing due to long-term 510
changes of total ozone column over the Iberian Peninsula, Atmos. Environ., 81, 532-511
537, doi: 10.1016/j.atmosenv.2013.09.047. 512
Augustine, J. A., and E. G. Dutton (2013), Variability of the surface radiation budget 513
over the United States from 1996 through 2011 from high-quality measurements, J. 514
Geophys. Res. Atmos., 118, 43–53, doi:10.1029/2012JD018551. 515
Bennouna, Y.S., V. Cachorro, M.A. Burgos, C. Toledano, B. Torres, and A. de Frutos 516
(2014), Relationships between columnar aerosol optical properties and surface 517
Particulate Matter observations in north-central Spain from long-term records (2003-518
25
Bilbao, J., R. Roman, A. de Miguel, and D. Mateos (2011), Long-term solar erythemal 520
UV irradiance data reconstruction in Spain using a semiempirical method, J. 521
Geophys. Res., 116, D22211, doi:10.1029/2011JD015836. 522
Chen, T., W.B. Rossow, and Y. Zhang (2000), Radiative Effects of Cloud-Type 523
Variations, J. Climate, 13, 264-286. 524
Chiacchio, M., and M. Wild (2010), Influence of NAO and clouds on long-term 525
seasonal variations of surface solar radiation in Europe, J. Geophys. Res., 115, 526
D00D22, doi:10.1029/2009JD012182. 527
Chiacchio, M., and R. Vitolo (2012), Effect of cloud cover and atmospheric circulation 528
patterns on the observed surface solar radiation in Europe, J. Geophys. Res., 117, 529
D18207, doi:10.1029/2012JD017620. 530
Cusack, M., A. Alastuey, N. Pérez, J. Pey, and X. Querol (2012), Trends of particulate 531
matter (PM2.5) and chemical composition at a regional background site in the 532
Western Mediterranean over the last nine years (2002–2010), Atmos. Chem. Phys., 533
12, 8341-8357, doi:10.5194/acp-12-8341-2012. 534
Di Biagio, C., A. di Sarra, and D. Meloni (2010), Large atmospheric shortwave 535
radiative forcing by Mediterranean aerosols derived from simultaneous ground-based 536
and spaceborne observations and dependence on the aerosol type and single 537
scattering albedo, J. Geophys. Res., 115, D10209, doi:10.1029/2009JD012697, 2010. 538
Dong, X., B. Xi, and P. Minnis (2006), A Climatology of Midlatitude Continental 539
Clouds from the ARM SGP Central Facility. Part II: cloud fraction and surface 540
radiative forcing, J. Climate, 19, 1765-1782. 541
Esteve, A.R., V. Estellés, M.P. Utrillas, and J.A. Martínez-Lozano (2014), Analysis of 542
the aerosol radiative forcing over a Mediterranean urban coastal site, Atmos. Res., 543
26
Folini, D., and M. Wild (2011), Aerosol emissions and dimming/brightening in Europe: 545
Sensitivity studies with ECHAM5‐HAM, J. Geophys. Res., 116, D21104, 546
doi:10.1029/2011JD016227. 547
Gautier, C. and M. Landsfeld (1997), Surface solar radiation flux and cloud radiative 548
forcing for the Atmospheric Radiation Measurement (ARM) Southern Great Plains 549
(SGP): a satellite, surface observations, and radiative transfer model study, J. Atmos. 550
Sci., 54(10), 1289-1307. 551
Garcia, R.D., O.E. Garcia, E. Cuevas, V.E. Cachorro, P.M. Romero-Campos, R. Ramos, 552
and A.M. de Frutos (2014), Solar radiation measurements compared to simulations at 553
the BSRN Izana station: Mineral dust radiative forcing and efficiency study, J. 554
Geophys. Res. Atmos., 119, doi:10.1002/2013JD020301. 555
Gkikas, A., N. Hatzianastassiou, M. Mihalopoulos, V. Katsoulis, S. Kazadzis, J. Pey, X. 556
Querol, and O. Torres (2013). The regime of intense desert dust episodes in the 557
Mediterranean based on contemporary satellite observations and ground 558
measurements, Atmos. Chem. Phys., 13, 12135-12154, doi:10.5194/acp-13-12135-559
2013. 560
Hakuba, A., A. Sanchez-Lorenzo, D. Folini, and M. Wild (2013a), Testing the 561
Homogeneity of Short-Term Surface Solar Radiation Series in Europe, AIP 562
Conference Proceedings, 1531, 700, doi: 10.1063/1.4804866. 563
Hakuba, M.Z., D. Folini, A. Sanchez-Lorenzo, and M. Wild (2013b), Spatial 564
representativeness of ground-based solar radiation measurements, J. Geophys. Res. 565
Atmos.,118, 8585–8597, doi:10.1002/jgrd.50673. 566
Hatzianastassiou, N., C. Matsoukas, A. Fotiadi, K.G. Pavlakis, E. Drakakis, D. 567
27
shortwave radiation budget, Atmos. Chem. Phys., 5, 2847-2867, doi:10.5194/acp-5-569
2847-2005. 570
Hatzianastassiou, N., C.D. Papadimas, C. Matsoukas, K. Pavlakis, A. Fotiadi, M. Wild, 571
and I. Vardavas (2012), Recent regional surface solar radiation dimming and 572
brightening patterns: inter-hemispherical asymmetry and a dimming in the Southern 573
Hemisphere. Atmosph. Sci. Lett., 13, 43–48. doi: 10.1002/asl.361. 574
Holben, B.N., et al. (1998), AERONET – A federated instrument network and data 575
archive for aerosol characterization, Rem. Sen. Environ., 66, 1–16. 576
Jolly, W.M., J.M. Graham, A. Michaelis, R. Nemani, and S.W. Running (2005), A 577
flexible, integrated system for generating meteorological surfaces derived from point 578
sources across multiple geographic scales, Environ. Modell. Softw., 20, 873-882, 579
doi:10.1016/j.envsoft.2004.05.003. 580
Kato, S., N.G. Loeb, F.G. Rose, D.R. Doelling, D.A. Rutan, T.E. Caldwell, L.S. Yu, 581
R.A. Weller (2013), Surface irradiances consistent with ceres-derived top-of-582
atmosphere shortwave and longwave irradiances. J. Clim., 26(9), 2719-2740. doi: 583
10.1175/Jcli-D-12-00436. 584
Kawamoto, K., and T. Hayasaka (2012), Cloud and aerosol contributions to variation in 585
shortwave surface irradiance over East Asia in July during 2001 and 2007, J. Quant. 586
Spectrosc. Ra., 112, 329–337, doi:10.1016/j.jqsrt.2010.08.002. 587
Kim, D., and V. Ramanathan (2008), Solar radiation budget and radiative forcing due to 588
aerosols and clouds, J. Geophys. Res., 113, D02203, doi:10.1029/2007JD008434. 589
Kudo, R., A. Uchiyama, O. Ijima, N. Ohkawara, and S. Ohta (2012), Aerosol impact on 590
the brightening in Japan, J. Geophys. Res., 117, D07208, 591
28
Kvalevag, M. M., and G. Myhre (2007), Human impact on direct and diffuse solar 593
radiation during the industrial era, J. Climate., 20, 4874– 4883, 594
doi:10.1175/JCLI4277.1. 595
Li, J., Y. Yi, P. Minnis, J. Huang, H. Yan, Y. Ma, W. Wang, and J.K. Ayers (2011), 596
Radiative effect differences between multi-layered and single-layer clouds derived 597
from CERES, CALIPSO, and CloudSat data, J. Quant. Spectrosc. Ra., 112, 361-375, 598
doi:10.1016/j.jqsrt.2010.10.006. 599
Liley, J. B. (2009), New Zealand dimming and brightening, J. Geophys. Res., 114, 600
D00D10, doi:10.1029/2008JD011401. 601
Lindfors, A., J. Kaurola, A. Arola, T. Koskela, K. Lakkala, W. Josefsson, J. A. Olseth, 602
and B. Johnsen (2007), A method for reconstruction of past UV radiation based on 603
radiative transfer modeling: Applied to four stations in northern Europe, J. Geophys. 604
Res., 112, D23201, doi:10.1029/2007JD008454. 605
Long, C. N., E. G. Dutton, J. A. Augustine, W. Wiscombe, M. Wild, S. A. McFarlane, 606
and C. J. Flynn (2009), Significant decadal brightening of downwelling shortwave in 607
the continental United States, J. Geophys. Res., 114, D00D06, 608
doi:10.1029/2008JD011263 609
Mateos, D., J. Bilbao, A. de Miguel, and A. Perez-Burgos (2010), Dependence of 610
ultraviolet (erythemal and total) radiation and CMF values on total and low cloud 611
covers in Central Spain, Atmos. Res., 98, 21–27, doi:10.1016/j.atmosres.2010.05.002. 612
Mateos, D., M. Antón, A. Sanchez-Lorenzo, J. Calbó, and M. Wild (2013), Long-term 613
changes in the radiative effects of aerosols and clouds in a mid-latitude region 614
(1985–2010), Global Planet. Change, 111, 288-295,
615
29
Mateos, D., M. Antón, C. Toledano, V.E. Cachorro, L. Alados-Arboledas, M. Sorribas, 617
M.J. Costa, and J.M. Baldasano (2014), Aerosol radiative effects in the ultraviolet, 618
visible, and near-infrared spectral ranges using long-term aerosol data series over the 619
Iberian Peninsula, Atmos. Chem. Phys. Discuss., 14, 1–39, doi:10.5194/acpd-14-1-620
2014. 621
Mayer, B., and A. Kylling (2005), Technical note: The libRadtran software package for 622
radiative transfer calculations - description and examples of use, Atmos. Chem. 623
Phys., 5, 1855-1877, doi:10.5194/acp-5-1855-2005. 624
Nabat, P. et al. (2013), A 4-D climatology (1979–2009) of the monthly tropospheric 625
aerosol optical depth distribution over the Mediterranean region from a comparative 626
evaluation and blending of remote sensing and model products, Atmos. Meas. Tech., 627
6, 1287-1314. 628
Niemeier, U., H. Schmidt, K. Alterskjær, and J. E. Kristjánsson (2013), Solar irradiance 629
reduction via climate engineering: Impact of different techniques on the energy 630
balance and the hydrological cycle, J. Geophys. Res. Atmos., 118, 11,905–11,917, 631
doi:10.1002/2013JD020445. 632
Norris, J. R., and M. Wild (2007), Trends in aerosol radiative effects over Europe 633
inferred from observed cloud cover, solar ‘‘dimming,’’ and solar ‘‘brightening,’’ J. 634
Geophys. Res., 112, D08214, doi:10.1029/2006JD007794. 635
Norris, J. R., and M. Wild (2009), Trends in aerosol radiative effects over China and 636
Japan inferred from observed cloud cover, solar ‘dimming’ and solar ‘brightening’, 637
J. Geophys. Res., 114, D00D15, doi:10.1029/2008JD011378. 638
Pandithurai, G., S. Dipu, K. K. Dani, S. Tiwari, D. S. Bisht, P. C. S. Devara, and R. T. 639
Pinker (2008), Aerosol radiative forcing during dust events over New Delhi, India, J. 640
30
Pinker, R. T., B. Zhang, and E. G. Dutton (2005), Do satellites detect trends in surface 642
solar radiation? Science, 308, 850– 854. 643
Philipona, R., K. Behrens, and C. Ruckstuhl (2009), How declining aerosols and rising 644
greenhouse gases forced rapid warming in Europe since the 1980s, Geophys. Res. 645
Lett., 36, L02806, doi:10.1029/2008GL036350. 646
Querol, X., et al. (2014), 2001-2012 trends on air quality in Spain, Sci. Total Environ., 647
490, 957-969. 648
Ramanathan, V., and G. Carmichael (2008), Global and regional climate changes due to 649
black carbon. Nat. Geosci., 1, 221–227. 650
Ramanathan, V., R.D. Cess, E.F. Harrison, P. Minnis, B.R. Barkstrom, E. Ahmad, and 651
D. Hartmann (1989), Cloud-Radiative Forcing and Climate: Results from the Earth 652
Radiation Budget Experiment, Science, 243(4887), 57–63. 653
Ribeiro Jr., P.J., and P.J. Diggle (2001), geoR: A package for geostatistical analysis. R-654
News 1(2), 15-18, ISSN 1609-3631. 655
Ruckstuhl, C., et al. (2008), Aerosol and cloud effects on solar brightening and the 656
recent rapid warming, Geophys. Res. Lett., 35, L12708, doi:10.1029/2008GL034228. 657
Ruckstuhl, C., and J. R. Norris (2009), How do aerosol histories affect solar ‘dimming’ 658
and ‘brightening’ over Europe?: IPCC-AR4 models versus observations, J. Geophys. 659
Res., 114, D00D04, doi:10.1029/2008JD011066 660
Ruckstuhl, C., J. R. Norris, and R. Philipona (2010), Is there evidence for an aerosol 661
indirect effect during the recent aerosol optical depth decline in Europe?, J. Geophys. 662
Res., 115, D04204, doi:10.1029/2009JD012867. 663
Ruiz-Arias, J.A., J. Dudhia, V. Lara-Fanego, and D. Pozo-Vázquez (2013), A 664
geostatistical approach for producing daily Level-3 MODIS aerosol optical depth 665
31
Sanchez-Lorenzo, A., J. Calbo, and M. Wild (2012), Increasing cloud cover in the 20th 667
century: review and new findings in Spain, Clim. Past, 8, 1199-1212. 668
Sanchez-Lorenzo, A., J. Calbó, and M. Wild (2013a), Global and diffuse solar radiation 669
in Spain: Building a homogeneous dataset and assessing trends, Global Planet. 670
Change, 100, 343-352, http://dx.doi.org/10.1016/j.gloplacha.2012.11.010. 671
Sanchez-Lorenzo, A., M. Wild, and J. Trentmann (2013b), Validation and stability 672
assessment of the monthly mean CM SAF surface solar radiation dataset over Europe 673
against a homogenized surface dataset (1983–2005), Remote. Sens. Environ., 134, 674
355–366. 675
Stanhill, G. and S. Cohen (2001), Global dimming: a review of the evidence for a 676
widespread and significant reduction in global radiation with discussion of its 677
probable causes and possible agricultural consequences, Agr. Forest Meteorol., 107, 678
255-278. 679
Stephens, G.L., J. Li, M. Wild, C.A. Clayson, N. Loeb, S. Kato, T. L'Ecuyer, P.W. 680
Stackhouse Jr., M. Lebsock, and T. Andrews (2012), An update on Earth's energy 681
balance in light of the latest global observations, Nature Geosci., 5, 691–696. 682
Stjern, C.W., J.E. Kristjansson, and A.W. Hansen (2009), Global dimming and global 683
brightening: an analysis of surface radiation and cloud cover data in northern Europe, 684
Int. J. Climatol., 29, 643–653. 685
Toledano, C., V.E. Cachorro, A. Berjon, A.M. de Frutos, M. Sorribas, B. de la Morena, 686
and P. Goloub (2007), Aerosol optical depth and Ångström exponent climatology at 687
El Arenosillo AERONET site (Huelva, Spain), Q. J. R. Meterol. Soc., 133, 795-807. 688
Trenberth, K.E., J.T. Fasullo, J. Kiehl (2009), Earth's global energy budget, B. Am. 689
32
Valenzuela, A., F.J. Olmo, H. Lyamani, M. Antón, A. Quirantes, L. and Alados-691
Arboledas (2012), Aerosol radiative forcing during African desert dust events (2005-692
2010) over Southeastern Spain, Atmos. Chem. Phys., 12, 10331–10351, 693
doi:10.5194/acp-12-10331-2012. 694
Wang, Y.W. and Y.H. Yang (2014), China's dimming and brightening: evidence, causes 695
and hydrological implications, Ann. Geophys., 32, 41-55, doi:10.5194/angeo-32-41-696
2014, 2014. 697
Wielicki, B.A., B.R. Barkstrom, E.F. Harrison, R.B. Lee III, G.L. Smith, and J.E. 698
Cooper (1996), Clouds and the Earth's Radiant Energy System (CERES): An Earth 699
Observing System Experiment, B. Am. Meteorol. Soc., 77, 853-868. 700
Wild, M., H. Gilgen, A. Roesch, A. Ohmura, C.N. Long, E.G. Dutton, B. Forgan, A. 701
Kallis, V. Russak, A. Tsvetkov (2005), From dimming to brightening: decadal 702
changes in surface solar radiation, Science, 308, 847–850. 703
Wild, M. (2009), Global dimming and brightening: a review, J. Geophys. Res. 114, 704
D00D16. http://dx.doi.org/10.1029/2008JD011470. 705
Wild, M. (2012), Enlightening global dimming and brightening. Bull. Am. Meteorol. 706
Soc., 93, 27–37, doi:10.1175/BAMS-D-11-00074.1. 707
Wild, M., D. Folini, C. Schaer, N. Loeb, E.G. Dutton, G. Koning-Langlo (2013), The 708
global energy balance from a surface perspective. Clim. Dynam., 40, 3107-3134 , 709
http://dx.doi.org/10.1007/s00382-012-1569-8. 710
Willmott, C. J. (1982), Some Comments on the Evaluation of Model Performance, Bull. 711
Am. Meteorol. Soc., 63, 1309–1313. 712
Yamamoto, J.H. (2000), An alternative measure of the reliability of ordinary Kriging 713
33
Yang, W.J., K. Yang, J. Qin, C.C.K. Cheng, and J. He (2011), Solar radiation trend 715
across China in recent decades: a revisit with quality-controlled data, Atmos. Chem. 716
Phys., 11, 393-406, doi:10.5194/acp-11-393-2011. 717
Yoon, J., W. von Hoyningen-Huene, A.A. Kokhanovsky, M. Vountas, and J. Burrows 718
(2012), Trend analysis of aerosol optical thickness and Ångström exponent derived 719
from the global AERONET spectral observations, Atmos. Meas. Tech., 5, 1271-1299, 720
doi:10.5194/amt-5-1271-2012. 721
722
723
34 Figure Captions
725
Figure 1. Surface shortwave radiation trends between 2003 and 2012 (in W m-2 per 726
decade) using CERES (Clouds and the Earth's Radiant Energy System)-EBAF 727
(Energy Balanced And Filled)-Surface data (Kato et al., 2013). 728
Figure 2. Surface shortwave radiation trends (in W m-2 per decade) between 2003 and 729
2012 over the Iberian Peninsula using surface -based (a) and CERES (Clouds and 730
the Earth's Radiant Energy System)-EBAF (Energy Balanced And Filled)-Surface 731
(b) data. Circles highlight the areas with a statistically significance level over 90% 732
and symbols point out the sites where the trends were calculated (squares are 733
Barcelona, Valladolid, and Évora sites, while triangles are the rest of the stations). 734
Figure 3. Monthly evolution of radiative effects of aerosols, ARE (a), clouds, CRE (b), 735
and clouds and aerosols, CARE (c), at the sites Barcelona (blue diamonds), 736
Valladolid (black triangles), and Évora (red circles). 737
Figure 4. Relative frequency of aerosol (ARE), cloud (CRE), and cloud and aerosol 738
(CARE) radiative effects occurrence for the three sites analyzed in this study. 739
Figure 5. Monthly evolution of cloud radiative effect (CRE) using the method presented 740
in this article (CRESB, solid symbols) and the estimations given by CERES (Clouds 741
and the Earth's Radiant Energy System)-EBAF (Energy Balanced And Filled)-742
Surface (CRECERES, open squares). 743
Figure 6. Scatter plot of cloud radiative effect monthly anomalies by the estimations 744
given by CERES (Clouds and the Earth's Radiant Energy System)-EBAF 745
(Energy Balanced And Filled)-Surface (CRECERES) and by the method presented in 746
this article (CRESB). The solid line points out the linear fit, and the dashed line is 747
35
absolute bias error), rmse (root mean square error), iagree (index of agreement) 749
[Willmott, 1982], and R (correlation coefficient). 750
36 Figures + Figure Captions
752
753
Figure 1 754
755
756
Figure 1. Surface shortwave radiation trends between 2003 and 2012 (in W m-2 per 757
decade) using CERES (Clouds and the Earth's Radiant Energy System)-EBAF 758
(Energy Balanced And Filled)-Surface data (Kato et al., 2013). 759
37 Figure 2
761
762
763
Figure 2. Surface shortwave radiation trends (in W m-2 per decade) between 2003 and 764
2012 over the Iberian Peninsula using surface-based (a) and CERES (Clouds and the 765
Earth's Radiant Energy System)-EBAF (Energy Balanced And Filled)-Surface (b) data. 766
Circles highlight the areas with a statistically significance level over 90% and symbols 767
point out the sites where the trends were calculated (squares are Barcelona, Valladolid, 768
and Évora sites, while triangles are the rest of the stations). 769
38 Figure 3
771
772
773
Figure 3. Monthly evolution of radiative effects of aerosols, ARE (a), clouds, CRE (b), 774
and clouds and aerosols, CARE (c), at the sites Barcelona (blue diamonds), Valladolid 775
(black triangles), and Évora (red circles). 776
39 Figure 4
778
779
780
Figure 4. Relative frequency of aerosol (ARE), cloud (CRE), and cloud and aerosol 781
(CARE) radiative effects occurrence for the three sites analyzed in this study. 782
40 Figure 5
784
785
786
Figure 5. Monthly evolution of cloud radiative effect (CRE) using the method 787
presented in this article (CRESB, solid symbols) and the estimations given by CERES 788
(Clouds and the Earth's Radiant Energy System)-EBAF (Energy Balanced And Filled)-789
Surface (CRECERES, open squares). 790
41 Figure 6
792
793
794
Figure 6. Scatter plot of cloud radiative effect monthly anomalies by the estimations 795
given by CERES (Clouds and the Earth's Radiant Energy System)-EBAF 796
(Energy Balanced And Filled)-Surface (CRECERES) and by the method presented in this 797
article (CRESB). The solid line points out the linear fit, and the dashed line is the 1:1 798
line. Legend: n (number of data), mbe (mean bias error), mabe (mean absolute bias 799
error), rmse (root mean square error), iagree (index of agreement) [Willmott, 1982], and R 800
(correlation coefficient). 801
802