Oximetry as at-Home Alternative for Sleep
Apnea Diagnosing
Gonzalo C. Gutiérrez-Tobal, Daniel Álvarez, Fernando Vaquerizo-Villar,
Verónica Barroso-García, Adrián Martín-Montero, Andrea Crespo,
Félix del Campo, and Roberto Hornero
Abstract
This study focuses on the at-home Sleep apnea-hypopnea syndrome (SAHS) severity estimation. Three percent oxygen desaturation index ðODI3Þ from nocturnal pulse-oximetry has been commonly evaluated as simpli-fied alternative to polysomnography (PSG), the standard in-hospital diagnostic test. However, ODI3 has shown limited ability to detect SAHS as it only sums up information from desaturation events. Other physiological signs of SAHS can be found in respiratory and cardiac signals, providing additional helpful data to establish SAHS and its severity. Pulse rate variability time series (PRV), also derived from nocturnal oximetry, is consid-ered a surrogate for heart rate variability, which provides both cardiac and respiratory information. In this study, 200 oximetric recordings obtained at patients home were involved, divided into training (50%) and test (50%) groups. ODI3 and PRV were obtained from them, the latter being characterized by the extraction of statistical features in time domain, as well as the spectral entropy from the commonly used very low (0–0.04 Hz.), low (0.04–0.15 Hz.), and high (0.15–0.4 Hz.) frequency bands. The ODI3 and PRV features were joined in a multi-layer perceptron artificial neural network (MLP), trained to estimate the apnea-hypopnea index (AHI), which is the PSG-derived parameter used to diagnose SAHS. Our results showed that single ODI3 rightly assigned 62.0% of the subjects from the test group into one out the four SAHS severity degrees, reaching 0.470 Cohens kappa, and 0.840 intra-class correlation
coefficient (ICC) with the actual AHI (accuracies of 90.0, 88.0 and 82.0% in the increasing AHI cutoffs used to define SAHS severity). By contrast, our MLP model rightly assigned 75.0% of the subjects into their corre-sponding SAHS severity level, reaching 0.614 j and 0.904 ICC (accuracies of 93.0, 88.0 and 90.0%). These results suggest that SAHS diagnosis could be accurately conducted at-patients home by combiningODI3and PRV from nocturnal oximetry
Keywords
Sleep apnea
Pulse rate variability Oximetry Artificial neural networkHome diagnosis1
Introduction
The sleep apnea-hypopnea syndrome (SAHS) is a chronic and prevalent disease in which patients show recurrent epi-sodes of respiratory pauses (apneas) and airflow reductions (hypopneas) while sleeping [1]. Apneic events boost a number of undesirable physiological processes that lead to a harmful impact both in health and quality of life of affected people [2].
The number of apneas and hypopneas per hour of sleep, i.e., the apnea-hypopnea index (AHI), is the parameter used to determine the presence and severity of SAHS [1, 3]. Clinical specialists estimate AHI by examining multiple physiological signals recorded during in-lab nocturnal polysomnography (PSG), which is the standard diagnostic test [3]. However, simplifying SAHS diagnosis has become a major issue for biomedical engineering due to limitations related to the PSG complexity, costs, and demand of time from physicians [3]. These drawbacks, together with the high prevalence of SAHS [3], imply a limited availability of specialized facilities, which derives in long waiting lists and delays the access to both diagnosis and treatment [3]. G. C. Gutiérrez-Tobal (&)D.ÁlvarezF. Vaquerizo-Villar
V. Barroso-GarcíaA. Martín-MonteroA. CrespoF. del CampoR. Hornero
Biomedical Engineering Group, Universidad de Valladolid, Valladolid, Spain
e-mail: [email protected]; [email protected] URL: http://www.gib.tel.uva.es/
D.ÁlvarezA. CrespoF. del Campo
Sleep Unit, Hospital Universitario Rio Hortega, Valladolid, Spain
©Springer Nature Singapore Pte Ltd. 2019
L. Lhotska et al. (eds.),World Congress on Medical Physics and Biomedical Engineering 2018, IFMBE Proceedings 68/2, https://doi.org/10.1007/978-981-10-9038-7_39
In past years, a wide range of simpler diagnostic alter-natives have been evaluated. In contrast to 32 signals recorded during PSG, most of the alternatives focused on analyzing a single one [4, 5]. Nocturnal pulse-oximetry (NPO) is a simple test often used for this purpose [6,7]. It only requires a sensor on afinger to record the blood oxygen saturation ðSpO2Þ. This signal monitors the oxygen in the hemoglobin of the blood, which falls due to apneic events [1].
Promising results have been derived from the investiga-tion of theSpO2 signal, which include the use of automatic signal processing techniques and the assessment of clinically-used oxygen desaturation indexes (ODI) [6, 7]. However, recent studies have reported substantial redun-dancy between the 3% ODI ðODI3Þ, and the remaining information usually extracted from SpO2 [8]. Moreover, SAHS is known to change the normal profile of the cardiac signals by the recurrence of bradycardia/tachycardia patterns [4]. Particularly, a recent work from our group reported that spectral entropy (SE) from VLF (0–0.04 Hz), LF (0.04– 0.15 Hz), and HF (0.15–0.40 Hz) bands of the heart rate variability signal (HRV) provides more useful information than the corresponding power-based traditional features [9]. This kind of information is not available when usingSpO2 signal alone. Hence, we hypothesize that the usefulness of ODI3 to simplify SAHS diagnosis test can be improved adding cardiac data of interest.
In this regard, NPO sensor is not only able to recordSpO2 but pulse rate too. Several studies have evaluated the use of cardiac information obtained from the pulse rate variability signal (PRV) as a surrogate of HRV [10,11]. These works showed the usefulness of PRV in pediatric SAHS context. However, they did not evaluate adult subjects, they focused on the analysis of the classic spectral power-based HRV parameters [10], or only used time-domain PRV information to detect specific apneic related events [11]. Additionally, the signals used in these works were acquired in a labora-tory, i.e., under supervised conditions.
In accordance with the above mentioned, we aim at evaluating the joint usefulness ofODI3fromSpO2 together with time and frequency domain features obtained from PRV. The extraction ofSEfrom VLF, LF, and HF of PRV spectrum is proposed. Additionally, first to fourth order statistics (Mt1–Mt4) are also obtained with the purpose of characterizing the whole PRV time series. Moreover, in contrast to previous studies, both PSG and NPO are con-ducted at patients home. Hence, our proposal can be eval-uated under those conditions which best reflect the usual sleep environment and behavior of patients. The eight fea-tures extracted from NPO (SpO2and PRV) are subsequently
used as the only source of information to train a multi-layer perceptron (MLP) artificial neural network with ability to automatically estimate AHI. We chose MLP in view of its success in previous studies focused on automatic AHI esti-mation [12, 13]. The diagnostic performance of this esti-mated AHI is compared withODI3to assess whether the use of PRV information can improve the ability of oximetry to detect SAHS and its severity.
2
Subjects and Signals
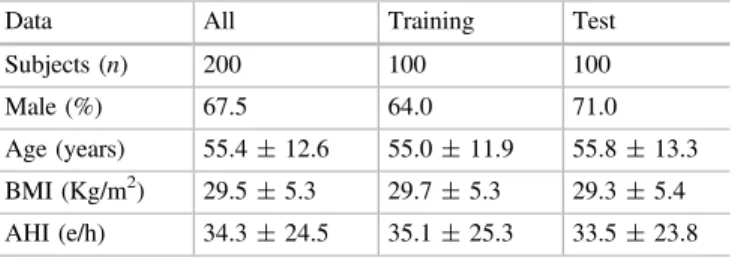
The study involved 200 adult subjects (67.5% males). All of them where referred to the sleep unit of the Hospital Universitario Rio Hortega in Valladolid (Spain) due to clinical suspicious of SAHS. The subjects gave their informed consent to participate in the study and the Ethics Committee of the Hospital approved the protocol. A physi-cian examined at-home PSG (Embletta MPR ST+ , Embla Systems, USA) tests from all patients to compute an AHI for each of them. Apneas and hypopneas were scored following the rules of the American Academy of Sleep Medicine (AASM) [1]. According to the computed AHI, subjects were diagnosed in four SAHS-severity degrees: 12 no-SAHS (AHI < 5 e/h), 46 mild (5 AHI < 15 e/h), 46 moderate (15 AHI < 30 e/h), and 96 severe (AHI 30 e/h). The sample was randomly divided into a training (50%) and a test (50%) set, with the two of them having the same number of subjects from each SAHS-severity degree. Table1shows the demographic and clinical data of the subjects under study for the whole group and the training and test sets.
A NPO (WristOxTM2 , Nonin, USA) was conducted at the same time that each PSG.SpO2 and PRV were obtained at sampling rates of 1 Hz and 3 Hz, respectively. Artifacts were removed from both of them. InSpO2, zero values and differences between consecutive samples 4% were removed and substituted by interpolated data [14]. In PRV, values <0.33 s or >1.5 s, as well as differences in consecu-tive PRV values >0.66, were considered arrhythmia-related artifacts [4]. All of them were also removed and substituted by interpolated samples [4].
Table 1 Demographic and clinical data of the subjects under study
Data All Training Test
Subjects (n) 200 100 100
Male (%) 67.5 64.0 71.0
Age (years) 55.4±12.6 55.0±11.9 55.8±13.3
BMI (Kg/m2) 29.5±5.3 29.7±5.3 29.3±5.4
3
Methodology
3.1
SpO
2and PRV Features
One feature was obtained from the SpO2 signal ðODI3Þ whereas 7 more were extracted from PRV: first- to fourth order statistical momentsMt1–Mt4 in time domain and the spectral entropy from the VLF ðSEVLFÞ, LFðSELFÞ, and HFðSEHFÞfrequency bands. Next we briefly describe each of them:
• ODI3is a clinical parameter widely used to help in SAHS diagnosis. It computes the number of drops from the SpO2 signal baseline 3%, divided by the number of hours of the recording [14].
• Mt1–Mt4 are the well-known mean ðMt1Þ, standard deviation ðMt2Þ, skewness ðMt3Þ, and kurtosis ðMt4Þ, which characterize the central tendency, dispersion, asymmetry, and peakedness of a time series, respectively. They have shown its utility to analyze oximetric signals in the past [12].
• SEmeasures theflatness of the spectrum of a biomedical signal [9]. Higher SE values (closer to 1) are reached when the spectral power is spreaded throughout fre-quencies. By contrast,SEvalues closer to 0 are reached in the presence of spectrums where power is condensed [9].SEcan be computed by applying Shannon’s entropy to a normalized version of the power spectral density in a frequency range [9].
These eight features were used to characterize the recordings of each subject under study and train (and test) a MLP model with ability to automatically estimate AHI.
3.2
Multi-layer Perceptron Artificial Neural
Network
MLP is a supervised learning algorithm typically arranged in three fully connected layers (input, hidden, and output) [13]. The layers are formed by neurons, each of them character-ized by an activation functiongð Þand their connections (or weights) to neurons from other layers (wi;j, being i and j different layers). In this study, the input layer has eight neurons due to the number of the extracted features. More-over, according to the AHI regression task, a single unit with a linear activation function was used in the output layer. Linear activation functions were also used for each neuron in the hidden layerðNHÞ. The number of hidden neuronsfinally arranged is a tuning parameter optimized using the training set [13]. In order to prevent overfitting, a regularization parameter (a) was introduced during the MLP training
process [13]. It was also optimized along with NH. All weightswi;j were optimized using the sum of squares error function minimization criterion by means of the scaled conjugate gradient algorithm [13].
3.3
Statistical Analysis
Intra-class correlation coefficient (ICC) was used to measure the concordance between our estimation and the actual AHI. Cohen’s kappa ðjÞ assessed the diagnostic ability of the estimated AHI in the four class classification task. Esti-mated AHI was also evaluated in the three AHI thresholds that define the severity groups to further assess its poten-tiality as screening tool. Sensitivity (Se), specificity (Sp), and accuracy (Acc) were used for this purpose. Regarding the optimization of theNHandaparameters in the MLP model, a leave-one-out cross-validation (loo-cv) procedure was applied only in the training test. The whole training set, without the loo-cv process, was used to obtain thefinal MLP model.
4
Results
4.1
MLP Optimization and Training (Training
Set)
Figure1 shows the optimization of NH and a during the loo-cv procedure.The pairNH¼45anda¼0:3reached the highest j (0.597). These values were chosen as optimum, and used to train the model with the whole training set.
4.2
Diagnostic Ability of Our Proposal (Test Set)
Fig. 2 Bland-Altman plot facing estimated and actual AHI Fig. 1 NH andaoptimization process with loo-cv
Table 2 Confusion matrices forODI3and the AHI estimation derived from our MLP model (Test set). Rows correspond to the actual SAHS severity degree
no-SAHS Mild Moderate Severe
ODI3
no-SAHS 6 0 0 0
Mild 9 13 1 0
Moderate 0 10 12 1
Severe 1 0 16 31
Estimated AHI
no-SAHS 3 3 0 0
Mild 2 14 6 1
Moderate 1 3 12 7
Severe 1 0 1 46
Table 3 Evaluation of AHI thresholds (5, 15, and 30 e/h) for both ODI3and our AHI estimation from MLP (Test set)
5 e/h 15 e/h 30 e/h
ODI3
Se. (%) 89.4 84.5 64.6
Sp. (%) 100.0 96.6 98.1
Acc. (%) 90.0 88.0 82.0
Estimated AHI
Se. (%) 95.7 92.9 95.8
Sp. (%) 50.0 75.9 84.6
5
Discussion and Conclusions
In this study, we obtained an MLP model with ability to estimate AHI from oximetric recordings acquired at patient’s home. This model was trained withODI3fromSpO2as well as 7 features from PRV that reflect cardiac information not showed by the former. Our proposal reached very high agreement with actual AHI ðICC¼0:904Þ and diagnostic ability (j¼0:614; 93.0%, 88.0%, 90.0% Acc for 5, 15, and 30 e/h, respectively), outperforming the single use of the widespread clinical parameterODI3 at each statistics.
Three studies have been found evaluating the diagnostic usefulness of at-home NPO. All of them only analyzed the SpO2 signal. Olson et al. conducted a univariate analysis through delta index which showed moderate Se/Sp pairs in the three AHI thresholds (82.7%/54.2%, 88.5%/39.6%, 92.6%/34.1%, 5 e/h, 15 e/h, and 30 e/h, respectively) [15]. Chung et al. directly assessed the usefulness of at-home ODI3, reaching 87.0, 84.0, 93.7% Acc for the same AHI thresholds [16]. Finally, Schlotthauer et al. estimatedODI3 by means of the empirical mode decomposition, and its diagnostic assessment for AHI = 15 e/h reached 83.8% Se and 85.5% Sp [17]. Our proposal achieved an overall higher diagnostic ability than those reported in these works.
Notwithstanding these considerations, some limitations need to be pointed out. In accordance with the high preva-lence of SAHS, and the pre-test symptoms referred by the patients involved in the study, the number of no-SAHS subjects is low comparing to the other SAHS-severity groups. A higher proportion of them would enhance the soundness of our results. This issue will be addressed in future studies. In addition, although the features extracted from the PRV signal have shown their usefulness, another future goal is the assessment of the information extracted by means of different analytical approaches.
Summarizing, our automatic estimation of the AHI has shown very high diagnostic ability using a MLP model only trained with at-home oximetric recordings. It outperformed the state-of-the-art studies found. Adding PRV features to ODI3 enhanced the performance of the oximetric index alone. These results suggest that the information contained in the PRV signal complementODI3, leading to an accurate at-home diagnostic alternative.
Acknowledgements This study was partially funded by the projects TEC2014-53196-R and RTC-2015-3446-1 of‘Ministerio de Economía
y Competitividad and FEDER’, and by VA037U16 of the‘Junta de Castilla y León’and FEDER.
Conflict of Interest The authors declare no conflict of interest.
References
1. Berry, R. B., et al.: Rules for scoring respiratory events in sleep: update of the 2007 AASM manual for the scoring of sleep and associated events. J. Clin. Sleep. Med., 8, 597, (2012).
2. Lopez-Jimenez, F. et al.: Obstructive sleep apnea: implications for cardiac and vascular disease. Chest, 133, 793–804 (2008). 3. Flemons, W. W., et al.: Home diagnosis of sleep apnea: a
systematic review of the literature. Chest, 124, 1543–79 (2003). 4. Penzel, T., et al.: Comparison of detrendedfluctuation analysis and
spectral analysis for heart rate variability in sleep and sleep apnea. IEEE Trans. Biomed. Eng., 50, 1143–51 (2003).
5. Gutiérrez-Tobal, G. C., et al.: Utility of adaboost to detect sleep apnea-hypopnea syndrome from single-channel airflow. IEEE Trans. Biomed. Eng., 63, 636–46 (2016).
6. Bloch, K. E.: Getting the most out of nocturnal pulse oximetry. Chest, 124, 1628–30, (2003).
7. Sánchez-Morillo, D., et al.: Novel multiclass classification for home-based diagnosis of sleep apnea hypopnea syndrome. Expert Syst. Appl., 41, 1654–62 (2014).
8. Hornero, R., et al.: Nocturnal Oximetry based Evaluation of Habitually Snoring Children. Am. J. Respir. Crit. Care Med., 196, 1591–98 (2017).
9. Gutiérrez-Tobal, et al.: Assessment of time and frequency domain entropies to detect sleep apnoea in heart rate variability recordings from men and women. Entropy, 17, 123–41 (2015).
10. Garde, A., et al.: Development of a screening tool for sleep disordered breathing in children using the phone Oximeter. PloS ONE, 9, e112959 (2014).
11. Lázaro, J., et al.: Pulse rate variability analysis for discrimination of sleep-apnea-related decreases in the amplitude fluctuations of pulse photoplethysmographic signal in children. IEEE J. Biomed. Health. Inform., 18, 240–46, (2014).
12. Marcos, J. V., et al.: Automated prediction of the apnea-hypopnea index from nocturnal oximetry recordings. IEEE Trans. Biomed. Eng., 59, 141–49 (2012).
13. Gutiérrez-Tobal, G. C., et al.: Pattern recognition in airflow recordings to assist in the sleep apnoeahypopnoea syndrome diagnosis. Med. Biol. Eng. Comput., 51, 1367–80 (2013). 14. Magalang, U. J., et al.: Prediction of the apnea-hypopnea index
from overnight pulse oximetry. Chest, 124, 1694–1701 (2003). 15. Olson, L. G., et al.: Prediction of sleep-disordered breathing by
unattended overnight oximetry. J. Sleep. Res., 8, 51–55 (1999). 16. Chung, F., et al.: Oxygen desaturation index from nocturnal
oximetry: a sensitive and specific tool to detect sleep-disordered breathing in surgical patients. Anesth. Analg., 114, 993–1000 (2012).