Simple high performance liquid chromatography : new data on alfa tocopherol content / C Barbas [et al ]
8
0
0
Texto completo
(2) Journal of Chromatography A, 919 (2001) 305–311 www.elsevier.com / locate / chroma. Simple high-performance liquid chromatography method for a-tocopherol measurement in Rosmarinus officinalis leaves New data on a-tocopherol content q ´ ´ J. Torre, M.P. Lorenzo, M.P. Martınez-Alcazar, C. Barbas* ´ Facultad C.C. Experimentales y Tecnicas , Universidad San Pablo-CEU, 28668 Boadilla del Monte ( Madrid), Spain Received 20 November 2000; received in revised form 22 March 2001; accepted 30 March 2001. Abstract A simple HPLC method for vitamin E (a-tocopherol) measurement in the leaves of Rosmarinus officinalis has been developed and validated. It has enabled new data for a-tocopherol content to be established. The leaves, recently harvested, were dried in a microwave oven and crushed; then, a-tocopherol was directly extracted from portions of ground material with acetone, by probe sonication. After centrifugation the acetonic extract was analysed by HPLC with ergocalciferol (vitamin D 2 ) added as internal standard and a gradient elution with a Nucleosil C 18 column at 358C. Validation parameters of the method can be considered adequate. For standards: linearity is r50.999, recovery is 10062%, intra-assay precision has RSD563% and inter-assay precision has RSD566%. For samples: linearity is r50.99, recovery: 9367%, intra-assay precision has RSD564% and inter-assay precision has RSD567%. 2001 Elsevier Science B.V. All rights reserved. Keywords: Plant materials; Rosmarinus officinalis; Tocopherols; Vitamins. 1. Introduction In the last 15 years, special attention has been paid to the use of natural antioxidants because of the worldwide trend to avoid or minimise the use of synthetic food additives. The interest in natural antioxidants continues to grow because they are presumed to be safe and furthermore, evidence is accumulating that they have anticarcinogenic effects. q Presented at the 29th Scientific Meeting of the Spanish Group of Chromatography and Related Techniques, Alcala´ de Henares (Madrid), 12–14 July 2000. *Corresponding author. Fax: 134-91-3510-475. E-mail address: [email protected] (C. Barbas).. and inhibit biologically harmful oxidation reactions in the body [1]. Vitamin E is a primary antioxidant. Primary antioxidants interrupt autoxidation by reacting with lipid radicals as electron donors and converting the free radicals into more stable species. Natural vitamin E (methyl-substituted hydroxychromans with a phytyl side chain) is composed of two homologous series: the tocopherol with a saturated chain and tocotrienol with an unsaturated chain. The chloroplasts of plants contain significant amounts of atocopherol, which is the most biologically active isomer. A variety of methods have been described for determination of a-tocopherol in vegetables. Formers methods for measurement of tocopherols in plants. 0021-9673 / 01 / $ – see front matter 2001 Elsevier Science B.V. All rights reserved. PII: S0021-9673( 01 )00808-1.
(3) 306. J. Torre et al. / J. Chromatogr. A 919 (2001) 305–311. employ colorimetry [2,3], but direct analysis of leaf tocopherols in the extract is practically impossible. Nowadays, different gas chromatography (GC) and high-performance liquid chromatography (HPLC) methods, as well as different extraction procedures, have been described for the measurement of atocopherol and related compounds in natural products, but most of them are applied to oils and fats [4–8] and few to vegetables. Frequently, quantification to evaluate the antioxidant activity is performed in the methanolic or n-hexane extractable fraction, not in the whole leaves. Saponification and reversed-phase HPLC with fluorescence [9] or UV detection has been used [10–12] in several vegetables and fruits. Saponification and normal-phase HPLC with fluorescence detection was employed in broccoli [13]. Saponification and normal-phase HPLC with fluorescence detection was employed in six different edible plant species [14], while thin-layer chromatography (TLC) was the choice to purify the methanolic extracts in leaves of Mulberry following normal-phase HPLC with fluorescence detection [15]. Tocopherol content in waxy and fatty materials from rice bran were measured after supercritical carbon dioxide extraction by reversed-phase HPLC with fluorescence detection [16]. The classical procedure of Bligh and Dyer [17] has also been applied to extract the tocopherol of spinach samples [18] to determine their contents using HPLC. Although recoveries ranging from 90.2 to 98.3% were reported, the procedure needs the evaporation of chloroform which is highly carcinogenic. On the other hand, with the mobile phase described in that work (methanol–water, 95:5, v / v), the UV–Vis scan of a-tocopherol peak in rosemary shows a compound coeluting at the same retention time with absorbance around 400 nm with the characteristic profile of photopigments. Column chromatography on Silicagel, as clean up step, followed by GC analysis with flame ionisation or MS detectors has also been employed for measuring a-tocopherol content in 15 plant species [19,20]. Saponification is time consuming and frequently produces loss of analyte due to too exhaustive processes on an easily oxidisable compound resulting in recoveries of around 80%. Meanwhile, direct extraction with methanol from extracts of Rosmarinus officinalis gives only a 54% recovery [21].. Crude biological extracts containing a-tocopherol usually contain a large number of additional nonpolar compounds such as phospholipids, proteins and other membrane components. Furthermore, in our experience working with animal tissues and diets [22,23], it has been shown that the chromatographic system is able to separate tocopherols from lipids without prior saponification or other clean up procedures when using small sample amounts. Therefore, the aim of the present work was the optimisation of the extraction conditions of atocopherol from green leafy vegetables, taking Rosmarinus officinalis as the plant model, and the development and validation of a HPLC method with UV detection for the rapid measurement in this plant of the most active form of vitamin E. It was done without any other sample pre-treatment, after a simple extraction, more than filtration. Aspects such as drying and stability of stored samples will also be studied. Rosemary was chosen since it is known to have the highest antioxidant activity among plants of labiatae family [24]. This method will allow us to carry out a search for a species of plant that could represent an interesting source of a-tocopherol for different purposes, such as stabilisation of food products or cosmetic and pharmaceutical applications.. 2. Materials and methods. 2.1. Instrumentation A Beckman HPLC system equipped with a 126 pump, an automatic injector (507e), a 168 diode array detector and a Gold System data processor were used. The chromatographic analysis was performed on a 5 mm particle C 18 Nucleosil 120 column (2530.46 cm) kept in a Bio-Rad column oven at 358C.. 2.2. Reagents All solvents were HPLC grade quality purchased from Scharlau (Barcelona, Spain). a-Tocopherol was from Fluka (Madrid, Spain) and ergocalciferol was from Merck (Madrid, Spain)..
(4) J. Torre et al. / J. Chromatogr. A 919 (2001) 305–311. 2.3. Plant material Plants were grown in the University gardens. Leaves were collected, softly cleaned with filter paper and dried in different ways. To compare different procedures or during validation, a sample pool was collected and homogenised.. 2.4. Drying procedures Replicates of approximately 1 g of fresh rosemary leaves were dried following three procedures, until a constant mass was reached using: (a) An electric oven in the dark at 508C with air flow. [The constant mass was reached in 3 h (|40% vs. initial mass)]. (b) A microwave oven at 900 W was employed to assist dehydration. (The same loss of mass as above was reached in 1 min). (c) A sample of the same leaves was immediately frozen in liquid nitrogen and lyophilised for 12 h. (Final mass was also |40% vs. initial mass).. 2.5. Extraction procedure In order to determine the most convenient method for tocopherol extraction, several procedures, described below, were assayed. In all cases triplicates of 0.250 g of ground material were placed in centrifuge tubes with the adequate volume of extraction solvent added. Only in the last case, for saponification, 0.5 g was used. Extraction was performed by probe sonication for 1 min and the resulting suspension was centrifuged at 2000 g for 3 min. In the procedures detailed, the extraction was repeated several times. The collected supernatants were filtered through a 0.45-mm pore size nylon filter. When the solvents were other than acetone or methanol, the liquid was evaporated to dryness under nitrogen and the residue redissolved in acetone or methanol prior to their injection in the chromatographic system. The extraction solvents and volumes employed in each case were: a simple extraction with 3.8 ml of acetone, a two-step extraction with the same volume of acetone: 1.8 ml plus 2 ml, a fourfold extraction with 1.25 ml of methanol each. The same procedure as above but using methanol containing 0.05 mg / ml citric acid, a simple extraction with 2 ml of ethyl. 307. acetate, and, finally, a simple extraction with 2 ml of ethyl acetate–acetic acid (80:20, v / v). Another more complex method used a previous extraction with 3 ml of acetone, discarding the extract, and then the centrifuged sample was re-extracted using 3 ml 1 M HCl, 1 ml EtOH–MeOH (1:1, v / v) and 3 ml of hexane in duplicate. A similar method employed a previous extraction with 3 ml acetone, elimination of the extract, following a double extraction using 3 ml hexane. In the last case, for saponification, to 0.5 g of dried ground leaves 2.5 ml of ethanol, 2.5 ml of KOH (1 g / ml in MeOH) plus 0.025 g of ascorbic acid were added and the mixture was kept under nitrogen for 30 min with occasional stirring. Following saponification, the sample was extracted with 3 ml hexane.. 2.6. Final quantification procedure. 2.6.1. Stock and working standards Individual stock solutions of a-tocopherol as external standard, and ergocalciferol as internal standard, were prepared at a concentration of 8.5 mg / ml and 5.2 mg / ml in ethanol and acetone, respectively. These solutions were stored in aluminium foil-covered containers and kept at 2208C. On the day of the assay, the a-tocopherol solution was diluted 1:250 (v / v) in ethanol, and the concentration was determined spectrophotometrically at 295 nm for a-tocopherol (e 53058 l mol 21 cm 21 ). Meanwhile, both stock solutions were diluted 1:25 (v / v) with acetone and a mixture of 300 ml of a-tocopherol and 200 ml of ergocalciferol, made up to 4.000 ml in glass tubes was used as working standard. These solutions were probe sonicated and centrifuged to follow the same procedure as with the samples.. 2.6.2. Sample treatment Approximately 5 g of fresh leaves was dried in microwave oven at 900 W for 1 min. After grinding, 250 mg of the desiccated sample was weighed, and 200 ml of the internal standard and 3.800 ml of acetone were added. Samples were extracted by probe sonication for 1 min, centrifuged and filtered through 0.45-mm nylon filters to the injection vials..
(5) 308. J. Torre et al. / J. Chromatogr. A 919 (2001) 305–311. 2.7. Chromatographic analysis Purified-for-HPLC water (Milli-Q, Waters) was employed as mobile phase A and methanol–acetonitrile (30:70, v / v) as mobile phase B with 0.1% (v / v) acetic acid added. From t50 to t523 min the eluent composition varied in a linear gradient from 85% B to 100% B, at a flow-rate of 2 ml / min. At t523 min, when analytes were eluted and the pressure was already lower, the flow-rate was increased to 3 ml / min for cleaning the column of less polar compounds. At t530 min the system returned to the initial conditions until t531 min, which marks the end of run. Peak identification was performed with retention times, as compared with standards, and confirmed with characteristic spectra using the photodiode array detector. This procedure also confirmed the purity of the peak.. therefore, 50% of the endogenous tocopherol present in a normal sample, and increasing it by adding working standard solution from 0 to 0.03 mg / ml. Total volumes and proportions were equalled, and samples were processed as described above, including the corresponding standards for quantification.. 2.9. Stability of samples The stability of a-tocopherol in different stages was assayed. One portion of fresh rosemary leaves was kept in a plastic container in the refrigerator at 48C, another portion was dried with microwaves and kept in the refrigerator and a third portion was extracted following the proposed method and kept in closed vials in the refrigerator at 48C. These samples were analysed for a-tocopherol on days 0, 1, 2, 6, 13, 20 and 30 using standards prepared the day of the assay.. 2.8. Validation assay 3. Results and discussion Standards linearity was verified by the analysis of duplicate standards at five points in the range of 0.014 to 0.045 mg / ml of a-tocopherol in order to cover the expected range of concentrations in samples. To each tube 200 ml of ergocalciferol as internal standard was added and volume was made up to 4.000 ml. Solutions were processed as described above for working standards. Sample linearity was tested in duplicates of 125 mg of homogenised dried sample to which 0, 75, 150, 225 and 300 ml of a-tocopherol standard 0.39 mg / ml were added. Each tube contained 200 ml of the internal standard and volumes were brought to 4000 ml with acetone. Chromatographic analysis was performed in triplicate. Intra- and inter-assay instrumental precision were determined by the analysis of the same sample and standard 10 times, in 1 day (intra) and in different days (inter). Intra- and inter-assay precision of the method were determined by processing two series of 10 samples from 250 mg of ground material, in 1 day (intra) and in different days (inter). Standards for quantification were prepared as described previously and treated simultaneously. For recovery evaluation, samples were prepared from 50% of the amount of rosemary (125 mg) and,. The first step in sample treatment was drying to avoid the influence on the measurement of different water content in leaves. In order to select the most adequate drying procedure: (a) electric oven treated samples, (b) microwave oven treated samples and (c) lyophilized samples were analysed. Results of these drying methods and those obtained from a fresh sample with known water content were compared. Results, expressed in terms of percentage respect to the chosen method (microwave oven, which was assigned 100% recovery), were: 51% in the electric oven at 508C for 3 h, and 59% with lyophilisation for 12 h. These results deserve a short discussion. Surprisingly, the fresh sample hardly allows the vitamin extraction and no tocopherol could be measured. With regard to the other procedures, smaller recovery was obtained with the lyophilisation method than with the microwaves. The opposite trend would be expected due to a higher stability of the vitamin at low temperature. Possibly, the cause is similar to that occurring in fresh plants and may be related to the effects of microwaves on the cellular structures of plant, which facilitates the subsequent extraction..
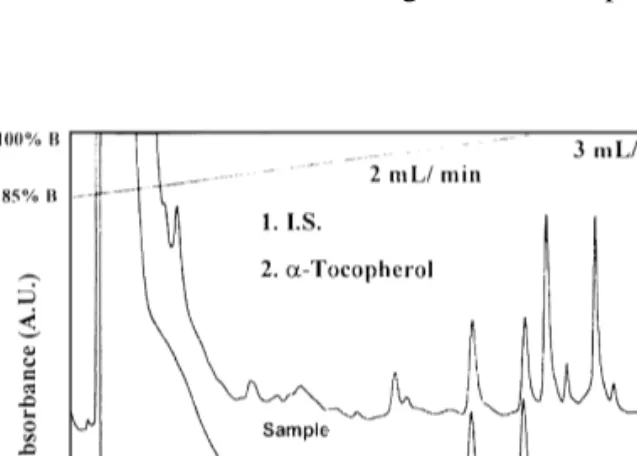
(6) J. Torre et al. / J. Chromatogr. A 919 (2001) 305–311. In microwave-assisted dehydration, the penetration properties of microwaves are employed. The microwaves penetrate into the interior of the substance and vibrate the water molecules, weakening its bonding to the substance and, thereby aiding the migration of the water molecules to the surface were evaporation removes it. Probably in this process strong intermolecular bonds of tocopherol are also broken up and therefore, subsequent extraction facilitated. Another critical point to be considered is the extraction procedure. Results of the different procedures are expressed in terms of percentage of the value obtained with the selected method (single extraction with 3.8 ml acetone), which was assigned 100% recovery. The first employed method was the same previously used in our laboratory for animal tissues and diets [22,23]. As the chlorophylls interfered with that treatment, an extraction with acetone prior to hexane was tested [25]. Recoveries were 11 and 10% depending on the addition of HCl and EtOH–MeOH in the first case or not in the second one. It was not surprising as we observed that the acetonic extract contained a great amount of tocopherol. Acetone breaks down cellulose, micelles and tissue cells and therefore releases analyte from matrix, therefore this solvent was used not for cleaning but for extraction. Thus, acetone was employed in a single or double extraction with the same total volume and no advantage was found in the second case. Although very good results were found with this solvent, other methods described in the bibliography were also tested [19,26–28], but they gave lower recoveries than acetone. Quadruplicate extraction with MeOH gave a recovery of 26% and the same procedure but including citric acid 31%. Recoveries with ethyl acetate as extracting agent were 26% when it was employed alone and 27% when it was mixed with acetic acid as described in the Materials and methods section. Finally, when saponification was employed prior to extraction only 0.2% recovery was achieved. Vitamin E is not chemically bound to proteins, lipids or carbohydrates and using harsh reagents and conditions to free it up (e.g., strong saponification) can destroy the vitamin, as here it is observed. The final point was the optimisation of chromatographic system. First attempts were made with methanol–water (92:8, v / v) as mobile phase, but. 309. although a high and well separated peak appeared, the UV–Vis scan showed other compound, absorbing around 400 nm with the characteristic spectra of photosynthetic pigments, coeluting with the analyte. When the percentage of water was increased enough to permit the resolution into several peaks and tocopherol spectra appeared pure, the less polar components of sample were retained for a too long time, therefore a gradient, described above, was developed. A 70% (v / v) of the methanol employed in the initial conditions was substituted by acetonitrile to decrease the viscosity of the mobile phase and consequently pressure and a small amount of acetic acid (0.1%) was added as modifier to improve tocopherol peak shape. A large number of compounds were checked to be used as internal standard, between them to highlight tocol, different tocopherol esters, ergosterol and progesterone, because the chromatographic profile of samples make the election difficult, but finally ergocalciferol was found to be the best option. Fig. 1 shows the chromatograms obtained for standards and sample in the above conditions. Validation results appear in Table 1. Both standards and samples show a good linearity, with correlation coefficients greater than 0.99. Although the intercept, in sample linearity, does not include the zero value, it is mainly due to the narrow limits of confidence, because of the good fit of the points to. Fig. 1. Chromatogram of standards and sample of acetone extract of rosemary leaves. Gradient conditions are included in the graph, for other conditions see the text..
(7) J. Torre et al. / J. Chromatogr. A 919 (2001) 305–311. 310 Table 1 Main validation parameters Linearity Parameter. Standards Samples. Accuracy Intercept. 0.0560.03 0.0860.09. Slope. 39.260.9 3163. r. 0.999 0.99. Range (mg / ml). 0.014–0.045. the regression line, but it does not pose any bias about recoveries of the extreme values. Intra-assay precision shows RSD values of 3% for standards and 4% for samples and inter-assay precision shows RSD values of 6% and 7%, respectively, which are considered appropriate values for the concentration of analyte to be measured in samples. Results are expressed as mg of a-tocopherol per ml of acetonic extract. Recoveries were 10062% for standards and 9367% for samples (Table 1), indicating an adequate accuracy of the method. The stability assay was performed with the purpose of determining the best way of sample storing and the stability of extracted samples. It is necessary to evaluate how long, after being prepared, they could stay without loosing a-tocopherol, because long analysis periods could be expected when processing real samples. Considering that a sample is stable if a-tocopherol concentration varies less than 7% which is the RSD of inter-assay precision of the method, results show that fresh samples kept in the refrigerator were not stable, since a-tocopherol decreased to 87% in day 1. On the other hand, dried samples kept in the refrigerator after being dried with the microwave oven were stable for 30 days and extracts kept in the refrigerator were stable for 15 days. Finally, a brief remark on a-tocopherol values found in Rosmarinus officinalis plants applying the developed method. Values presented in a recent study [28] give a-tocopherol concentrations in Rosmarinus officinalis from 2 to 35 mg / g dry mass, depending on different factors. In this experiment we have found from 420 to 1000 mg / g dry mass, with variation occurring along the year. A study on tocopherol content in edible vegetables to improve. Recovery (%). 100 93. Precision RSD (%). 2 7. Intra-assay. Inter-assay. Mean (mg / ml). RSD (%). Mean (mg / ml). RSD (%). 0.0278 0.0239. 3 4. 0.0264 0.0226. 6 7. the analytical data base of the US Department of Agriculture Nutrient Database for Individual Food Intake Survey [9] values for a-tocopherol in vegetables ranged from 0.4 to 29 mg / g, but they did not include rosemary plants. Values found in the present experiment are in greater agreement with those found in the hexanic extract of 16 Mediterranean leaves [19] which ranged from 0 to 846 mg / g, but it did not include rosemary either. Wide variations in vitamin E levels have been attributed to differences in cultivars, maturity, growing practices, climates, postharvest handling and analytical methods [29]. Therefore, in the light of the present data, a revision must be done on measured values of a-tocopherol in leaves of green plants, but further studies are necessary to evaluate the validity of present method for different plants.. References [1] [2] [3] [4] [5] [6] [7] [8] [9] [10] [11]. M. Meydani, Lancet 345 (1995) 170. V.H. Booth, Phytochemistry 2 (1963) 21. C. Etman-Gervais, C.R. Acad. Sci. Paris 282D (1976) 1171. A. Gapor, A. Kato, A.S.H. Ong, J. Am. Oil Chem. Soc. 63 (1986) 330. E. Psomiadou, M. Tsimidou, J. Agric. Food Chem. 46 (1998) 5132. F. Dionisi, J. Prodolliet, E. Tagliaferri, J. Am. Oil Chem. Soc. 72 (1995) 1505. J. Carpenter, J. Am. Oil Chem. Soc. 56 (1979) 668. M.C. Lopez Sabater, A. Agramont Llinas, J. Boatella Riera, M.C.d.l. Torre Boronat, Alimentaria 173 (1986) 37. C.J. Hogarty, C. Ang, R.R. Eitenmiller, J. Food. Compos. Anal. 2 (1989) 200. ¨ V. Piironen, E.-L. Syvaoja, P. Varo, K. Salminen, P. Koivistoinen, J. Agric. Food Chem. 34 (1986) 742. ´ M.M. Wall, C.A. Waddell, J. Agric. Food J.A. Osuna-Garcıa, Chem. 46 (1998) 5093..
(8) J. Torre et al. / J. Chromatogr. A 919 (2001) 305–311 [12] A.C. Kurilich, G.J. Tsau, B. Allan, H. Lenora, B.P. Klein, E.H. Jeffery, M. Kushad, M.A. Wallig, J.A. Juvik, J. Agric. Food Chem. 47 (1999) 1576. [13] E.J.M. Konings, H.H.S. Roomans, P.R. Beljaars, J. AOAC Int. 79 (1996) 902. [14] R. Sridhar, G. Lakshminarayana, J. Agric. Food Chem. 41 (1993) 61. [15] G.-C. Yen, S.-C. Wu, P.-D. Duh, J. Agric. Food Chem. 44 (1996) 1687. ´ A.D. Lucas, J. Rincon, ´ A. Alvarez, A. Gracia, [16] A. Garcıa, ´ J. Am. Oil Chem. Soc. 73 (1996) 1127. M.A. Garcıa, [17] E.G. Bligh, W.J. Dyer, Can. J. Physiol. Pharmacol. 37 (1959) 911. ´ [18] M.A. Murcia, A. Vera, F. Garcıa-Carmona, J. Sci. Food Agric. 60 (1992) 81. [19] S. Chevolleau, J.F. Mallet, A. Debal, E. Ucciani, J. Am. Oil. Chem. Soc. 70 (1993) 807. [20] J.F. Mallet, C. Cerrati, E. Ucciani, J. Gamisans, M. Gruber, Food Chem. 49 (1994) 61.. 311. [21] K. Schwarz, W. Ternes, Z. Lebensm.-Unters. Forsch. 195 (1992) 95. ´ ´ [22] F.J. Ruperez, C. Barbas, M. Castro, S. Martınez, E. Herrera, J. Chromatogr. A 823 (1998) 483. ´ [23] F.J. Ruperez, C. Barbas, M. Castro, E. Herrera, J. Chromatogr. A 839 (1999) 93. [24] C.D. Thomopoulos, V. Oreopoulou, K.D. Economou, J. Am. Oil Chem. Soc. 68 (1991) 109. [25] A. Saari Csallany, M. Rahmani, J. Am. Oil Chem. Soc. 68 (1991) 672. [26] S.J. Schwartz, S.L. Woo, J.H. Von Elbe, J. Agric. Food Chem. 29 (1981) 533. [27] F.L. Canjura, S.J. Schwartz, J. Agric. Food Chem. 39 (1991) 1102. ´ [28] S. Munne-Bosch, K. Schwarz, L. Alegre, Z. Naturforsch. 54 (1999) 698. [29] A. Mozafar, Plant Vitamins – Agronomic, Physiological and Nutritional Aspects, CRC Press, Boca Raton, FL, 1994..
(9)
Figure
Documento similar
Suspect screening and target quantification of multi-class pharmaceuticals in surface water based on large-volume injection liquid chromatography and time-of-flight
This is due to include some suggestions that can not be considered as good analytical validation practise: low number of calibration levels (j = 4); narrow
The authors developed a simple and rapid method based on liquid chromatography in tandem with mass spectrometry (LC/MS-MS) with solid phase extraction (SPE)
El análisis de la evolución del color, el contenido y la composición de carotenoides en los frutos de naranjas Navelina almacenados a 2º y 12 ºC muestra que el tratamiento a 12 ºC
In this paper we have proposed a novel method for isosurface extraction from a discrete data field, which can be advan- tageously used for interface reconstruction in volume of
In: 51st International Conference on Parallel Processing (ICPP). Aliaga et al. “A Survey on Malleability Solutions for High-Performance Distributed Computing”. “Advanced
We present here a simple method that combines the power of current machine-learning tech- niques to face high-dimensional data with the likelihood- based inference tests used
High-performance liquid chromatography- ultraviolet detection method for the simultaneous determination of typical biogenic amines and precursor amino acids. applications in
