Journal of Alzheimer's Disease. 2014; 42(3): 801-811
The partial volume effect in the quantification of
1H magnetic
resonance spectroscopy in Alzheimer's disease and aging
Virginia Mato Abad
a,b, Alicia Quirós
c, Roberto García-Álvarez
d, Javier Pereira
Loureiro
e, Juan Álvarez-Linera
b,f, Ana Frank
gand Juan Antonio
Hernández-Tamames
a,ha
Universidad Rey Juan Carlos. Móstoles, Madrid, Spain
b
Neuroimaging Laboratory, Fundación CIEN-Fundación Reina Sofía, Madrid, Spain
c
Hospital Clínico San Carlos, Madrid, Spain
d Clinical Science Development Group, GE Healthcare, Buc, France e
Center of Medical Informatics and Radiological Diagnosis (IMEDIR), Universidad de A Coruña, A Coruña, Spain
f
Hospital Ruber Internacional, Madrid, Spain
g
Hospital Universitario La Paz, Madrid, Spain
h
Centro de Tecnología Biomédica, Universidad Politécnica de Madrid, Spain
Abstract
1H-MRS variability increases due to normal aging and also as a result of atrophy in grey and white matter caused by neurodegeneration. In this work, an automatic process was developed to integrate data from spectra and high-resolution anatomical images to quantify metabolites, taking into account tissue partial volumes within the voxel of interest avoiding additional spectra acquisitions required for partial volume correction. To evaluate this method, we use a cohort of 135 subjects (47 male and 88 female, aged between 57 and 99 years) classified into 4 groups: 38 healthy participants, 20 amnesic mild cognitive impairment patients, 22 multi-domain mild cognitive impairment patients, and 55 Alzheimer's disease patients. Our findings suggest that knowing the voxel composition of white and grey matter and cerebrospinal fluid is necessary to avoid partial volume variations in a single-voxel study and to decrease part of the variability found in metabolites quantification, particularly in those studies involving elder patients and neurodegenerative diseases. The proposed method facilitates the use of 1H-MRS techniques in statistical studies in Alzheimer's disease, because it provides more accurate quantitative measurements, reduces the inter-subject variability, and improves statistical results when performing group comparisons.
Keywords
INTRODUCTION
Intensive efforts are being made to devise novel treatments to slow the progression of Alzheimer’s disease (AD), the most common neurodegenerative form of dementia [1]. Over the past fewdecades, researchers have tried to clinically define this grey area of cognitive decline that probably represents a transitional state between usual brain aging and dementia [2]. Mild cognitive impairment (MCI) has been proposed as a transitional state between healthy aging and AD [3]. Although MCI is a category at high risk of developing dementia, namely 10–15% per year compared to 1–2% in the healthy elderly population [4], some MCI patients never develop dementia and not allADpatients pass through the MCI stage.
Many studies have been performed in order to detect clinical, neuropsychological, and biological predictive markers of progression of MCI to AD [2] to assess the differences between MCI and normal aging or AD. Brain damage in AD and MCI begins in the medial temporal lobe, including the hippocampus, the parahippocampal gyrus, and entorhinal cortex extending to the limbic system [5– 8]. Medial temporal lobe and hippocampal atrophy has been considered as a significant marker of dementia in subjects with MCI [9–11].
Proton magnetic resonance spectroscopy (1H-MRS) is a useful technique for studying brain metabolites in both health and illness [12–14]. 1H-MRS studies provide insight into the in vivo
metabolism of dementia and in particular AD identifying an evolutionary pattern of regional metabolite abnormalities [4]. In AD, the main finding with 1H-MRS is the decreased levels of N-acetylaspartate (NAA) and the increased levels myo-inositol (mI) in the occipital, temporal, parietal, and frontal regions of patients with AD even at the early stages of the disease [15–18].
The NAA is a marker of healthy neuronal density. Consistent with this and with the pathological changes known to occur in neurodegenerative dementing illnesses [19], localized 1H-MRS has shown reduced NAA in different brain regions of AD and MCI patients [4, 15, 20–25]. Dixon and colleagues [26] found a significant reduction of the NAA level in the left hippocampus of AD patients in 1-year follow-up. Adalsteinsson et al. [27] found that reduction in NAA concentration in the grey matter (GM) was more sensitive in detecting cognitive decline in AD than was structural GM volume measured with MRI. However, other cross-sectional studies investigating NAA changes in MCI compared with cognitively healthy subjects yielded negative findings [28–30].
The role of mI in AD is unclear [2]. Rose and coworkers [31] suggested that its level correlates with the progression of the disease and with the number of the neurofibrillary tangles. This metabolite is higher in many other neurological diseases, so its specificity is low [27]. Studies performed in Down’s syndrome, which frequently evolves in a type of dementia similar to AD, found mI levels to be higher compared to controls [32]. There have been reports of increased mI, which is suggestive of an increase in glial content or membrane abnormality, in subjects with AD [29, 33–37]. Parnetti et al. [37] have reported that the increase of mI correlated with dementia severity and duration [12].
Combining these two findings, it has been suggested that mI/NAA ratios may provide a basis for a 1H-MRS diagnostic assay for AD [35, 38]. The study of Wang et al. [39] reveals that the elevation of mI/NAA ratio in the hippocampus is more significant than that in the posterior cingulate area, which corresponds to the pathologic procession of AD. They found a significant correlation between mI/NAA ratio and cognitive decline.
1H-MRS is a complex and sensitive technique where different sources of variability may affect
atrophy in these diseases, could underestimate the metabolite concentrations. Furthermore, metabolite concentrations are different in GM and WM [40, 41]. Wang and Li [42] found significant differences in metabolite concentrations in GM and WM in the occipital lobe.
Different strategies have been proposed to overcome partial volume effects by combining metabolite concentrations with morphological information of MRI studies. Two studies proposed methods for correcting the CSF inclusion within the voxel [43, 44]. Another study proposed an analysis of two voxels [42], containing different proportions of the tissues. In the study by Sánchez González [45], a method that combines the partial volume correction with the correction of the metabolite intensity through the signal without water suppression was proposed. These methods involve the acquisition of at least two spectra for each subject for the correction, which is an important disadvantage in studies involving dementia and elder people, since it implies increasing the acquisition time. Studies by Schuff et al. [46], from 12 AD patients and 17 controls, and Dixon et al. [26], from 9 AD patients and 14 controls, showed that the combination of hippocampal volume and hippocampal NAA concentration with partial volume correction gave better discrimination of AD than did either measurement alone. The study of Westman and colleagues [47], from 30 AD patients and 36 control subjects, found that combining MRI and 1H-MRS measures resulted in a sensitivity of 97% and a specificity of 94% compared to using MRI or MRS measures alone. Adding 1H-MRS measures to MRI measures resulted in significantly better classification than using MRI measures alone and the method showed strong potential for discriminating between AD and controls.
These results suggest that precise composition of GM, WM, and CSF is needed in a single-voxel study to accurately quantify the metabolite concentrations, particularly in those studies involving elder patients and neurodegenerative diseases. This improvement could solve some of the variability found in metabolites quantification and explain part of the discrepancies found in the literature. Technical developments to reduce this variability may make 1H-MRS a viable biomarker in clinical trials for AD [1].
In this work, new post-processing techniques have been developed for combining spectroscopy data with anatomical images. These techniques quantify metabolite concentrations taking into account tissue components (GM, WM, and CSF) within the voxel of interest. Also, they do not require additional spectra acquisitions per subject for doing the metabolite corrections, an important issue in dementia studies. The main goal is to reduce de within-subject variability and prove if 1 H-MRS could be a useful biomarker for dementia and AD studies.
MATERIAL AND METHODS
Subjects
We use a cohort of 135 subjects (47 male and 88 female) aged between 57 and 99 years. They are studied in the Alzheimer Research Unit of the Fundación CIEN-Fundación Reina Sofía. The approval from the local ethics committee was obtained for this study and all patients gave informed consent for participation.
All participants completed the Mini-Mental State Examination [48] and the Clinical Dementia Rating Scale to assess their cognitive function [49]. Diagnostic assessment of the MCI patients was performed according to Petersen’s criteria [50]. AD status was determined according to the National Institute of Neurological and Communicative Disorders and Stroke/Alzheimer’s Disease and Related Disorders Association [51] criteria for AD.
Data acquisition
All MR images and spectroscopic data were acquired with a clinical GE Signa HDx 3.0T scanner using a single-channel quadrature head coil. The MRI protocol included a spoiled gradient echo (IR-SPGR) high-resolution T1 volume (TR/TE/TI/flip angle = 9/4/650 ms/12, matrix = 512×512, FOV= 24×24 cm, NEX= 1, 158 slices×1.0mm slice thickness). The spectroscopy protocol consisted of three Point Resolved Spin Echo (PRESS) acquisitions with TR = 1500 ms and TE = 35 ms: two single-voxel (SV) with a mean size of 5.5 cm3 was prescribed in both hippocampi, and a SV with a mean size of 8 cm3 was placed in the posterior cingulate.
Data post-processing
An automatic process has been developed with MATLAB software [52] to:
1. Perform brain tissue segmentation from highresolution T1 3D volume with SPM8 software [53]. SPM software performs a voxel-based approach for tissue segmentation using modified versions of the ICBM (The International Consortium for Brain Mapping) Tissue Probabilistic Atlases [54].
2. Localize the 1H-MRS voxel into the highresolution 3D anatomic volume. To localize the 1 H-MRS voxel into the anatomic 3D study during the post-process, the following is required: a) Anatomical localization: image localization and image orientation information from the DICOM files; b) Spectroscopic localization: voxel position, voxel size, and voxel orientation and rotation. This information is not included in the DICOM files. Therefore is necessary to get it from the raw data generated by the scanner; c) Finally, transform the two volumes to a common space for represent them together. This involves moving the spectroscopic voxel to the 3D anatomical space where it was prescribed.
3. Determine the tissue composition of the voxel from the segmented high-resolution T1 3D into GM, WM, and CSF.
4. Quantify spectra using LCModel software [55]. The main brain metabolites in neurodegenerative diseases—creatine (Cr), Cholina (Cho), NAA, and mI—were recorded. To define a criterion for rejection of poor quality spectra, the Cramer Rao lower bounds for the Cr signal intensity (given as %Standard deviation (SD)-value by the LCModel) were used. Only those spectra with an SD <20 were included in the study. In all these spectra the linewidth, obtained during the shimming process, was (on average) 9, 8, and 7Hz for left hippocampus (LH), right hippocampus (RH), and posterior cingulate (PC), respectively, with no significant mean differences between the groups.
5. Modify LCModel quantifications applying the method described below.
The last step proposes the modification of the spectra quantification values according to the relative proportion of GM, WM, and CSF in each voxel. The theoretical distribution of the metabolite concentration (Mc) in a particular voxel is defined by the equation:
𝑃(𝑀𝑐) = 𝑃(𝐺𝑀) ∙ 𝑃(𝑀𝑐|𝐺𝑀) + 𝑃(𝑊𝑀) ∙ 𝑃(𝑀𝑐|𝑊𝑀) + 𝑃(𝐶𝑆𝐹) ∙ 𝑃(𝑀𝑐|𝐶𝑆𝐹) (1)
Also, it is known that voxel, obtained from segmentation on high-resolution T1; V is the total volume of the voxel, sum of VGM, VWM, and VCSF; CGM, CWM, and CCSF are, respectively, the contributions of the GM, WM, and CSF to the metabolite.
Replacing Equations (2) to (7) in Equation (1), we obtain that the theoretical concentration for a given metabolite in a particular voxel can be defined by:
𝑃(𝑀𝑐) = CCSF is assumed to be zero and Equation (8) can be rewritten as follows:
𝑃(𝑀𝑐) =
Normal metabolite ratios published by [56] were used to obtain the contribution of GM and WM to the quantity of each metabolite. Finally, we combine the theoretic concentration with the LCModel result (LCC) as follows:
This method obtains a weighted measure (WC) that corrects the quantified concentration by the theoretical amount of metabolite for a particular voxel. WC is a metabolite concentration measurement corrected for the theoretical expected ratio of metabolite and the volume atrophy within the voxel. Furthermore, the proposed method avoids the acquisition of more spectra for each subject, which would increase the time and cost of the acquisition.
Statistical analysis
Statistical analysis and graphics were performed with PASW Statistics 18.0 (Predictive Analytics Soft- Ware). In order to explain differences on metabolite concentration between groups, a generalized linear model (GLM) was fitted. Group differences were assessed by means of ANOVA and post-hoc test (by the GLM) were performed when ANOVA result was significant.
Statistical significance was set at p < 0.05. Etasquared values (η2) were calculated as a measure of effect size. The power of a statistical test is the probability that the test will reject the null hypothesis when the null hypothesis is actually false. The ideal power level should be at least 0.8; that is the minimum level required for a quantitative research by Cohen in a scale from 0 to 1 [57]. Power analysis can be used to calculate the minimum sample size required so that one can be reasonably likely to detect an effect of a given size. The effect size is a measure of the strength of the relationship between two variables. According to Cohen again, effect size levels are small ∼0.01, medium ∼0.06 and large ∼0.14. Statistical power and effect size measures complements test of significance such as p-values.
RESULTS
Figure 1 displays the typical single-voxel spectroscopy prescription in the right hippocampus from one subject, registered onto a high-resolution T1- weighted image (Fig. 1a–c). The resulting spectrum (Fig. 1d) exhibits four distinctive peaks, these being (from right to left)NAA, Cr, Cho, and mI. In this figure, LCModel spectral fit is shown in black (thick line) and raw data in grey (thin line). Figure 2 illustrates the segmented GM volume (Fig. 2a), WM volume (Fig. 2b), and CSF volume (Fig. 2c) from high resolution T1 of Fig. 1. Right hippocampus SV is registered onto the three volumes (GM, WM, and CSF) to obtain the partial volumes within the voxel. Figure 3 shows the boxplots with the partial volume distributions on the SV placed at both hippocampi and the posterior cingulate along the different groups: Fig. 3a – the ratio VGM/V, Fig. 3b – the ratio VWM/V, and Fig. 3c – the ratio VCSF/V.
Fig. 2. SPM8 brain tissue segmentation from high-resolution T1 SPGR from Fig. 1: GM (a), WM (b), and CSF (c) in sagittal, transverse and coronal view. Single voxel at right hippocampus registered onto the three volumes.
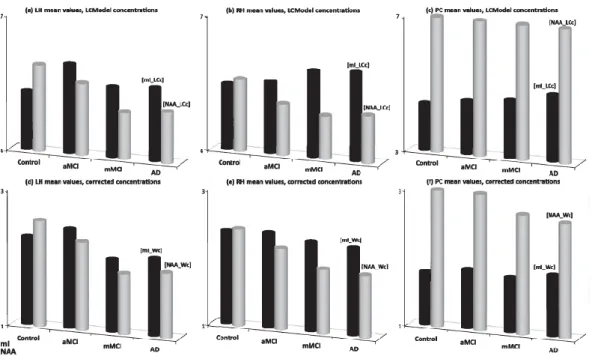
Main brain metabolites concentrations were evaluated for each group. Mean values of mI (dark-colored) and NAA (light-(dark-colored) concentrations for both absolute and corrected measurements are shown in Fig. 4. Figure 4a and d show the values for left hippocampus SV, Fig. 4b and e show the values for right hippocampus SV, and Fig. 4c and f shows the values for posterior cingulate SV. Top row (Fig. 4a–c) shows the mI and NAA concentrations along different groups. Bottom row (Fig. 4d– f) shows the mI and NAA weighted concentrations after applying the proposed method for metabolite concentration correction.
Fig. 4. Mean values of mI (dark-colored) and NAA (light-colored) concentration along different groups for (a, d) left hippocampus (left column), (b, e) right hippocampus (middle column), and (c, f) posterior cingulate (right column). Top row (a, b, c) shows LCModel results (LCc) and bottom row (c, d, f) shows the results corrected by the proposed method (Wc).
Figure 5 shows the variance of mI and NAA concentration in different groups for both LCModel metabolite concentration (dotted line) and weighted by atrophy within the voxel (solid line). Figure 5a shows the results for left hippocampus, Fig. 5b shows the results for right hippocampus, and Fig. 5c shows the results for posterior cingulate.
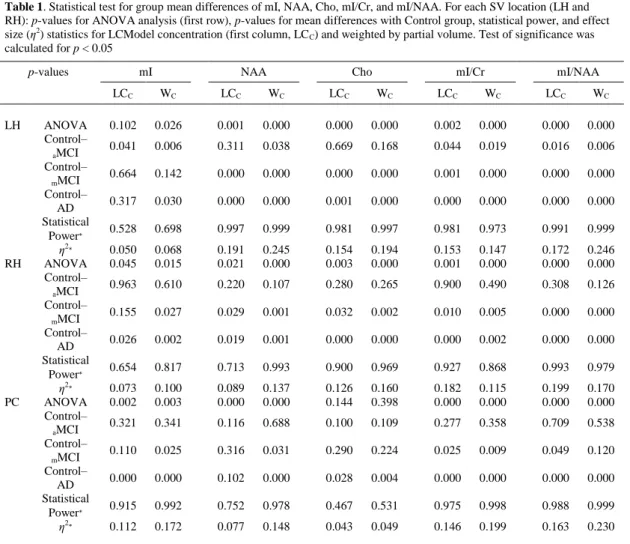
Table 1 shows the results of the statistical analysis for those metabolite concentrations and ratios which means resulted significantly differences in ANOVA, say mI, NAA, Cho, mI/Cr, and mI/NAA, in both hippocampi and the posterior cingulate. First row shows the p-values for ANOVA analysis. Also, it shows the p-values, the statistical power, and the effect size estimates for two-group mean differences (Control-aMCI, Control-mMCI, and Control-AD comparisons). For each variable, the first column shows the results for LCModel absolute concentrations and the second column shows the results for corrected values.
Table 1. Statistical test for group mean differences of mI, NAA, Cho, mI/Cr, and mI/NAA. For each SV location (LH and RH): p-values for ANOVA analysis (first row), p-values for mean differences with Control group, statistical power, and effect size (η2) statistics for LCModel concentration (first column, LCC) and weighted by partial volume. Test of significance was calculated for p < 0.05 progression of the disease in both hippocampi and to a lesser extent in the posterior cingulate. This fact is accompanied by an increase of CSF within the voxel. As shown in Fig. 3, the posterior cingulate is less affected by atrophy.
with earlier studies reported in the literature [4, 15, 20–25, 29, 33–37]. Figure 4c and f show this trend is attenuated in the posterior cingulate with little variations in mI and NAA levels among groups for both absolute and corrected metabolite quantifications. This agrees with the low atrophy found in the posterior cingulate and more stability among groups. Regarding hippocampi metabolite concentrations corrected by the proposed method, Fig. 4d and e show how the same trend is kept for the ratio mI/NAA at within-group level in hippocampi. Also, the behavior of NAA continues in the same line as for LCModel concentrations, decreasing with the progression of the disease. However, mI behavior changes. The method proposed in Equation (10) obtains a weighted measure that corrects the absolute concentration by the theoretical expected ratio of metabolite concentration and volume atrophy within the voxel. Thus, as the tissue atrophy should increase with the progression of the disease, the metabolite concentration should be smaller for less volume of tissue (ratios VGM/V and VwM/V in Equation (9) are smaller). Therefore, the reason why mI decreases along groups for corrected measures is that the atrophy is taking into account, but, as mentioned above, the ratio mI/NAA is kept, following the well-known behavior across groups.
Furthermore, the most important results from this work are regarding the variance of the metabolite concentrations. Figure 5 shows how AD group has the largest variability in both hippocampi and the posterior cingulate. From Fig. 5a and b, it is shown that Control and MCI groups present more irregularities in their variability depending on the hemisphere, meaning metabolite quantification could potentially be different depending on the hemisphere. Also, it is shown that mI has higher variability than NAA. Figure 5a and b also shows an increase of the within-group variability with the progression of the disease for the absolute measures in both hippocampi. Results in the posterior cingulate (Fig. 5c) are a slightly different. mI and NAA has similar variability across groups, being lower than in hippocampi. AD group has the largest variability like in hippocampi, but it is noteworthy that MCI groups have lower variability than Controls. By applying the correction on the absolute measures, the same trend continues for the hippocampi and posterior cingulate, but the within-group variability is significantly reduced. With this method, the trend of the mean remains between metabolites within the groups, but the variance is considerably decreased. This fact justifies the use of methods for correction by the partial volumes due to some of the variability found in the quantification could be explained by the partial volume effect within the voxel.
The variability reduction can also be demonstrated mathematically. Using Equation (10), the variance with the proposed method can be defined as:
𝑉𝑎𝑟[𝑊𝑐] = 𝑉𝑎𝑟[𝐿𝐶𝑐∙ 𝑃(𝑀𝑐)] (11)
Being P(Mc) a constant, Equation (11) can be rewritten as:
𝑉𝑎𝑟[𝑊𝑐] = 𝑃(𝑀𝑐) 2𝑉𝑎𝑟[𝐿𝐶𝑐] ≤ 𝑉𝑎𝑟[𝐿𝐶𝑐] (12)
Equation (12) shows how the variance of the proposed method is always less than or equal to the variance of LCModel concentrations, being P(Mc)2< 1.
From the results of statistical hypothesis tests shown in Table 1, highlight the following points:
1. Best statistical results were observed in left hippocampus, with significant differences between Control and aMCI groups. This result complies well with the neuropathologic concept of evolution of AD according to the Braak staging [58]. Atrophy typically starts in the medial temporal lobe and limbic areas, subsequently spreading to parietal association areas, and finally to frontal and primary cortices. First damage in AD is observed in the left temporal lobe. Generally, major changes in MCI and AD appear on the left hemisphere.
3. mI/Cr and mI/NAA ratios were the best markers to differentiate control group from aMCI, mMCI, and AD groups with meaningful values of statistical power and effect size. In contrast to studies [4] and [2], no significant differences were found in NAA/Cr in this study. Also, statistical test for NAA concentration did not improve too much with corrected values.
4. Statistical significance, statistical power, and effect size values improved when metabolite concentrations were corrected, mainly for mI/NAA ratio in left hippocampus, getting values of 0.99 and higher than 0.2 in power and effect size respectively and p < 0.0001.
5. Despite suitable results obtained for the ratio mI/NAA, different behavior is observed in mI, NAA, mI/Cr, and NAA/Cr before and after doing correction. This could be due to whatwas already reported by Zhu [59], where no significant correlations were found in this study between these two metabolites. These results suggest a disassociation between mI and NAA alterations in AD, changes occur in the same brain regions but not at the same time or rate. According to Zhu, there would be a dependency of the staging of the disease.
Figure 1 shows ‘non-hippocampus’ volume included in the spectroscopic voxel. Trying to reduce the voxel size resulted in poor shim and poor line width adjustment and spectra with very low resolution and poor signal-to-noise ratio. Hence, the importance of the proposed method, allowing a larger voxel while the variability is reduced and increases the ANOVA statistical power. It should be also noted that using ‘non-hippocampus’ normal metabolite ratios [56] for correct metabolite concentrations might not be the most optimal choice. However, these values are used as a relative measure of what we consider a measure of normality, like a surrogate of metabolite concentration. Since the goal is to differentiate among groups, the reference used does not matter too much as long as the same concentration for controls and patients was used and, unfortunately, we did not found any publication reporting normal hippocampal concentrations.
In this work, an automatic process was developed for integrate data from spectra and high-resolution anatomical images to quantify metabolite concentrations taking into account tissue partial volumes within the voxel of interest avoiding specific GM and WM SV spectra acquisition required for partial volume correction. This process facilitates the use of 1H-MRS techniques in statistical studies in AD, because the modification of metabolites concentrations by the voxel tissue composition: (1) provides more accurate quantitative measurements, (2) reduces the inter-subject variability, and (3) improves the statistical results when performing group comparisons in studies of normal aging and neurodegenerative diseases. Specifically, mI/NAA ratio has been shown to be a robust and sensitive marker to differentiate between subject groups.
These findings suggest that knowing the voxel composition of WM, GM, and CSF is necessary to avoid partial volume variations in a single-voxel study and to decrease part of the variability found in metabolites quantification, particularly in those studies involving elder patients and neurodegenerative diseases. Also, the improvement of the statistical power and effect size means a reduction in the sample size, which suggests a potential for important cost savings.
ACKNOWLEDGMENTS
The authors thank all the DEMCAM project team. DEMCAM is a multicenter study with patients from different units of dementia in the Community of Madrid.
REFERENCES
[1] Schott JM, Frost C, MacManus DG, Ibrahim F,Waldman AD, Fox NC (2010) Short echo time proton magnetic resonance spectroscopy in Alzheimer’s disease: A longitudinal multiple time point study. Brain 133, 3315-3322.
[2] Metastasio A, Rinaldi P, Tarducci R, Mariani E, Feliziani FT, Cherubini A, Pelliccioli GP, Gobbi G, Senin U, Mecocci P (2006) Conversion of MCI to dementia: Role of proton magnetic resonance spectroscopy. Neurobiol Aging 27, 926-932.
[3] Grundman M, Petersen RC, Ferris SH, Thomas RG, Aisen PS, Bennett DA, Foster NL, Jack CR Jr, Galasko DR, Doody R, Kaye J, Sano M, Mohs R, Gauthier S, Kim HT, Jin S, Schultz AN, Schafer K, Mulnard R, van Dyck CH, Mintzer J, Zamrini EY, Cahn-Weiner D, Thal LJ, Alzheimer’s Disease Cooperative Study (2004) Mild cognitive impairment can be distinguished from Alzheimer disease and normal aging for clinical trials. Arch Neurol 61, 59-66.
[4] Ackl N, Ising M, SchreiberYA, Atiya M, Sonntag A, Auer DP (2005) Hippocampal metabolic abnormalities in mild cognitive impairment and Alzheimer’s disease. Neurosci Lett 384, 23-28.
[5] Holland D, Brewer JB, Hagler DJ, Fennema-Notestine C, Dale AM, Alzheimer’s Disease Neuroimaging, Initiative (2009) Subregional neuroanatomical change as a biomarker for Alzheimer’s disease. Proc Natl Acad SciUS A 106, 20954-20959. [6] Hampel H, B¨urger K, Teipel SJ, Bokde ALW, Zetterberg H, Blennow K (2008) Core
candidate neurochemical and imaging biomarkers of Alzheimer’s disease. Alzheimers Dement 4, 38-48.
[7] Devanand DP, Pradhaban G, Liu X, Khandji A, De Santi S, Segal S, Rusinek H, Pelton GH, Honig LS, Mayeux R, Stern Y, Tabert MH, de Leon MJ (2007) Hippocampal and entorhinal atrophy in mild cognitive impairment: Prediction of Alzheimer disease. Neurology 68, 828-836.
[8] Raji CA, Lopez OL, Kuller LH, Carmichael OT, Becker JT (2009) Age, Alzheimer disease, and brain structure. Neurology 73, 1899-1905.
[9] Visser PJ,Verhey FR, Hofman PA, Scheltens P, Jolles J (2002) Medial temporal lobe atrophy predicts Alzheimer’s disease in patients with minor cognitive impairment. J Neurol Neurosurg Psychiatry 72, 491-497.
[10] Korf ES, Wahlund LO, Visser PJ, Scheltens P (2004) Medial temporal lobe atrophy on MRI predicts dementia in patients with mild cognitive impairment. Neurology 63, 94-100.
[11] de Leon MJ, Golomb J, George AE, Convit A, Tarshish CY, McRae T, De Santi S, Smith G, Ferris SH, Noz M (1993) The radiologic prediction of Alzheimer disease: The atrophic hippocampal formation. AJNR Am J Neuroradiol 14,897-906.
[12] Frederick BD, Lyoo IK, Satlin A, Ahn KH, Kim MJ, Yurgelun-Todd DA, Cohen BM, Renshaw PF (2004) In vivo proton magnetic resonance spectroscopy of the temporal lobe in Alzheimer’s disease. Prog Neuropsychopharmacol Biol Psychiatry 28, 1313-1322.
[13] Lin A, Ross BD, Harris K,WongW(2005) Efficacy of proton magnetic resonance spectroscopy in neurological diagnosis and neurotherapeutic decision making. NeuroRx 2, 197-214.
[14] Ross AJ, Sachdev PS (2004) Magnetic resonance spectroscopy in cognitive research. Brain Res Brain Res Rev 44, 83-102.
[15] Valenzuela MJ, Sachdev P (2001) Magnetic resonance spectroscopy in AD. Neurology 56, 592-598.
[16] Miller BL, Moats RA, Shonk T, Ernst T,Woolley S, Ross BD (1993) Alzheimer disease: Depiction of increased cerebral myo-inositol with proton MR spectroscopy. Radiology 187, 433-437.
[17] Moats RA, Ernst T, Shonk TK, Ross BD (1994) Abnormal cerebral metabolite concentrations in patients with probable Alzheimer disease. Magn Reson Med 32, 110-115.
[18] Waldman AD, Rai GS (2003) The relationship between cognitive impairment and in vivo metabolite ratios in patients with clinical Alzheimer’s disease and vascular dementia: A proton magnetic resonance spectroscopy study. Neuroradiology 45, 507-512.
[19] Pearson RC, Esiri MM, Hiorns RW, Wilcock GK, Powell TP (1985) Anatomical correlates of the distribution of the pathological changes in the neocortex in Alzheimer disease. Proc Natl Acad Sci U S A 82, 4531-4534.
[20] Modrego PJ, Fayed N (2011) Longitudinal magnetic resonance spectroscopy as marker of cognitive deterioration in mild cognitive impairment. Am J Alzheimers Dis Other Demen 26, 631-636.
Longitudinal 1HMRS changes in mild cognitive impairment and Alzheimer’s disease. Neurobiol Aging 28, 1330-1339.
[22] Falini A, Bozzali M, Magnani G, Pero G, Gambini A, Benedetti B, Mossini R, Franceschi M, Comi G, Scotti G, FilippiM(2005) A whole brain MR spectroscopy study from patients with Alzheimer’s disease and mild cognitive impairment. Neuroimage 26, 1159-1163.
[23] Chantal S, Braun CM, Bouchard RW, Labelle M, Boulanger Y (2004) Similar 1H magnetic resonance spectroscopic metabolic pattern in the medial temporal lobes of patients with mild cognitive impairment and Alzheimer disease. Brain Res 1003, 26-35.
[24] Chantal S, Labelle M, Bouchard RW, Braun CM, Boulanger Y (2002) Correlation of regional proton magnetic resonance spectroscopic metabolic changes with cognitive deficits in mild Alzheimer disease. Arch Neurol 59, 955-962.
[25] Schuff N, Capizzano AA, Du AT, Amend DL, O’Neill J, Norman D, Kramer J, Jagust W, Miller B, Wolkowitz OM, Yaffe K, Weiner MW (2002) Selective reduction of Nacetylaspartate in medial temporal and parietal lobes in AD. Neurology 58, 928-935. [26] Dixon RM, Bradley KM, Budge MM, Styles P, Smith AD (2002) Longitudinal
quantitative proton magnetic resonance spectroscopy of the hippocampus in Alzheimer’s disease. Brain 125, 2332-2341.
[27] Adalsteinsson E, Sullivan EV, Kleinhans N, Spielman DM, Pfefferbaum A (2000) Longitudinal decline of the neuronal marker N-acetyl aspartate in Alzheimer’s disease. Lancet 355, 1696-1697.
[28] Catani M, Cherubini A, Howard R, Tarducci R, Pelliccioli GP, Piccirilli M, Gobbi G, Senin U, Mecocci P (2001) (1)H-MR spectroscopy differentiates mild cognitive impairment from normal brain aging. Neuroreport 12, 2315-2317.
[29] Kantarci K, Jack CR Jr, Xu YC, Campeau NG, O’Brien PC, Smith GE, Ivnik RJ, Boeve BF, Kokmen E, Tangalos EG, Petersen RC (2000) Regional metabolic patterns in mild cognitive impairment and Alzheimer’s disease: A 1H MRS study. Neurology
55, 210-217.
[30] Kantarci K, Smith GE, Ivnik RJ, Petersen RC, Boeve BF, Knopman DS, Tangalos EG, Jack CR Jr (2002) 1H magnetic resonance spectroscopy, cognitive function, and apolipoprotein E genotype in normal aging, mild cognitive impairment and
Alzheimer’s disease. J Int Neuropsychol Soc 8, 934-942.
[31] Rose SE, de Zubicaray GI,Wang D, Galloway GJ, Chalk JB, Eagle SC, Semple J, DoddrellDM(1999)A1HMRS study of probable Alzheimer’s disease and normal aging: Implications for longitudinal monitoring of dementia progression. Magn Reson Imaging 17, 291-299.
[32] HuangW, Alexander GE, Daly EM, Shetty HU, Krasuski JS, Rapoport SI, Schapiro MB (1999) High brain myo-inositol levels in the predementia phase of Alzheimer’s disease in adults with Down’s syndrome: A 1H MRS study. Am J Psychiatry 156, 1879-1886.
[33] Siger M, Schuff N, Zhu X, Miller BL, Weiner MW (2009) Regional myo-inositol concentration in mild cognitive impairment Using 1H magnetic resonance spectroscopic imaging. Alzheimer Dis Assoc Disord 23, 57-62.
[34] Huang W, Alexander GE, Chang L, Shetty HU, Krasuski JS, Rapoport SI, Schapiro MB (2001) Brain metabolite concentration and dementia severity in Alzheimer’s disease: A (1)HMRS study. Neurology 57, 626-632.
[35] Shonk TK, Moats RA, Gifford P, Michaelis T, Mandigo JC, Izumi J, Ross BD (1995) Probable Alzheimer disease: Diagnosis with proton MR spectroscopy. Radiology 195, 65-72.
[36] Ernst T, Chang L, Melchor R, Mehringer CM (1997) Frontotemporal dementia and early Alzheimer disease: Differentiation with frontal lobe H-1 MR spectroscopy. Radiology 203, 829-836.
[37] Parnetti L, Tarducci R, Presciutti O, Lowenthal DT, Pippi M, Palumbo B, Gobbi G, Pelliccioli GP, Senin U (1997) Proton magnetic resonance spectroscopy can differentiate Alzheimer’s disease from normal aging. Mech Ageing Dev 97, 9-14. [38] Doraiswamy PM, Charles HC, Krishnan KR (1998) Prediction of cognitive decline in
early Alzheimer’s disease. Lancet 352, 1678.
[39] Wang Z, Zhao C, Yu L, Zhou W, Li K (2009) Regional metabolic changes in the hippocampus and posterior cingulate area detected with 3-Tesla magnetic resonance spectroscopy in patients with mild cognitive impairment and Alzheimer disease. Acta Radiol 50, 312-319.
[41] McLean MA, Woermann FG, Barker GJ, Duncan JS (2000) Quantitative analysis of short echo time (1)H-MRSI of cerebral gray and white matter. Magn Reson Med 44, 401-411.
[42] Wang Y, Li SJ (1998) Differentiation of metabolic concentrations between gray matter and white matter of human brain by in vivo 1H magnetic resonance spectroscopy. Magn Reson Med 39, 28-33.
[43] Weber-FahrW, Ende G, Braus DF, Bachert P, Soher BJ, Henn FA, Buchel C
(2002)Afully automated method for tissue segmentation and CSF-correction of proton MRSI metabolites corroborates abnormal hippocampal NAA in schizophrenia. Neuroimage 16, 49-60.
[44] Auer DP, Wilke M, Grabner A, Heidenreich JO, Bronisch T, Wetter TC (2001) Reduced NAA in the thalamus and altered membrane and glial metabolism in schizophrenic patients detected by 1H-MRS and tissue segmentation. Schizophr Res
52, 87-99.
[45] Sánchez González J (2004) Cuantificación de estudios de Espectroscopía por Resonancia Magnética in vivo: Aplicación a volumen único e imagen multicanal, https://serviciosgate.upm.es/tesis/tesis/3847, Accessed on February 20, 2014. [46] Schuff N, Amend D, Ezekiel F, Steinman SK, Tanabe J, Norman D, JagustW, Kramer
JH, Mastrianni JA, Fein G,Weiner MW (1997) Changes of hippocampal N-acetyl aspartate and volume in Alzheimer’s disease. A proton MR spectroscopic imaging and MRI study. Neurology 49, 1513-1521.
[47] Westman E, Wahlund LO, Foy C, Poppe M, Cooper A, Murphy D, Spenger C, Lovestone S, Simmons A (2011) Magnetic resonance imaging and magnetic resonance spectroscopy for detection of early Alzheimer’s disease. J Alzheimers Dis
26(Suppl 3), 307-319.
[48] Folstein MF, Folstein SE, McHugh PR (1975) “Mini-mental state”. A practical method for grading the cognitive state of patients for the clinician. J Psychiatr Res 12, 189-198.
[49] Hughes CP, Berg L, Danziger WL, Coben LA, Martin RL (1982) A new clinical scale for the staging of dementia. Br J Psychiatry 140, 566-572.
[50] Petersen RC, Smith GE, Waring SC, Ivnik RJ, Tangalos EG, Kokmen E (1999) Mild cognitive impairment: Clinical characterization and outcome. Arch Neurol 56, 303-308.
[51] McKhann G, Drachman D, Folstein M, Katzman R, Price D, Stadlan EM (1984) Clinical diagnosis of Alzheimer’s disease: Report of the NINCDS-ADRDAWork Group under the auspices of Department of Health and Human Services Task Force on Alzheimer’s Disease. Neurology 34, 939-944.
[52] The MathWorks, Inc., http://www.mathworks.com/, Accessed on January 30, 2014. [53] SPM. Statistical Parametric Mapping, The Wellcome Trust Centre for neuroimaging
at University College of London, http://www.fil.ion.ucl.ac.uk/spm/, Accessed on February 6, 2014.
[54] Mazziotta JC, Toga AW, The International Consortium for Brain Mapping, http://www.loni.usc.edu/ICBM/, Accessed on January 30, 2014.
[55] ProvencherSW(2001) Automatic quantitation of localized in vivo 1H spectra with LCModel. NMR Biomed 14, 260-264.
[56] Danielsen ER, Ross B (1998) Magnetic Resonance Spectroscopy Diagnosis of Neurological Diseases,Marcel Dekker, New York.
[57] Cohen J (1992) A power primer. Psychol Bull 112, 155-159.
[58] Braak H, Braak E (1991) Neuropathological stageing of Alzheimer-related changes. Acta Neuropathol 82, 239-259.