Electrodeposition of silver nanoparticles in presence
of different complexing agents by time-resolved
Raman spectroelectrochemistry.
D. Ibañez1,*, D. Izquierdo1, C. Fernandez-Blanco2, A. Heras1, A. Colina1.
1. Department of Chemistry, Universidad de Burgos, Pza. Misael Bañuelos s/n, 09001, Burgos, Spain.
Abstract
Chemical and physical properties of metal nanoparticles (NPs) are determined not only by the synthesis method used to prepare them, but also by the experimental conditions under the generation process takes place. One of the most important factors in the synthesis of NPs is the presence of complexing agents in the media that can change the size and shape of the NPs. The significant role of different complexing agents (cyanide, ethylenediaminetetraacetic acid and ethylenediamine) in the electrochemical formation of silver nanoparticles (AgNPs) has been analyzed by time-resolved Raman spectroelectrochemistry. Electrochemical and spectroscopic responses, obtained simultaneously, provide suitable information about the changes that occur on the platinum electrode surface during the AgNPs electrodeposition. The morphology of AgNPs has been analyzed by UV-Vis absorption spectroelectrochemistry, providing additional information and a detailed view of the electrodeposition process. The influence of the complexing agent used to generate AgNPs has been studied analyzing the surface-enhanced Raman scattering (SERS) effect of the modified substrate. Raman spectra show different SERS behaviour depending on the complexing agent and therefore, on the AgNPs generated. The relationship between SERS signals and the morphology of AgNPs has been displayed by SEM images. Time-resolved Raman spectroelectrochemistry confirms that chemical mechanism is necessary for SERS effect.
1. Introduction
Metal NPs exhibit a large range of optical, chemical, catalytic, electrical and magnetic properties due to finite size effects, making them really useful in completely different fields.[1–8] These properties can change as function of the metal, size, shape or number of components of the NPs and are different from the bulk or their constituents because the surface of the NPs are structurally and compositionally different.[9] Synthesis of metal NPs can be accomplished by different methods, such as chemical reduction,[10,11] seed-mediated,[12] photochemical,[13] electrochemical,[14,15] sonochemical,[16] lithography,[17,18] galvanic replacement,[19] thermal evaporation,[20] radiolysis, [21] sol-gel,[22] laser ablation,[23,24] chemical vapor deposition,[25] microwave assisted[26] and biological assisted.[27,28] The selection of the synthesis method, concentration of the reagents and other experimental parameters such as pH, temperature, etc., allows us to obtain NPs with specific size and shape. The control of all these factors determines the particular chemical and physical properties of the obtained NPs. In particular, electrochemical method enables the control of the deposition process, as the manner that slight changes of intensity current, applied potential, electrodeposition time, electrode material, kind or concentration of supporting electrolyte or salt precursor electrolyte can produce significant modifications in the properties of generated NPs.
a SERS substrate.[39–45] Taking into account that Raman spectroscopy is one of the most powerful techniques in the detection and characterization of a huge variety of systems,[46–50] the combination of this spectroscopic technique with an electrochemical response provides information of different nature in a unique experiment. Furthermore, UV-Vis absorption spectroelectrochemistry is one of the few techniques that allows the in-situ study of the electrogeneration of metal NPs.[51,52]
In this work, the role of different complexing agents (cyanide, ethylenediaminetetraacetic acid and ethylenediamine) in the electrogeneration of AgNPs has been analyzed. SERS effect of AgNPs formed by cyclic voltammetry in presence of these markers has been studied by time-resolved Raman spectroelectrochemistry. This technique provides dynamic information that allows us to understand the processes that occur on the electrode surface during the whole experiment, and not only at selected potentials. Furthermore, combination and comparison of Raman and UV-Vis absorption spectroelectrochemistry data offer a more detailed view of the electrodeposition process, the morphology of AgNPs electrogenerated as well as SERS effect produced by the nanostructures formed on the electrode surface.
2. Material and methods
2.1. Reagents
Silver nitrate (AgNO3, Aldrich), potassium cyanide (KCN, Panreac), ethylenediamine (en,
Merck), ethylenediaminetetraacetic acid (EDTA, Merck) and potassium nitrate (KNO3, Merck)
2.2.Instrumentation
All electrochemical measurements were carried out at room temperature using a potentiostat/galvanostat AUTOLAB PGSTAT 20 electrochemical system. A standard three-electrode cell was used in all experiments, consisting of a Pt working three-electrode (WE), a Pt wire as counter electrode (CE) and a homemade Ag/AgCl/KCl (3 M) as reference electrode (RE). Before Ag electrodeposition, the Pt working electrode was polished to a mirror finish using alumina slurries with different powder size down to 0.5 μm. Next, the electrode was thoroughly rinsed with ultrapure water and sonicated in ultrapure water in an ultrasonic bath for 15 min to remove any absorbed substances on the electrode surface.
PGSTAT 20 are synchronized by a trigger. Further details about the dynamic spectroelectrochemical Raman system have been previously reported.[51,53] An XYZ piezoelectric positioner (Newport 271) controlled by a Newport motion controller (Newport, ESP 301) was used to focus the laser beam with micrometric resolution.
Figure S2a (Supporting Information) shows UV-Vis absorption spectroelectrochemical cell used in this work. As can be noticed, Raman and UV-Vis absorption spectroelectrochemical cells are similar, and the difference is observed in the piece (6) located in the top of the cell. In the UV-Vis spectroelectrochemical case, this piece is used for the placement of the optical fiber in normal configuration and is not an optical window. Experimental UV-Vis absorption spectroelectrochemical setup, Figure S2a (Supporting Information), consists of a QE65000 Spectrometer (Ocean Optics) made up of a 1044×64 element diode array synchronized with the AUTOLAB PGSTAT 20 potentiostat. The light beam, supplied by a deuterium-halogen light source (Avalight-DH-S, Avantes) was both conducted to and collected from the spectroelectrochemical cell by a reflection probe (RP-200-7-UV-Vis, Ocean Optics). The reflection probe was a bifurcated bundle consisting of six illumination fibers around one central read fiber. UV-Vis absorption measurements were carried out in a near-normal reflection configuration where the incident beam was perpendicular to the electrode surface and the reflected light was collected by the central read fiber of the reflection probe and conducted to the spectrometer.
3. Results and Discussion
Different complexing agents were selected to study their influence in the AgNPs electrogeneration process. Raman and UV-Vis absorption spectroelectrochemistry allow us to observe the changes of the surface morphology during the metal electrodeposition. Three complexing agents, with different stabilities of their Ag-complexes were selected, in particular cyanide (CN-), ethylenediaminetetraacetic acid (EDTA) and ethylenediamine (en). In order to study the silver reduction potential a linear voltammetry was performed in an aqueous solution that contains 4.8×10⁻³ M AgNO3, 0.4 M KNO3 as supporting electrolyte and 2.8×10⁻² M of
complexing agent. Figure 1 shows the reduction linear voltammograms of Ag+ in presence of different complexing agent. A blank experiment was carried out in a complexing agent free solution (blue line Figure 1). In this case, Ag+ reduction occurs around +0.33 V. The presence of EDTA in the silver solution produces a slightly change in the reduction potential respect to the Ag+ reduction in absence of complexing agent solution, and this process is observed at lower potential (+0.28 V, orange line Figure 1). Although the reduction potential of Ag+ decreases to -0.03 V in presence of ethylenediamine (yellow line Figure 1), the most pronounced change takes place in presence of CN- (purple line in Figure 1). In this last case, Ag+ reduction occurs around -0.77 V, a potential significantly lower than those reported in the previous experiments.
intermediate values for Ag-ethylenediamine complexes (β1 = 5.01×10⁴, β2 = 5.01×10⁷) and the
lowest for Ag-EDTA complex (β1 = 2.09×10⁷).[54]
Figure 1. Electrochemical Ag+ reduction in presence of different complexing agents, CN -(purple line), ethylenediamine (yellow line), and EDTA (orange line). A linear voltammetry was performed in 4.8×10⁻³ M AgNO3, 0.4 M KNO3 and 2.8×10⁻² M of complexing agent solution. A
blank experiment was performed without complexing agent in the solution (blue line). Scan rate: 0.01 V s−1.
3.1.AgNPs electrodeposition in presence of cyanide.
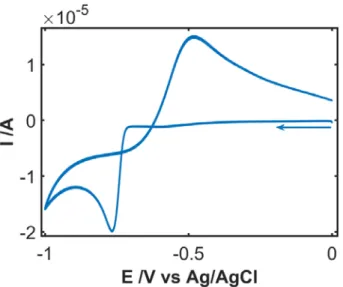
AgNPs electrodeposition and their redissolution was performed by cyclic voltammetry, scanning the potential from 0.00 V to -1.00 V and back to 0.00 V at a scan rate of 0.01 V s-1 in a 4.8×10⁻³ M AgNO3 solution that contains 0.4 M KNO3 as supporting electrolyte and 2.8×10⁻² M
KCN as complexing agent. As can be noticed in Figure 2, cyclic voltammogram shows a very small reduction peak around -0.60 V during the cathodic scan, which could be related to the silver underpotential deposition. However, the highest reduction peak is observed at -0.77 V, when Ag+ in solution is reduced. In the anodic scan, the voltammogram shows a broad anodic peak around -0.48 V related to the oxidation of AgNPs.
Figure 2. Cyclic voltammogram performed in AgNO3 4.8×10⁻³ M, KCN 2.8×10⁻² M and KNO3
0.4 M solution. The potential was scanned from 0.00 V to -1.00 V and back to 0.00 V at 0.01 V s−1.
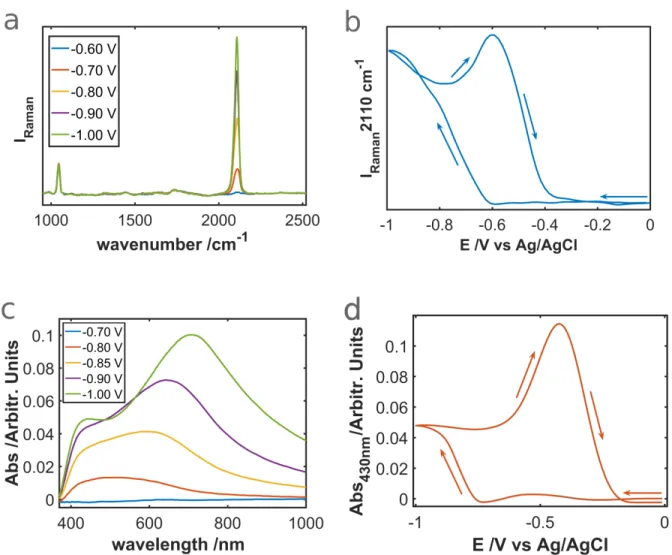
Figure 3a displays Raman spectra recorded during the forward scan of the cyclic voltammetry. A strong vibrational band at 2110 cm-1 related to C≡N frequency vibration, ʋ(C≡N),[55,56]
is not observed from 0.00 V to -0.60 V due to AgNPs formation does not start, and therefore, SERS substrate is not generated. At -0.62 V Ag+ reduction starts, SERS substrate is formed and consequently, Raman intensity of CN- band increases. The intensity of this band increases at negative potentials, reaching a maximum at the end of the forward scan. During the backward scan, the intensity decreases from -1.00 V to -0.78 V because the properties of the AgNPs generated are changing, and SERS substrate is modified. From -0.78 V to -0.60 V, Raman intensity increases due to the metal substrate acquires better characteristics for SERS effect. However, from -0.60 V downwards the intensity of the band decreases abruptly due to the oxidation and redissolution of AgNPs.
distinguished in the respective spectra. Cyanide Raman band begins to grow at -0.62 V when the first reduction process takes places (Figure 2). On the other hand, UV-Vis plasmon band increases at more negative potential, around -0.75 V. Hence, the first reduction process observed at -0.60 V in the cathodic scan (Figure 2) produces the deposition of very small AgNPs without plasmon band but with enough SERS properties to provide the enhanced cyanide Raman band.
Figure 3. (a) Raman spectra recorded during the forward scan, integration time: 1600 ms. (b)
Figure S3 (Supporting Information) displays UV-Vis spectra recorded during the backward scan (Figure S3a) and evolution of maximum of plasmon band with potential (Figure S3b). Comparison of Figure 3d and Figure S3 (Supporting Information) provides more information of the spectroelectrochemical behaviour during the electrochemical generation and redissolution of AgNPs. In the backward scan, from -1.00 V to -0.60 V, the maximum of the plasmon band moves fast to longer wavelengths, indicating a change in NPs shape. At -0.48 V the band centered at longer wavelengths is blue-shifted and the intensity decreases to obtain only one band at 430 nm related to spherical AgNPs. Finally, as can be noticed in Figure S3a (Supporting Information), from -0.40 V to 0.00 V the redissolution of AgNPs takes place and the band centered at 430 nm vanishes.
During the electrodeposition of silver in presence of cyanide, the evolution of Raman spectra with the composition of the solution is particularly interesting. Electrodeposition of AgNPs was performed by cyclic voltammetry, scanning the potential from 0.00 V to −1.00 V and back to 0.00 V at a scan rate of 0.01 V s−1 in an aqueous solution that contains 4.8×10⁻³ M AgNO3, 0.4
M KNO3 and different concentration of KCN (from 2.8×10⁻² M to 2.8×10⁻¹¹ M). Figure 4 shows
Raman spectra recorded when the highest SERS effect for the cyanide band is observed during the electrodeposition process. Figure 4 demonstrates that the intensity and position of the υ(C≡N) Raman band depends on the cyanide concentration and thus, on the AgNPs generated on the electrode surface. Chemistry of Ag-CN- establishes the formation of different complexes:
[51,60]
Ag(CN)2- + CN-⇆ Ag(CN)32- υRaman= 2105-2110 cm-1 (eq. 3)
Ag(CN)32- + CN-⇆ Ag(CN)43- υRaman= 2090-2100 cm-1 (eq. 4)
As can be noticed in Figure 4, Raman spectra are completely different depending on the cyanide concentration. For the highest cyanide concentration (2.8×10⁻² M), a strong vibrational band around 2110 cm-1 is observed (purple line in Figure 4), corresponding to the most stable complex, Ag(CN)43- (eq. 4). According to previous work,[51] a clear red-shifting of this cyanide
band is observed when the concentration of cyanide is lowered, due to the generation of different cyanide complexes with a lower number of ligands. When cyanide concentrations were modified to 2.8×10⁻⁵ M and 2.8×10⁻⁸ M (orange and green lines in Figure 4, respectively) different complexes are distinguished. For the lowest concentration, 2.8×10⁻¹¹ M (blue line in Figure 4), even a very weak band is detected, showing the good analytical detection limit of SERS effect. It demonstrates that the spectroelectrochemical methodology is a good candidate to control the electrosynthesis of AgNPs and hence, to obtain SERS active substrates with excellent properties.
Figure 4. Raman spectra recorded when the highest SERS effect for the cyanide band is
voltammetry in AgNO3 4.8×10⁻³ M, 0.4 M KNO3 and different concentration of KCN: 2.8×10⁻²
M (purple line), 2.8×10⁻⁵ M (orange line), 2.8×10⁻⁸ M (green line) and 2.8×10⁻¹¹ M (blue line).
3.2. AgNPs electrodeposition in presence of ethylenediaminetetraacetic acid (EDTA).
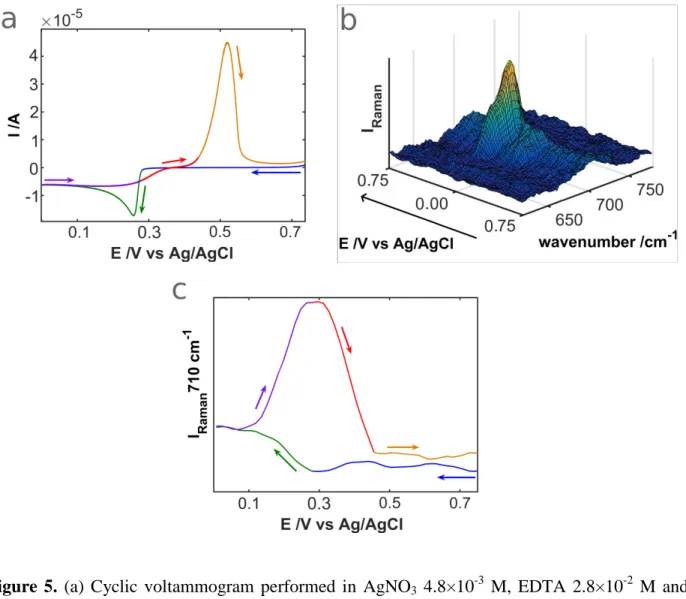
AgNPs electrodeposition was also performed in presence of EDTA by cyclic voltammetry, scanning the potential from +0.75 V to 0.00 V and back to +0.75 V at a scan rate of 0.01 V s-1 in a 4.8×10⁻³ M AgNO3 solution containing 0.4 M KNO3 as supporting electrolyte and 2.8×10⁻² M
places in a first oxidation step (+0.35 V) instead of during the second and well-defined oxidation process (+0.52 V).
Figure 5. (a) Cyclic voltammogram performed in AgNO3 4.8×10⁻³ M, EDTA 2.8×10⁻² M and
KNO3 0.4 M solution. The potential was scanned from +0.75 V to 0.00 V and back to +0.75 V at
0.01 V s−1. (b) 3D plot Raman signal/potential/Raman Shift obtained during the electrochemical experiment. (c) Evolution of Raman intensity band at 710 cm-1 with potential. Integration time: 1600 ms.
EDTA and KNO3 (solid both of them). As can be observed, a width Raman band of EDTA is
located at 710 cm-1, while KNO3 shows a narrow band located at 715 cm-1. Although
wavenumber and width of Raman band associated with Ag-EDTA complex match with band related to EDTA, bands observed in normal Raman spectra of anions can be shifted in wavenumber and broaden most notably due to changes in the surrounding environment, orientation effects in response to adsorption or a changing electric field, and due to changes in molecular bonding lengths upon adsorption onto multiple crystallographic facets of polycrystalline metal surface like AgNPs. In this way, Raman band at 710 cm-1 could be originated from either EDTA and/or KNO3. In the cyanide case, we have observed a very weak
band centered around 710 cm-1 that is not potential dependent as the band at 2110 cm-1 associated with cyanide complexes. Therefore, although the band centered at 710 cm-1 in presence of EDTA (Figure 5b) can be also assigned to the presence of KNO3, the evolution of
this band with potential (Figure 5c) demonstrates that it should correspond to Ag-EDTA complex. Moreover, chemical interaction of EDTA and AgNPs should be stronger than the one between NO3- and AgNPs as in the cyanide case.
determine the exact value. In the backward scan, only from +0.46 V onwards, the plasmon band is centered in the visible region of the spectrum (yellow segment in Figure 6b), just when AgNPs starts to be redissolved. Finally, at the end of the anodic scan, the potential is high enough to completely oxidize AgNPs, redissolving all NPs on the electrode surface. Therefore, when AgNPs disappear, SERS effect is also extinct.
Analysing UV-Vis spectra evolution, two absorption bands are observed in presence of EDTA when SERS effect is observed, one around 400 nm and other at wavelengths longer than 1000 nm, denoting asymmetrical nanoparticles. Position and intensity of the plasmon band is potential dependent, indicating that the shape of AgNPs is changing during the electrochemical synthesis.
Figure 6. (a) 3D plot UV-Vis absorbance/potential/wavelength obtained during the
electrochemical experiment performed in AgNO3 4.8×10⁻³ M, EDTA 2.8×10⁻² M and KNO3 0.4
M solution. The potential was scanned from +0.75 V to 0.00 V and back to +0.75 V at 0.01 V s−1. (b) Evolution of the maximum UV-Vis wavelength of the plasmon band with the potential.
AgNPs electrosynthesis and their redissolution in presence of ethylenediamine were carried out by cyclic voltammetry, scanning the potential from +0.60 V to -0.25 V and back to +0.60 V at a scan rate of 0.01 V s-1 in a 4.8×10⁻³ M AgNO3 solution containing 0.4 M KNO3 as
supporting electrolyte and 2.8×10⁻² M ethylenediamine as complexing agent (Figure 7a). Although the cyclic voltammogram is similar to the electrochemical response of the AgNPs electrodeposition with CN- and EDTA (Figure 2 and Figure 5a, respectively), the reduction peak is located at different potential (-0.03 V), as was indicated in Figure 1. Furthermore, as can be noticed in Figure 7b the spectroscopic information extracted from UV-Vis absorption spectra is completely different. Figure 7b displays the UV-Vis response during the spectroelectrochemical experiment, showing that a plasmon band around 420 nm evolves when the Ag+ reduction takes place. However, in this media, no waveform changes with potential are observed in the plasmon band. Therefore, only spherical AgNPs are generated during this electrodeposition process and they do not show shape changes.
Figure 7. (a) Cyclic voltammogram performed in AgNO3 4.8×10⁻³ M, ethylenediamine 2.8×10⁻²
Analysing the Raman spectra, surprisingly, no Raman bands of the ethylenediamine can be observed during the experiment. As can be deduced from the voltammogram and from the UV-Vis absorption spectra (Figure 7a and Figure 7b, respectively), the electrodeposition of AgNPs is guaranteed. Although a high value of absorbance is obtained, indicating that a high number of AgNPs are deposited on the electrode surface, there is not SERS effect under these experimental conditions. Therefore, we can assume that the interaction of the Ag-ethylenediamine complexes with the substrate (chemical effect) is not strong enough to observe SERS effect. This set of experiments, in an in-situ way during the generation of AgNPs, illustrates that not only the electromagnetic but also the chemical mechanism of SERS effect limit the enhancement of the Raman signal.
3.4.SEM characterization
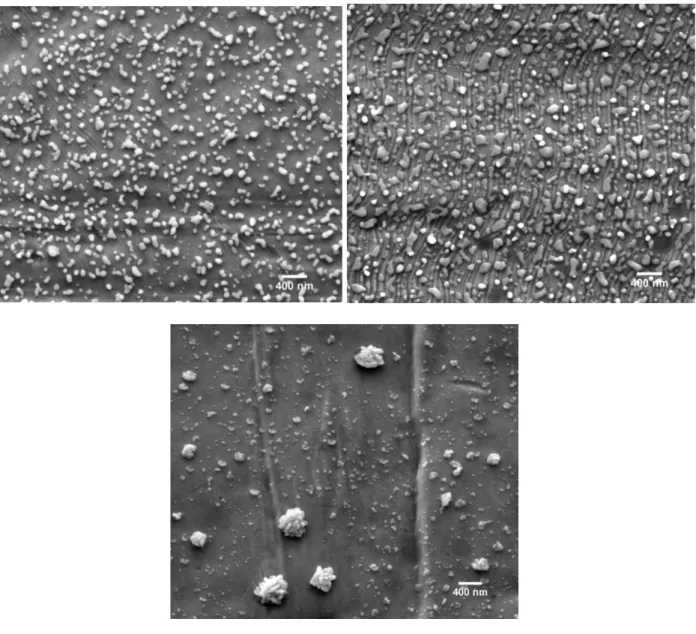
In order to characterize SERS substrates, SEM images of AgNPs formed in presence of different complexing agents were performed. Analysis of several samples prepared at different deposition stages allows us to analyze their specific properties. In the cyanide case and according to previous work,[62] when the experiment has finished, the plasmon band shows a spontaneously blue-shifting band centered on 420 nm that finally vanishes because cyanide media causes the dissolution of AgNPs.[59,63,64] Hence, an ex-situ characterization of the NPs is not possible when experiments are finished because the metal nanostructures have changed spontaneously.
Figure 8a. As can be noticed, spherical AgNPs with different size were formed (NPs from 10 nm to 90 nm are observed). Raman spectra demonstrate that spherical AgNPs generated in presence of EDTA shows SERS properties in this potential window (Figure 5c).
Furthermore, Figure 8b shows a SEM image of AgNPs electrogenerated in EDTA by cyclic voltammetry scanning the potential from +0.75 V to 0.00 V and back to +0.26 V at 0.01 V s-1. The stopping potential was selected before the first oxidation process shown in Figure 5a (red segment), +0.26 V, that coincides with the maximum value of the Raman band at 710 cm-1, Figure 5c. AgNPs (Figure 8b) show different shapes, not only spherical NPs are observed but also rods, triangular and amorphous AgNPs are distinguished. Comparison between Figures 8a and 8b, and the evolution of plasmon band (Figure 6b), allow us to conclude that SEM image and UV-Vis agree, because asymmetrical nanoparticles are formed. Besides, Figures 8a and 8b show another significant difference, in the second case when the potential is stopped in the backward scan (+0.26 V), AgNPs are flatter than AgNPs formed up to 0.00 V. Figure 8b demonstrates that, under the experimental conditions selected, flat AgNPs with different shapes yields better SERS response in presence of EDTA than spherical AgNPs.
response. In spite of the known excellent SERS properties of spherical AgNPs, this work shows that isolated agglomerates do not yield a detectable SERS response using the same experimental conditions for obtaining Raman spectra that the ones used in the electrosynthesis of AgNPs in presence of EDTA or cyanide.
Figure 8. SEM image of AgNPs generated in presence of EDTA at different deposition stages:
4. Conclusions
Time-resolved Raman spectroelectrochemistry, in which the combination of two analytical instrumental techniques simultaneously provides information of different nature, has been demonstrated as a very powerful technique to the in-situ study of the electrogeneration of AgNPs on an electrode surface. Complementary information has been obtained by UV-Vis absorption spectroelectrochemistry, allowing us to elucidate shape changes of AgNPs generated during the whole electrochemical process and correlate them with changes in the SERS response. SERS effect of AgNPs in presence of three complexing agents (cyanide, ethylenediaminetetraacetic acid and ethylenediamine) shows different behavior, confirming that SERS effect depends on the kind of complexing agent present in the media. Cyanide, in high concentration, produces the modification of the shape of AgNPs, from spheres to other asymmetrical shapes with a higher SERS effect. However, at lower concentration of cyanide a red-shifting of the Raman band is observed due to the formation of Ag(CN)n(n-1)- complexes with lower number of ligands. It is
spectroelectrochemical techniques, allows us to study the electrogeneration of AgNPs in presence of three complexing agents with different adsorption properties as well as the scattering cross sections. Spectroelectrochemical results lead to conclude that SERS effect depends strongly on the complexing agents present in the media, i.e, on the probe molecule analyzed. According to the results shown in this work, we confirm, using time-resolved spectroelectrochemistry, that chemical mechanism is necessary for obtaining SERS effect and only the generation of NPs is not enough to produce SERS effect.
Acknowledgements
References
[1] M. A. Sanchez-Castillo, C. Couto, W. B. Kim, J. A. Dumesic, Angew. Chemie - Int. Ed.
2004, 43, 1140.
[2] M. D. Hughes, Y.-J. Xu, P. Jenkins, P. McMorn, P. Landon, D. I. Enache, A. F. Carley, G. A. Attard, G. J. Hutchings, F. King, E. H. Stitt, P. Johnston, K. Griffin, C. J. Kiely, Nature
2005, 437, 1132.
[3] Y. Horiguchi, T. Niidome, S. Yamada, N. Nakashima, Y. Niidome, Chem. Lett. 2007, 36, 952.
[4] C. S. Thaxton, C. A. Mirkin, J. Nam, Science (80-. ). 2003, 301, 1884.
[5] R. Gottesman, S. Shukla, N. Perkas, L. A. Solovyov, Y. Nitzan, A. Gedanken, Langmuir
243, 349.
[15] D. Ibañez, J. Garoz-Ruiz, D. Plana, A. Heras, D. J. Fermín, A. Colina, Electrochim. Acta
2016, 217, 262.
[23] C. Domingo, V. Resta, S. Sanchez-Cortes, J. V. García-Ramos, J. Gonzalo, J. Phys. Chem. C 2007, 111, 8149.
[24] Q. Wang, S. Bai, Y. Zhao, Z. Liu, Appl. Surf. Sci. 2014, 303, 312.
[25] A. M. Boies, J. T. Roberts, S. L. Girshick, B. Zhang, T. Nakamura, A. Mochizuki,
Nanotechnology 2009, 20, 295604.
[26] M. Tsuji, M. Hashimoto, Y. Nishizawa, M. Kubokawa, T. Tsuji, Chem. - A Eur. J. 2005,
11, 440.
[27] I. D. G. Macdonald, W. E. Smith, Langmuir 1996, 12, 706.
[48] C. L. Brosseau, F. Casadio, R. P. Van Duyne, J. Raman Spectrosc. 2011, 42, 1305. [49] C. Ruan, W. Wang, B. Gu, J. Raman Spectrosc. 2007, 38, 568.
[50] E.-O. Ganbold, J.-H. Park, U. Dembereldorj, K.-S. Ock, S.-W. Joo, J. Raman Spectrosc.
2011, 42, 1614.
[51] D. Ibañez, C. Fernandez-Blanco, A. Heras, A. Colina, J. Phys. Chem. C 2014, 118, 23426. [52] C. Fernandez-Blanco, D. Ibañez, A. Colina, V. Ruiz, A. Heras, Electrochim. Acta 2014,
145, 139.
[53] D. Ibañez, E. C. Romero, A. Heras, A. Colina, Electrochim. Acta 2014, 129, 171.
Graphical abstract