Liver-speci
fi
c ablation of insulin-degrading enzyme causes hepatic
insulin resistance and glucose intolerance, without affecting insulin
clearance in mice
Pablo Villa-Pérez
a, Beatriz Merino
a, Cristina M. Fernández-Díaz
a, Pilar Cidad
a, Carmen D. Lobatón
a,
Alfredo Moreno
a, Harrison T. Muturi
b,e, Hilda E. Ghadieh
b,e, Sonia M. Najjar
b,e, Malcolm A. Leissring
c,
Irene Cózar-Castellano
a, Germán Perdomo
d,⁎
aInstituto de Biología y Genética Molecular, University of Valladolid-CSIC, Valladolid, Spain b
Department of Biomedical Sciences, Ohio University, USA c
Institute for Memory Impairments and Neurological Disorders, University of California, UCI MIND, Irvine, CA, USA d
Departamento de Ciencias de la Salud, Universidad de Burgos, Burgos, Spain e
Diabetes Institute, Heritage College of Osteopathic Medicine, Ohio University, USA
a b s t r a c t
a r t i c l e i n f o
Article history:
Received 23 March 2018 Accepted 6 August 2018 Available online xxxx
The role of insulin-degrading enzyme (IDE), a metalloprotease with high affinity for insulin, in insulin clearance remains poorly understood. OBJECTIVE: This study aimed to clarify whether IDE is a major mediator of insulin clearance, and to define its role in the etiology of hepatic insulin resistance.
Methods:We generated mice with liver-specific deletion ofIde(L-IDE-KO) and assessed insulin clearance and action. Results:L-IDE-KO mice exhibited higher (~20%) fasting and non-fasting plasma glucose levels, glucose intolerance and insulin resistance. This phenotype was associated with ~30% lower plasma membrane insulin receptor levels in liver, as well as ~55% reduction in insulin-stimulated phosphorylation of the insulin receptor, and its downstream signaling molecules, AKT1 and AKT2 (reduced by ~40%). In addition, FoxO1 was aberrantly distributed in cellular nuclei, in parallel with up-regulation of the gluconeogenic genesPck1andG6pc. Surprisingly, L-IDE-KO mice showed similar plasma insulin levels and hepatic insulin clearance as control mice, despite reduced phosphorylation of the carcinoembryonic antigen-related cell adhesion molecule 1, which upon its insulin-stimulated phosphorylation, promotes receptor-mediated insulin uptake to be degraded.
Conclusion:IDE is not a rate-limiting regulator of plasma insulin levels in vivo.
© 2018 The Authors. Published by Elsevier Inc. This is an open access article under the CC BY license (http:// creativecommons.org/licenses/by/4.0/). Keywords:
Insulin-degrading enzyme Hepatic insulin resistance Insulin receptor
Carcinoembryonic antigen-related cell adhe-sion molecule 1
1. Introduction
Insulin-degrading enzyme (IDE) is a 110-kDa
zinc-metalloendopeptidasefirst identified and named based on its ability to
bind to and degrade insulin [1]. IDE also degrades several other
intermediate-sized (b80 amino acids) bioactive peptides, including
gluca-gon, amylin and the amyloidβ-protein [2]. IDE is ubiquitously expressed
at varying levels in both insulin-responsive and -nonresponsive cell types. Subcellularly, the protease is primarily cytosolic, but it has been reported to exist within a number of intracellular vesicles, and organelles, as well as being associated with membranes, and secreted into the extracellular
space [1,3–6]. This wide distribution suggests a dynamic and
multifunc-tional role for IDE.
Because IDE has a high affinity for insulin (KM= ~100 nM), it has
been proposed as the major enzyme responsible for its catabolism
[3,7]. In vivo, insulin is produced and secreted by pancreaticβ-cells,
which is delivered through the portal venous system to the liver, where it is primarily cleared, although kidneys and other tissues also
degrade the hormone [1]. Infirst-pass transit, the liver removes ~50%
of circulating insulin. Although the detailed molecular mechanisms of hepatic insulin clearance are not fully understood, insulin uptake and intracellular degradation is a receptor-mediated process that occurs
after the binding of the hormone to its receptor (IR) [8]. The
insulin-IR complex is endocytosed via clathrin-coated vesicles and is primarily delivered to endosomes. In the acidic milieu of the endosomes, insulin dissociates from the IR, at which point insulin is believed to be de-graded by IDE, and the receptor is recycled back to the plasma
mem-brane [1]. In recent years, a role for the carcinoembryonic
antigen-related cell adhesion molecule 1 (CEACAM1) in promoting
receptor-mediated insulin uptake has emerged [9]. Upon its phosphorylation
by the receptor, CEACAM1 binds to and increases the rate of the ⁎ Corresponding author at: Universidad de Burgos, Facultad de Ciencias de la Salud,
Departamento de Ciencias de la Salud, P.O. Comendadores s/n (Antiguo Hospital Militar), 09001 Burgos, Spain.
E-mail address:[email protected](G. Perdomo).
https://doi.org/10.1016/j.metabol.2018.08.001
0026-0495/© 2018 The Authors. Published by Elsevier Inc. This is an open access article under the CC BY license (http://creativecommons.org/licenses/by/4.0/).
Contents lists available atScienceDirect
Metabolism Clinical and Experimental
insulin-receptor complex uptake to be targeted to the cellular degra-dation pathways, contributing to the regulation of systemic insulin
concentrations [10].
The physiological role of IDE in insulin clearance in vivo began to be
clarified with the study of mice with global null mutation ofIde(IDE-KO
mice). Consistent with a functional role for IDE in hepatic insulin clearance, IDE-KO mice exhibit chronic hyperinsulinemia resulting
from impaired insulin clearance [11,12]. They also exhibit marked
glucose intolerance and insulin resistance [11,12]. These results spurred
the notion that transient and/or partial inhibition of IDE may represent a new pharmacological approach against type 2 diabetes (T2DM)
[11,13,14]. However, pharmacological inhibition of IDE in mice caused
contradictory observations regarding glucose homeostasis [15–17].
Furthermore, genetic polymorphisms within or near theIde locus
have been linked to increased, rather than decreased, risk for T2DM
[18–22].
Therefore, the role of IDE in insulin clearance, and how this may
modulate insulin resistance remain to be clarified. To address these
questions, we ablatedIdeexpression exclusively in hepatocytes, the
major site of insulin clearance, and investigated its effect on insulin clearance and action.
2. Material and Methods
2.1. Mice Generation and Genotyping
Mice were fed standard rodent chow diet and water ad libitum in ventilated cages under a 12:12-h light-dark cycle at the animal facility of the University of Valladolid (UVa). L-IDE-KO mice were generated from crosses between the B6.Cg-Tg(Alb-cre)21Mgn/J
mouse (Alb-Cre mouse (The Jackson Laboratory, USA) that
ex-pressesCrerecombinase cDNA from the mouse albumin (Alb)
pro-moter [23], and the Ide flox/flox mouse on the C57BL/6 J (B6)
background (from Dr. Malcolm A. Leissring, University of California,
Irvine). This mouse hasloxPsitesflankingexon 3of theIdegene.Cre
recombinase-mediated deletion ofexon 3causes a frameshift with
two stop codons inexon 4and early termination of translation.
Twenty-three independent cohorts (males and females) of the F3 generation were used for metabolic studies and tissue collection. The IDE-KO mice were kindly provided by Dr. Malcolm A. Leissring
[11]. The Animal Care and Use Committee of the UVa approved all
experiments (protocol #5003931).
TheAlb-Cre+control mice did not show abnormal metabolic
pheno-type relative to the C57BL/6J mice that were used in backcrossing. As
Supplementary Table 1 reveals,Alb-Cre+controls manifested
compara-ble body weight and visceral obesity to that of C57BL/6J, in addition to normoinsulinemia and normal insulin clearance (measured by steady-state molar ratio of C-peptide/insulin levels). These control mice also showed normal insulin and glucose tolerance by comparison to
C57BL/6J mice (Supplementary Fig. 1). Thus, we only usedIdeflox/flox;
+/+ as wildtype (WT) controls in these studies.
Mice genotyping was performed using genomic DNA isolated from
mouse tail as described previously [24], followed by three PCRs to
amplify:gapdh,IdeandAlb-Cregenes. Breeding strategy and
genotyp-ing of mice are detailed in the Supplementary Experimental Procedures.
2.2. Plasma Biochemistry
Fasting (16 h) and non-fasting (fed ad libitum) blood glucose and
plasma triglycerides levels were assessed as described previously [24].
Plasma mouse insulin and glucagon levels were assessed using human or mouse enzyme-linked immunosorbent (ELISA) assays following the manufacturer's instructions (Mercodia, Sweden). Plasma amylin
(Phoe-nix Pharmaceutical, USA) and amyloid (Aβ40) (Invitrogen, USA) levels
by ELISA assays following the manufacturer's instructions. Plasma C-peptide levels were assessed by ELISA (ALPCO, USA).
2.3. Hepatic Triglycerides and Glycogen Levels
Hepatic triglyceride content was assessed as described previously by
Perdomo et al. [25]. Liver glycogen content was assessed using the
Gly-cogen Assay Kit (Sigma-Aldrich, USA). Briefly, liver samples (10 mg)
were homogenized in 100μL of water supplemented with protease
and phosphatase inhibitor cocktails (Sigma-Aldrich, USA) on ice. Homogenates were boiled at 100 °C for 5 min to inactivate enzymes
and centrifuged 5 min at 12300 ×gat room temperature to remove
in-soluble materials. Homogenates were diluted 1:100 in hydrolysis buffer
up to afinal volume of 50μL and mixed with 2μL of Hydrolysis Enzyme
Mix for 30 min at room temperature. Glycogen concentration was de-termined by a coupled enzyme assay, which yields a colorimetric (570 nm) product, proportional to the glycogen present in the homogenate.
2.4. Metabolic Studies
To evaluate alterations in glucose homeostasis in vivo, we performed intraperitoneal glucose tolerance tests (IP-GTTs) and insulin tolerance
tests (IP-ITTs) as described previously [26]. In vivo plasma insulin
clear-ance was performed as described by Ahrén et al. [27] with some
modi-fications. Briefly, 3-month-old mice were fasted for 2 h, then
anesthetized using a solution of medetomidine plus ketamine at 0,125 mg/100 g body weight. Afterwards, human insulin (Humulin; Lilly, USA) was injected intra-orbitally at 1 nmol/kg and blood samples were collected from the tail vein 0, 5, 10, 20, 30 and 60 min after insulin
administration. Plasma human insulin levels were quantified using a
human ELISA kit (Mercodia, Sweden) following the manufacturer's instructions.
2.5. Quantitative Real-time PCR
Total RNA from homogenized mouse tissues was isolated using Trizol Reagent (Sigma-Aldrich, USA) following the manufacturer's protocol.
After DNAse treatment 500–1000 ng of RNA was used to synthesize
Ide
cDNA with the Transcriptor First Strand cDNA Synthesis Kit (Roche, USA). mRNA levels were determined by real time qPCR with TaqMan® probe-based assays on a Rotor-Gene 3000 instrument (Corbett Research)
using the 2−ΔΔCtrelative quantification method [28]. TaqMan® Gene
Ex-pression assay references (from Applied Biosystems, USA) were as
fol-lows: Mm00473077_m1 for Ide, Mm01247058_m1 for
phosphoenolpyruvate carboxykinase (Pck1), Mm00839363_m1 for
glucose-6 phosphatase (G6pc), Mm01211875_m1for insulin receptor
(Insr), and Mm00802831_m1 for insulin-like growth factor-1 receptor
(Igf1r). Expression data were normalized to the level of the housekeeping
gene of the ribosomal protein L18 (RPL18; Forward: 5′-AAGACTGCCGT
GGTTGTGG-3′; Reverse: 5′-AGCCTTGAGGATGCGACTC-3′; Probe: 5′
-FAM-TTCCCAAGCTGAAGGTGTGTGCA-BHQ1–3′).
2.6. Western Blot Analysis
Western blot analyses on isolated mouse tissues, and subcellular
lo-calization of FoxO1 are detailed in theSupplementary Experimental
Pro-cedures. Rabbit anti-FoxO1 antibody was used as described by Qu et al.
[29]. For co-immunoprecipitation experiments, polyclonal antibodies
against Shc (B-9) was used to immunoprecipitate proteins from tissue
lysates as previously described [30,31].
2.7. Analysis ofβ-Cell Function, Pancreatic Histology and Histomorphometry
To assesβ-cell function, mice were fasted overnight followed by an i.
p. injection of a bolus of glucose. Blood samples were drawn, and plasma insulin levels were measured during 30 min. as described above.
After-wards, mice were euthanized and pancreata dissected,fixed in 10%
neu-tral buffer formalin, paraffin embedded, and sectioned as described
previously [32]. For islets histomorphometry, sections were stained
with anti-insulin antibody (Abcam, UK).β-cell mass,β-cell area, the
number of islets, and the mean islets size were quantitated using the
ImageJ software (NIH, USA) as described previously [32].
2.8. Statistical Analyses
Statistical analysis of data was performed using Prism v. 6.0
(GraphPad Software). Distributions were checked with the
Kolmogorov-Smirnov test. Data are presented as means ± SEM. Com-parisons between two groups were done using the unpaired Students'
t-test. Comparisons between more than two groups were done using
the one-way ANOVA (Bonferroni test for post-hoc analyses).
Differ-ences were considered significant atpb0.05.
B
A
Blood glucose
(mg/dL)
0 50 100
150 Non-Fasting
*
Bod
y
weight (g)
0 10 20
30 Non-Fasting
Blood glucose
(mg/dL)
0 20 40 60 80 100
*
FastingBod
y weight (g)
0 10 20
30 Fasting
C
D
E
Food Intake
[kcal/bod
yweight (g)]
WT L-IDE KO
WT L-IDE KO
WT L-IDE KO
WT L-IDE KO
WT L-IDE KO
0.0 0.5 1.0 1.5
3. Results
3.1. Generation and Molecular Characterization of Liver-specific IDE Knock-out Mice
3-month-old male and femaleIdeflox/flox;+/+ mice (henceforth,
wildtype-WT) andIdeflox/flox;Alb-Cre/+(L-IDE-KO) mice were studied.
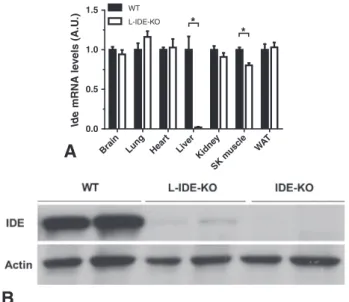
HepaticIdemRNA (Fig. 1A) and protein levels (Fig. 1B) were decreased
by ~90–100% in L-IDE-KO mice, compared to controls. No differences in
IDE expression were observed in other tissues, except for a ~20%
reduc-tion inIdemRNA levels without changes in IDE protein levels in skeletal
muscle (data not shown). Considering that hepatocytes make up ~85% of liver cells, it is likely that the minimal amount of IDE detected in
liver of L-IDE-KO mice reflects residual expression from
nonparenchymal liver cells (sinusoidal cells, endothelial, Kupffer cells, etc.) As expected, IDE-KO mice did not express IDE protein in the liver (Fig. 1B).
3.2. Hepatic IDE Deletion Leads to Glucose Intolerance and Insulin Resistance, but without Altered Insulin Metabolism
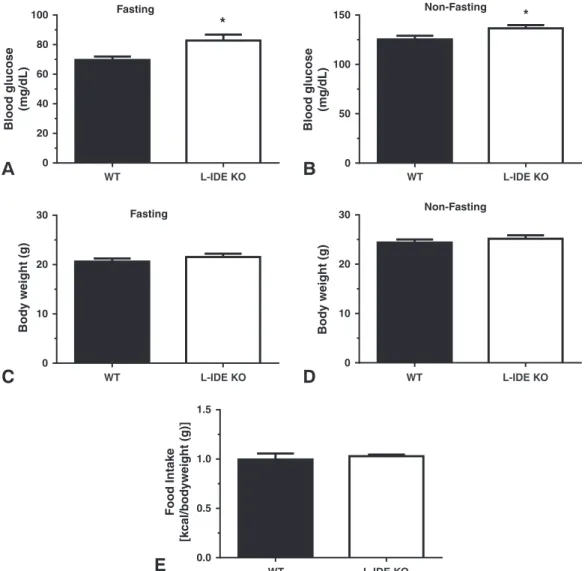
At 3 months of age, male (Fig. 2A–B) and female (Supplementary
Fig. 2A–B) L-IDE-KO mice showed higher fasting and non-fasting
blood glucose levels, as compared to WT controls. These changes in glu-cose homeostasis were not correlated with an increase in body weight (Fig. 2C–D and Supplementary Fig. 2C–D) or food intake (Fig. 2E). Con-sistent with this metabolic phenotype, L-IDE-KO mice exhibited glucose
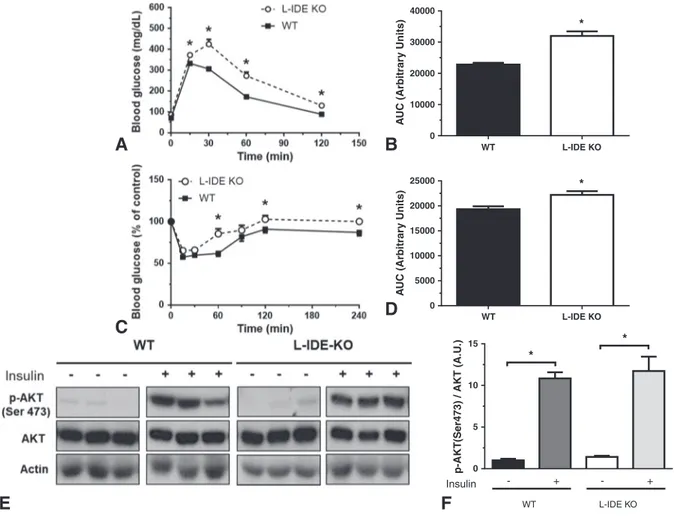
intolerance and insulin resistance (Fig. 3A–D and Supplementary Fig. 3).
The insulin resistance observed in L-IDE-KO mice was not correlated with blunted insulin-signaling in the skeletal muscle, as shown by intact phosphorylation of protein kinase B (PKB; AKT1) in response to insulin (Fig. 3E–F).
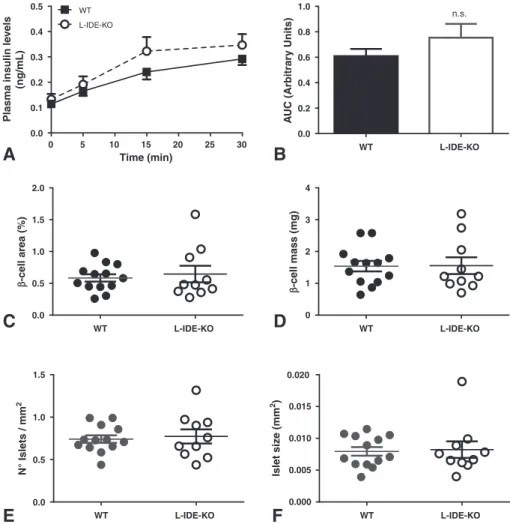
Typically, insulin resistance is associated with hyperinsulinemia, but surprisingly, fasting and non-fasting plasma insulin levels were similar
between L-IDE-KO and control mice (Fig. 4A–B; Supplementary Fig.
A
UC (Arbitrar
y
Units)
0 10000 20000 30000 40000
*
A
UC (Arbitrar
y
Units)
WT L-IDE KO
WT L-IDE KO
0 5000 10000 15000 20000
25000
*
F
p-AKT(Ser473) / AKT (A.U
.)
0 5 10 15
WT L-IDE KO
Insulin
-*
*
B
D
A
C
E
+ - +
Fig. 3.L-IDE-KO mice exhibit impaired glucose homeostasis and insulin resistance.(A)IP-GTT of 3-month-old male mice. Data are mean ± SEM. n = 12–13 per genotype. *pvalueb0.05 vs. WT by Students' t-test.(B)Area under the curve of the IP-GTT. *pvalueb0.05 vs. WT by Students' t-test.(C)IP-ITT of 3-month-old male mice. Data are mean ± SEM. n = 12–13 per genotype. *pvalueb0.05 vs. WT by Students't-test.(D)Area under the curve of the IP-ITT. *pvalueb0.05 vs. WT by Students't-test.(E)Lack of effect of liver-specific IDE deletion on AKT signaling in skeletal muscle. Representative western blots depicting basal and insulin-stimulated p-AKT levels in skeletal muscle. Grouping of images from different parts of the same gel have been used for thefinal arrangement of thefigure (see Supplementary Fig. 4 for full blots).(F)Densitometric analysis of Ser-473-Akt phosphorylation. They-axis represents the ratio of phosphorylated versus total protein in arbitrary units. Data are mean ± SEM.n= 6 per genotype. *pvalueb0.05 vs. saline treatment by ANOVA.
p-IR
β
/ IR
β
(A.U.)
0 5 10 15 20 25
*
* #
IR
β
/ Na+/K+-A
TPase (A.U.)
0.0 0.5 1.0
1.5 #
&
p-AKT1(Ser473) /
AKT1 (A.U.)
0 2 4 6
*
* #
p-AKT2(Ser474) /
AKT2 (A.U.)
0 2 4 6
* *
#
p-CEACAM1 / CEACAM1 (A.U.) 0 5 10 15
20 * #
B
A
Insulin
-
WT
+
L-IDE-KO
-
+
Insulin-
WT
+
L-IDE-KO
-
+
IGF-IR / Na
+/K + -A
TPase (A.U.)
0.0 0.5 1.0 1.5 2.0
5A–B). Thesefindings cast doubt on the notion that IDE is the principal
protease regulating insulin catabolism in vivo [11], and that plasma
in-sulin clearance depends on the protease activity of IDE in the liver [1]. To
directly assess the role of IDE in hepatic insulin clearance, we performed
an in vivo plasma insulin clearance assay. As shown inFig. 4C–D, male
L-IDE-KO mice (and female, Supplementary Fig. 5C–D) exhibited similar
rates of plasma insulin clearance as controls. Likewise, insulin clearance
measured as steady-state C-peptide/insulin molar ratio [10] was similar
between L-IDE-KO and WT controls (Fig. 4E–G).
Like insulin, plasma glucagon, amylin and Aβ40 levels remained
un-changed in L-IDE-KO as compared to WT controls (Fig. 4H–K).
3.3. IDE Is Necessary for Hepatic Insulin Signaling
To help elucidate the molecular basis underlying the insulin resis-tance observed in L-IDE-KO mice, we analyzed multiple components of the intracellular insulin-signaling pathway in liver tissue, a key organ involved in the regulation of whole-body glucose homeostasis. To this end, 3-month-old male L-IDE-KO and WT mice were fasted over-night, then administered an intraperitoneal injection of a bolus of insu-lin (0.75 U/kg) or sainsu-line solution. Ten minutes later, mice were euthanized, and tissues were dissected.
HepaticIdedeletion resulted in a mild (~30%) but significant
reduc-tion of IR protein level in the plasma membrane fracreduc-tions from L-IDE-KO
livers, as demonstrated by Western blot analysis (Fig. 5A-B).
Further-more, its insulin-stimulated phosphorylation was reduced by ~55% in
L-IDE-KO mice, compared to controls (Fig. 5A–B). Consequently,
insulin-stimulated phosphorylation of its substrate, CEACAM1, was completely abolished despite no change of its hepatic basal expression
byIdedeletion (Fig. 5A-B).
Because L-IDE-KO mice manifested a marked reduction of CEACAM1 phosphorylation in response to insulin, we hypothesized that it would be associated with changes in the internalization of the complex insulin-IR-CEACAM1. To address this question, we carried out
co-immunoprecipitation experiments to detect whether deletingIde
af-fects insulin-stimulated association between Shc and CEACAM1, a
criti-cal step in the insulin's internalization process [30,33,34]. AsFig. 5C
shows, immunoblotting the Shc immunopellet with CEACAM1 antibody indicated 1.5-fold increase in the Shc/CEACAM1 binding in response to insulin in the controls but not the IDE null mice.
On the other hand, the insulin-like growth factor-1 receptor (IGF-IR) exhibits 70% homology to IR, and in response to insulin shares some of the signaling pathways with the IR. Western blot analyses revealed
that hepaticIdedeletion did not reduce IGF-IR protein levels in the
plasma membrane fractions from L-IDE-KO livers (Fig. 5A-B). Likewise,
InsrandIgf1rmRNA levels were similar between WT and L-IDE-KO mice
in fasting and non-fasting conditions (Supplementary Fig. 7). Taken
to-gether, these results support the notion that hepaticIdeablation alters
posttranslational events of the IR in L-IDE-KO mice without affecting the related IGF-IR.
To further analyze downstream effects of hepatic IDE depletion on insulin signaling, we examined AKT1 and AKT2 phosphorylation in
total liver lysates. AKT1 phosphorylation, which is chiefly involved in
cell survival, protein synthesis and inhibition of apoptosis, and AKT2 phosphorylation, which is exclusively involved in metabolism, were
both reduced, exhibiting significant reductions of ~40–45% (Fig. 5A-B).
3.4. Hepatic Ablation of IDE Causes Up-regulation of Gluconeogenic Genes
A hallmark of hepatic insulin resistance is augmented production of glucose. The forkhead box O1 (FoxO1) is a nuclear transcription factor downstream of AKT that integrates insulin signaling with gluconeogen-esis in the liver, by upregulating the expression of the gluconeogenic
genesPck1andG6pc[29]. In response to insulin, FoxO1 is
phosphory-lated, resulting in its nuclear exclusion and inhibition ofPck1andG6pc
gene expression. Hepatic insulin resistance reduces FoxO1
phosphory-lation, which results in unleashed gluconeogenesis [35]. To determine
whether the increased blood glucose levels observed in L-IDE-KO mice were associated with activation of gluconeogenesis, we prepared cyto-plasmic and nuclear fractions of liver tissues from WT and L-IDE-KO
mice treated with saline or insulin for 10 min. As shown inFig. 6A,
FoxO1 proteins were detected predominantly in the cytoplasmic frac-tions after stimulation with insulin in WT mice. In contrast, in L-IDE-KO mice, FoxO1 underwent a substantial subcellular redistribution, shifting from the cytoplasmic fraction to the nuclear fraction upon
expo-sure to insulin (Fig. 6A). This was correlated with up-regulation ofPck1
andG6pcmRNA expression levels under either fasting or non-fasting
conditions (Fig. 6B–C).
In addition to FoxO1, AKT phosphorylates and deactivates glycogen synthase kinase 3 (GSK-3), leading to activation of glycogen synthase
(GS) and thus, inducing glycogen synthesis [36]. To examine the effect
of IDE depletion on glycogenesis, we quantified phosphorylation levels
of GSK-3 from WT and L-IDE-KO mice treated with saline or insulin
for 10 min. AsFig. 6D revels, insulmediated AKT phosphorylation
in-activates GSK-3, which in turn restores GS activity and glycogen synthe-sis in WT mice. Unexpectedly, relative to WT mice, basal GSK-3 phosphorylation was 3.5-fold higher in L-IDE-KO mice and, moreover, insulin treatment failed to result in increased phosphorylation (Fig. 6D). To explore the functional impact of these perturbations, we analyzed glycogen levels in L-IDE-KO and WT livers. Surprisingly,
he-paticIdeablation had no effect on liver glycogen levels, under either
fasting (Fig. 6E) or non-fasting (Fig. 6F) conditions. Taken together,
this suggests thatIdedeficiency in liver must result in other, as-yet
un-identified mechanisms that compensate for the lack of the expected
ef-fect of AKT on GSK-3 phosphorylation and hepatic glycogen content. Because insulin also regulates hepatic lipid metabolism via an AKT2
phosphorylation-dependent mechanism [37], we then assessed
triglyc-erides levels in the plasma and livers of 3-month-old WT and L-IDE-KO male mice. Hepatic triglyceride content remained similar between WT
and L-IDE-KO mice under either fasting (Fig. 6G) and non-fasting
condi-tions (Fig. 6H). Similarly, circulating plasma triglycerides levels were
comparable in both mouse groups regardless of the feeding status (Fig. 6I-J).
3.5.β-Cell Function and Histomorphometry in the L-IDE-KO Mice
To assesβ-cell function, we monitored plasma insulin levels
follow-ing an i.p. glucose injection after an overnight fastfollow-ing period in WT and
L-IDE-KO mice. AsFig. 7A-B shows, plasma insulin levels during IP-GTT
were similar between WT and L-IDE-KO mice. Consistently, fasting and non-fasting plasma C-peptide levels remained unchanged between
L-IDE-KO mice and littermate controls (Fig. 4E–F). In addition, we have
assessedβ-cell mass and the number of islets by histomorphometry in
WT and L-IDE-KO mice. As shown inFig. 7C–F,β-cell mass,β-cell area,
Fig. 5.HepaticIdedeficiency causes multiple changes to intracellular insulin-signaling pathways.(A)Representative Western blots depicting the effects of insulin on total and phosphorylated IR, IGF-IR, CEACAM1, AKT1 and AKT2 levels. Expression of actin and Na+
/K+
B
Pck1
mRNA le
vels (A.U
.)
Fasting Non-Fasting 0.0
0.5 1.0 1.5
WT L-IDE KO
* *
G6p6
mRNA le
vels (A.U
.)
Fasting Non-Fasting 0.0
0.5 1.0 1.5
WT L-IDE KO
* *
C
E
F
A
D
T
rigl
y
ceride le
vels
(mg/g liver)
WT L-IDE KO 0
10 20 30 40
50 Fasting
T
rigl
y
ceride le
vels
(mg/g liver)
WT L-IDE KO 0
100 200
300 Non-Fasting
G
H
I
J
Plasma trigl
yceride
le
vels (mg/dL)
WT L-IDE KO 0
20 40
60 Fasting
Plasma trigl
yceride
le
vels (mg/dL)
WT L-IDE KO 0
50 100 150
200 Non-Fasting
Fig. 6.Effects ofIdedeletion on gluconeogenesis and glycogenesis.(A)Subcellular distribution of basal and insulin-stimulated FoxO1 in L-IDE-KO and WT mice.Upper panel: ratio of cytoplasmic vs. nuclear FoxO1 levels.Lower panel: representative image of cytoplasmic and nuclear fractions containing FoxO1. Data are mean ± SEM.n= 4 per genotype and condition. *pvalueb0.05 vs. saline treatment by ANOVA.#
pvalueb0.05 WT + insulin vs. L-IDE-KO + insulin treatment by ANOVA. Effects ofIdeablation on hepatic gluconeogenic gene expression. Livers from 3-month-old male L-IDE-KO and WT mice under fasting and non-fasting conditions were analyzed for mRNA levels ofPck1(B)andG6pc(C).Data are mean ± SEM. n = 3 in triplicate per genotype and condition. *pvalueb0.05 vs. WT by Students't-test.(D, E, F)Effects ofIdedeletion on glycogenesis signaling.(D)Upper panel: densitometric analyses of GSK-3α. They-axis represents the ratio of phosphorylated versus total protein in arbitrary units.Lower panel: representative western blots depicting basal and insulin-stimulated total and phosphorylated GSK-3α. Grouping of images from different parts of the same gel have been used for thefinal arrangement of thefigure (see Supplemen-tary Fig. 8 for full blots). Data are mean ± SEM. n = 6 per genotype and condition. *pvalueb0.05 vs. saline treatment by ANOVA.#
the number of islets, and the mean islets size were similar between both
genotypes. Taken together these results indicate thatβ-cell function
and mass are comparable in L-IDE-KO mice and WT mice.
4. Discussion
Using a mouse harboring liver-specific ablation ofIde, we show for
the first time that hepatic deficiency of Ide does not result in
hyperinsulinemia, as expected from deleting a protein that has been postulated to play a major role in hepatic insulin clearance. Extrahepatic tissues, such as kidneys, are also involved in insulin clearance in vivo,
al-beit to a lower extent than the liver [1]. However, IDE renal protein
levels were not induced in L-IDE-KO mice to compensate for the loss of IDE in liver (Supplementary Fig. 9). Therefore, normoinsulinemia in L-IDE-KO mouse rules out a major role for IDE in hepatic insulin clear-ance. Consistently, Durham et al. demonstrated that NTE-1, an inhibitor
of IDE, did not increase plasma insulin levels in rodents [16].
By excluding IDE as a significant mediator of insulin clearance
in vivo, we postulate that other proteins might be more critical in this process. This could include CEACAM1, a substrate of the IR in liver that, upon its phosphorylation, promotes the uptake of the insulin-receptor complex and its targeting to the degradation process
[9,10,38]. Hepatic loss-of-function of CEACAM1 by overexpressing its
dominant-negative phosphorylation-defective isoform, reduced insulin clearance to cause hyperinsulinemia followed by secondary insulin
re-sistance and impaired glucose tolerance [10]. CEACAM1 promotes
insu-lin clearance by inducing the rate of insuinsu-lin endocytosis via the less
abundant, high-affinity isoform A of the IR (IR-A) [33]. Upon its
phosphorylation on Tyr488 by the IR tyrosine kinase, via a mechanism requiring insulin-stimulated phosphorylation of the IR at Tyr1316, CEACAM1 recruits one or more molecules (including Shc) that bind to Tyr960 of the juxtamembrane domain of the IR to form a stable complex
with the IR, and induce its uptake into clathrin-coated pits/vesicles [33].
Hence, CEACAM1 phosphorylation is required but not sufficient to allow
receptor-mediated insulin endocytosis and degradation [33].
Our results demonstrate that in the absence of hepatic IDE, IR phos-phorylation is decreased, but that of CEACAM1 is disproportionally abro-gated. Thus, it is plausible that IDE participates in the internalization of the insulin-IR-CEACAM1 complex. Furthermore, hepatic depletion of IDE remarkably reduced insulin-stimulated association between Shc and CEACAM1, a critical step in the insulin's internalization process. It has been proposed that IDE is a multifunctional protein, which may perform unrelated functions as a scaffold protein involved in maintaining cellular
homeostasis [39]. Whether such a proposed function of IDE is dependent
on its protease activity, remains to be clarified. If IDE deletion completely
blunts CEACAM1 phosphorylation (and function), one would question how is circulating insulin being removed in L-IDE-KO mice? First, CEACAM1 regulates insulin clearance by modulating insulin uptake via the less abundant IR-A isoform in the liver. The contribution of the more abundant IR-B isoform in insulin clearance in L-IDE-KO mice remains to be elucidated. Second, at physiological concentrations of the hormone, he-patic insulin clearance is mediated primarily by IR in the hepatocyte. How-ever, the contribution of Kupffer cells to total insulin clearance in the liver is ~15%. Thus, it is possible that these cells compensate for the loss of
insu-lin clearance in hepatocytes. Third,β-cell function and mass are similar
be-tween L-IDE-KO and control mice, suggesting that plasma insulin levels are
A
B
not related to changes in insulin secretion. Fourth, following insulin disso-ciation from its receptor in the acidic environment of the endosomes, insu-lin undergoes degradation whereas the receptor recycles to the plasma membrane. Thus, in the absence of IDE, insulin is carried back to the circu-lation bound to its receptor. Further research is needed to fully understand the process of intact hepatic insulin clearance in the L-IDE-KO mouse.
On the other hand, we showed thatIdedeletion resulted in a
signif-icant ~30% reduction of the IR in the plasma membrane of hepatocytes from L-IDE-KO mice. Assuming that IDE does in fact degrade insulin in endosomes, depletion of IDE in hepatocytes might impair the removal of insulin and thereby impair the recycling of the IR to the cell surface. This scenario is in agreement with the observed effects of hepatic IDE depletion on plasma membrane IR levels in L-IDE-KO mice.
We herein demonstrate that ablation of hepaticIdecauses insulin
re-sistance independently of circulating insulin levels. Our results partially
coincide with those obtained by Farris et al. [12], and Abdul-Hay et al.
[11] that showed a marked insulin resistance with increased chronic
hyperinsulinemia in global IDE-KO mice. Systemic insulin resistance in these mice was hypothesized to emerge as a secondary compensatory response to chronic hyperinsulinemia. However, using the same
IDE-KO mice, Miller et al. [40] and Steneberg et al. [41], reported normal
plasma insulin levels in global IDE-KO mice. Nonetheless, our observa-tions on L-IDE-KO mice suggest that the controversial systemic insulin resistance and glucose intolerance exhibited by IDE-KO mice are at least in part, a consequence of hepatic insulin resistance.
Whereas the liver-specific IR knockout mice (LIRKO) share with
L-IDE-KO mice elevated plasma glucose levels, glucose intolerance and hepatic insulin resistance, they differ by developing chronic hyperinsulinemia in part, resulting from a failure to clear circulating
insu-lin by receptor-mediated endocytosis [42,43]. This suggests thatIdedefi
-ciency per se causes insulin resistance and glucose intolerance independently of hyperinsulinemia. From this point of view, our data identify a role for IDE in the molecular pathways underlining hepatic
insu-lin resistance, independently of their effect on glucagon, amyinsu-lin and Aβ40.
In summary, L-IDE-KO mice provides an in vivo evidence that the ab-sence of hepatic IDE causes insulin resistance, higher blood glucose levels, and glucose intolerance, through molecular mechanisms involving impaired hepatic insulin signaling and upregulation of gluconeogenic gene transcription. In agreement with previous studies
[16], this appears to occur via a mechanism that does not implicate its
role in hepatic insulin degradation.With the important caveat that
non-proteolytic functions of IDE might be operative in the observed phenotype, these results suggest that pharmacological inhibition of IDE are contraindicated in the treatment of type 2 diabetes.
Supplementary data to this article can be found online athttps://doi.
org/10.1016/j.metabol.2018.08.001.
Authorship
ICC and GP contributed to conception and design of the work. PVP, CMFD, CDL, AM, BM, HEG, ICC, and GP make substantial contributions to acquisition, analysis, and interpretation of data. PVP and PC per-formed gene expression analyses. HTM and SMN perper-formed western blots and analyses of CEACAM1 and co-IP experiments. ICC and GP par-ticipate in drafting the manuscript. HTM, SMN, MAL, ICC and GP partic-ipate in revising the manuscript critically for important intellectual content. The guarantors for the content of the article are Irene Cózar-Castellano and German Perdomo.
Conflict of Interest
We wish to confirm that there are no known conflicts of interest
as-sociated with this publication and there has been no significantfinancial
support for this work that could have influenced its outcome. We
con-firm that the manuscript has been read and approved by all named
au-thors and that there are no other persons who satisfied the criteria for
authorship but are not listed. We further confirm that the order of
au-thors listed in the manuscript has been approved by all co-auau-thors.
Acknowledgments
We thank Prof. Henry Dong for providing us with the anti-FoxO1 an-tibody, and for critical reading of the manuscript and fruitful discussions. The study was partially presented as a poster in the 53rd Annual Meet-ing of the European Association for the Study of Diabetes, Lisbon 2017.
Funding
This work was supported by grants from the Ministerio de Economía, Industria y Competitividad: SAF2014-58702-C2-1-R and 77871-C2-1-R to ICC; SAF2014-58702-C2-2-R and SAF2016-77871-C2-2-R to GP; supported by the EFSD European Research Pro-gramme on New Targets for Type 2 Diabetes supported by an educa-tional research grant from MSD to ICC and GP; the Naeduca-tional Institutes of Health: R01-DK054254, R01-DK083850 and RO1-HL-112248 to SMN, and R01-GM115617 to MAL; and the American Diabetes Associa-tion: Career Development Award 7-11-CD-13 to MAL.
References
[1]Duckworth WC, Bennett RG, Hamel FG. Insulin degradation: progress and potential. Endocr Rev 1998;19:608–24.
[2]Shen Y, Joachimiak A, Rosner MR, Tang WJ. Structures of human insulin-degrading enzyme reveal a new substrate recognition mechanism. Nature 2006;443:870–4.
[3]Authier F, Posner BI, Bergeron JJ. Insulin-degrading enzyme. Clin Invest Med 1996;19: 149–60.
[4]Bulloj A, Leal MC, Xu H, Castano EM, Morelli L. Insulin-degrading enzyme sorting in exosomes: a secretory pathway for a key brain amyloid-beta degrading protease. J Alzheimers Dis 2010;19:79–95.
[5]Farris W, Leissring MA, Hemming ML, Chang AY, Selkoe DJ. Alternative splicing of human insulin-degrading enzyme yields a novel isoform with a decreased ability to degrade insulin and amyloid beta-protein. Biochemistry 2005;44: 6513–25.
[6]Akiyama H, Shii K, Yokono K, Yonezawa K, Sato S, Watanabe K, et al. Cellular localization of insulin-degrading enzyme in rat liver using monoclonal antibodies specific for this enzyme. Biochem Biophys Res Commun 1988;155:914–22.
[7]Duckworth WC. Insulin degradation: mechanisms, products, and significance. Endocr Rev 1988;9:319–45.
[8]Bevan P. Insulin signalling. J Cell Sci 2001;114:1429–30.
[9]Heinrich G, Ghadieh HE, Ghanem SS, Muturi HT, Rezaei K, Al-Share QY, et al. Loss of hepatic CEACAM1: a unifying mechanism linking insulin resistance to obesity and non-alcoholic fatty liver disease. Front Endocrinol 2017;8:8.
[10]Poy MN, Yang Y, Rezaei K, Fernstrom MA, Lee AD, Kido Y, et al. CEACAM1 regulates insulin clearance in liver. Nat Genet 2002;30:270–6.
[11]Abdul-Hay SO, Kang D, McBride M, Li L, Zhao J, Leissring MA. Deletion of insulin-degrading enzyme elicits antipodal, age-dependent effects on glucose and insulin tolerance. PLoS One 2011;6:e20818.
[12]Farris W, Mansourian S, Chang Y, Lindsley L, Eckman EA, Frosch MP, et al. Insulin-degrading enzyme regulates the levels of insulin, amyloid protein, and the beta-amyloid precursor protein intracellular domain in vivo. Proc Natl Acad Sci U S A 2003;100:4162–7.
[13]Costes S, Butler PC. Insulin-degrading enzyme inhibition, a novel therapy for type 2 diabetes? Cell Metab 2014;20:201–3.
[14]Tang WJ. Targeting insulin-degrading enzyme to treat type 2 diabetes mellitus. Trends Endocrinol Metab 2016;27:24–34.
[15]Deprez-Poulain R, Hennuyer N, Bosc D, Liang WG, Enee E, Marechal X, et al. Catalytic site inhibition of insulin-degrading enzyme by a small molecule induces glucose intolerance in mice. Nat Commun 2015;6:8250.
[16]Durham TB, Toth JL, Klimkowski VJ, Cao JX, Siesky AM, Alexander-Chacko J, et al. Dual exosite-binding inhibitors of insulin-degrading enzyme challenge its role as the primary mediator of insulin clearance in vivo. J Biol Chem 2015;290: 20044–59.
[17]Maianti JP, McFedries A, Foda ZH, Kleiner RE, Du XQ, Leissring MA, et al. Anti-diabetic activity of insulin-degrading enzyme inhibitors mediated by multiple hormones. Nature 2014;511:94–8.
[18]Cotsapas C, Prokunina-Olsson L, Welch C, Saxena R, Weaver C, Usher N, et al. Expres-sion analysis of loci associated with type 2 diabetes in human tissues. Diabetologia 2010;53:2334–9.
[19]Fakhrai-Rad H, Nikoshkov A, Kamel A, Fernstrom M, Zierath JR, Norgren S, et al. Insulin-degrading enzyme identified as a candidate diabetes susceptibility gene in GK rats. Hum Mol Genet 2000;9:2149–58.
[21]Duggirala R, Blangero J, Almasy L, Dyer TD, Williams KL, Leach RJ, et al. Linkage of type 2 diabetes mellitus and of age at onset to a genetic location on chromosome 10q in Mexican Americans. Am J Hum Genet 1999;64:1127–40.
[22]Elbein SC, Hoffman MD, Teng K, Leppert MF, Hasstedt SJ. A genome-wide search for type 2 diabetes susceptibility genes in Utah Caucasians. Diabetes 1999;48:1175–82.
[23]Postic C, Shiota M, Niswender KD, Jetton TL, Chen Y, Moates JM, et al. Dual roles for glucokinase in glucose homeostasis as determined by liver and pancreatic beta cell-specific gene knock-outs using Cre recombinase. J Biol Chem 1999;274:305–15.
[24]Jimenez-Palomares M, Ramos-Rodriguez JJ, Lopez-Acosta JF, Pacheco-Herrero M, Lechuga-Sancho AM, Perdomo G, et al. Increased Abeta production prompts the onset of glucose intolerance and insulin resistance. Am J Physiol Endocrinol Metab 2012;302:E1373–80.
[25]Perdomo G, Kim DH, Zhang T, Qu S, Thomas EA, Toledo FG, et al. A role of apolipo-protein D in triglyceride metabolism. J Lipid Res 2010;51:1298–311.
[26]Sanchez-Encinales V, Cozar-Castellano I, Garcia-Ocana A, Perdomo G. Targeted deliv-ery of HGF to the skeletal muscle improves glucose homeostasis in diet-induced obese mice. J Physiol Biochem 2015;71:795–805.
[27]Ahren B, Thomaseth K, Pacini G. Reduced insulin clearance contributes to the in-creased insulin levels after administration of glucagon-like peptide 1 in mice. Diabetologia 2005;48:2140–6.
[28]Livak KJ, Schmittgen TD. Analysis of relative gene expression data using real-time quantitative PCR and the 2(−delta delta c(t)) method. Methods 2001;25:402–8.
[29]Qu S, Altomonte J, Perdomo G, He J, Fan Y, Kamagate A, et al. Aberrant Forkhead box O1 function is associated with impaired hepatic metabolism. Endocrinology 2006;147: 5641–52.
[30]Russo L, Muturi HT, Ghadieh HE, Ghanem SS, Bowman TA, Noh HL, et al. Liver-specific reconstitution of CEACAM1 reverses the metabolic abnormalities caused by its global deletion in male mice. Diabetologia 2017;60:2463–74.
[31]Russo L, Muturi HT, Ghadieh HE, Wisniewski AM, Morgan EE, Quadri SS, et al. Liver-specific rescuing of CEACAM1 reverses endothelial and cardiovascular abnormalities in male mice with null deletion of Ceacam1 gene. Mol Metab 2018;9:98–113.
[32]Lopez-Acosta JF, Villa-Perez P, Fernandez-Diaz CM, Roman Dde L, Diaz-Marrero AR, Cueto M, et al. Protective effects of epoxypukalide on pancreatic beta-cells and glu-cose metabolism in STZ-induced diabetic mice. Islets 2015;7:e1078053.
[33]Najjar SM. Regulation of insulin action by CEACAM1. Trends Endocrinol Metab 2002; 13:240–5.
[34]Poy MN, Ruch RJ, Fernstrom MA, Okabayashi Y, Najjar SM. Shc and CEACAM1 inter-act to regulate the mitogenic inter-action of insulin. J Biol Chem 2002;277:1076–84.
[35]Kim DH, Zhang T, Ringquist S, Dong HH. Targeting FoxO1 for hypertriglyceridemia. Curr Drug Targets 2011;12:1245–55.
[36]von Wilamowitz-Moellendorff A, Hunter RW, Garcia-Rocha M, Kang L, Lopez-Soldado I, Lantier L, et al. Glucose-6-phosphate-mediated activation of liver glycogen synthase plays a key role in hepatic glycogen synthesis. Diabetes 2013;62:4070–82.
[37]Leavens KF, Easton RM, Shulman GI, Previs SF, Birnbaum MJ. Akt2 is required for he-patic lipid accumulation in models of insulin resistance. Cell Metab 2009;10:405–18.
[38]Deangelis AM, Heinrich G, Dai T, Bowman TA, Patel PR, Lee SJ, et al. Carcinoembryonic antigen-related cell adhesion molecule 1: a link between insulin and lipid metabolism. Diabetes 2008;57:2296–303.
[39]Tundo GR, Sbardella D, Ciaccio C, Grasso G, Gioia M, Coletta A, et al. Multiple func-tions of insulin-degrading enzyme: a metabolic crosslight? Crit Rev Biochem Mol Biol 2017;52:554–82.
[40]Miller BC, Eckman EA, Sambamurti K, Dobbs N, Chow KM, Eckman CB, et al. Amyloid-beta peptide levels in brain are inversely correlated with insulysin activity levels in vivo. Proc Natl Acad Sci U S A 2003;100:6221–6.
[41]Steneberg P, Bernardo L, Edfalk S, Lundberg L, Backlund F, Ostenson CG, et al. The type 2 diabetes-associated gene ide is required for insulin secretion and suppression of alpha-synuclein levels in beta-cells. Diabetes 2013;62:2004–14.
[42]Biddinger SB, Hernandez-Ono A, Rask-Madsen C, Haas JT, Aleman JO, Suzuki R, et al. Hepatic insulin resistance is sufficient to produce dyslipidemia and susceptibility to atherosclerosis. Cell Metab 2008;7:125–34.