Electrochemical and Photoelectrochemical Investigation of Water Oxidation with Hematite Electrodes
33
0
0
Texto completo
(2) Energy & Environmental Science. Electrochemical and Photoelectrochemical Investigation of Water Oxidation with Hematite Electrodes Benjamin Klahr†, Sixto Gimenez‡, Francisco Fabregat-Santiago‡, Juan Bisquert‡, Thomas Hamann†* †. Department of Chemistry, Michigan State University, East Lansing, MI 48824-1322. ‡. Photovoltaics and Optoelectronic Devices Group, Departament de Física, Universitat Jaume I,. 12071 Castelló, Spain *Email: hamann@chemistry.msu.edu. Abstract Atomic layer deposition (ALD) was utilized to deposit uniform thin films of hematite (αFe2O3) on transparent conductive substrates for photocatalytic water oxidation studies. Comparison of the oxidation of water to the oxidation of a fast redox shuttle allowed for new insight in determining the rate limiting processes of water oxidation at hematite electrodes. It was found that an additional overpotential is needed to initiate water oxidation compared to the fast redox shuttle. A combination of electrochemical impedance spectroscopy, photoelectrochemical and electrochemical measurements were employed to determine the cause of the additional overpotential. It was found that photogenerated holes initially oxidize the electrode surface under water oxidation conditions, which is attributed to the first step in water oxidation. A critical number of these surface intermediates need to be generated in order for the subsequent hole-transfer steps to proceed. At higher applied potentials, the behavior of the electrode is virtually identical while oxidizing either water or the fast redox shuttle; the slight discrepancy is attributed to a shift in potential associated with Fermi level pinning by the surface states in the absence of a redox shuttle. A water oxidation mechanism is proposed to interpret these results.. 1. Page 3 of 34.
(3) Page 4 of 34. Energy & Environmental Science. Introduction Sunlight striking the earth comprises the largest energy resource base currently available.1 Solar energy is well-distributed across the most populous areas of the globe, making the resource accessible where it is needed most. Further, since it is carbon neutral and environmentally benign, solar energy conversion represents an ideal method of powering the planet. One current drawback of solar energy, however, is that it is diurnal and intermittent, while our energy demands are not. Thus, if the vast solar energy resource is ever to be used to supply a significant fraction of the world’s ever-increasing energy demand, efficient methods of storage need to be developed. Analogous to photosynthesis, storing solar energy in chemical bonds (i.e. solar fuels) would be an ideal method. A particularly attractive example of this approach is using solar energy to split water into H2 and O2, where the H2 could subsequently be used in a fuel cell or other energy conversion scheme. Forty years ago, the breakthrough report by Fujishima and Honda demonstrated the feasibility of this approach with photo-assisted water splitting on TiO2 photoelectrodes.2 Since then, there has been significant effort to develop unassisted water splitting systems. There are several requirements which need to be fulfilled in order to achieve this including good electrode stability in contact with aqueous solutions under harsh conditions and appropriate energetics of the system: the energy of the bottom of the conduction band must be higher than the H+/H2 potential and the top of the valence band must be lower in energy than the O2/OH– potential.3 To achieve high efficiency, the additional requirements of good visible light absorption and efficient charge carrier collection must be realized. To date, no single material has fulfilled all the required conditions.4, 5 Hematite (α-Fe2O3) is one promising material for photoelectrochemical (PEC) water splitting which has received a lot of attention due to its combination of sufficiently broad visible light absorption, up to 590 nm, excellent stability under caustic operating conditions and a valence band positioned sufficiently low to oxidize water.6-8 While hematite’s conduction band is too low to reduce water, application of an external bias through a photovoltaic device, or integration of a small bandgap water reduction system in a tandem configuration, would overcome this drawback.9-11 Despite these favorable characteristics, the water oxidation efficiency at hematite electrodes has been too poor to be commercially viable. One problem is the combination of a relatively long visible light penetration depth of 375 nm (for 550 nm light), 2.
(4) Energy & Environmental Science. combined with a very short minority carrier lifetime and mobility, which hinders efficient separation and collection.12-15 This shortcoming has been partially addressed by advances in nanotechnology, where photoelectrodes are able to minimize the charge collection distance while maintaining good light absorption.16-19 Thin films serve as excellent model systems for such nanostructured systems since the charge collection dimension can be readily controlled by the film thickness.20 Further, the uniformity and simple geometry of thin films facilitate the elucidation of the relevant physical properties of hematite photoelectrodes under water splitting conditions. For example, we have recently utilized impedance spectroscopy (IS) to investigate water splitting with hematite by monitoring the evolution of the relevant resistances and capacitances with the onset of photocurrent.21 Accurate determination of the surface state capacitance, for example, requires separation of this capacitance from the bulk capacitance; similar analyses would be problematic with more complicated nanostructures with a non-uniform bulk capacitance. Further, measurements of the bulk capacitance vs applied potential allowed for determination of the flatband potential via Mott-Schottky analysis to enable characterization of the system energetics. It is important to note that the Mott-Schottky equation was derived for a planar electrode (e.g. thin film) and is only valid for such electrodes.22 Since the PEC behavior of hematite electrodes depends strongly on the voltage drop across the depletion region, knowledge of the band edge positions is crucial in interpreting differences in electrode behavior. While nanostructuring can, in principle, overcome the short minority charge carrier driftdiffusion length, holes that reach the electrode/electrolyte interface must be collected efficiently. Use of thin films allowed us to demonstrate that when fast one-electron redox couples are employed, such as [Fe(CN)6]3-/4-, the hole collection can be quantitative.23 Similar conclusions were reached by others using a H2O2 hole scavenger, although this is a sacrificial agent that also photolytically decomposes during measurements; this drawback prevents stable and reproducible measurements that are time-intensive such as IS.24 The water oxidation (oxygen evolution) reaction at the hematite electrode surface is generally reported to be sluggish, however, which allows for increased recombination and a concomitant loss in efficiency.25-30 A detailed understanding of the water oxidation reaction at the hematite electrode surface is therefore very important in devising strategies to overcome this kinetic barrier. There have been several recent studies, employing a variety of techniques, to understand the nature of the slow water splitting 3. Page 5 of 34.
(5) Page 6 of 34. Energy & Environmental Science. reaction with hematite photoelectrodes. For example, Durrant and co-workers used transient absorption (TA) spectroscopy to monitor the evolution of surface-trapped holes and correlated a long trapped hole lifetime with the onset of photocurrent.27-29, 31 One limitation of TA, however, is the difficulty with assigning the energetics of the system, e.g. the position of the relevant surface states. Peter and co-workers recently used IS and intensity modulated photocurrent spectroscopy (IMPS) to study the kinetics of water oxidation at hematite electrodes which also pointed out the crucial role of surface-trapped holes.25, 26, 32 We also recently employed IS at different conditions of voltage, light intensity and electrolyte pH to investigate the main steps involved in water oxidation.21 Importantly, a general physical model, which includes the existence of a surface state at the semiconductor/liquid interface where holes accumulate, was established. In this work we use atomic layer deposition, ALD, to deposit thin film hematite photoelectrodes since the unique self-limiting property of ALD results in uniform films with controllable thickness.33-35 Also, because ALD is not a line-of-sight technique, it can be used to make nanostructured ‘thin films’ which are prepared in an identical fashion to the model thin films, but have increased light absorption.36-38 Thus lessons learned with our thin film model system can be directly applied to nanostructured architectures with precisely controlled dimensions fabricated via ALD.39 We compare the PEC behavior of hematite with ideallybehaving hole collector, [Fe(CN)6]3-/4-, with the behavior under water oxidation conditions. This comparison allows for isolation of the water oxidation steps from the behavior of the bulk hematite electrode. We employed IS and photoelectrochemical measurements to determine the main steps involved in water oxidation. From these combined results we propose a mechanism of water oxidation on hematite electrode surfaces. Experimental Thin films of iron oxide were deposited on fluorine-doped tin oxide (FTO) coated glass substrates (Hartford Glass, 12 Ω cm-2) by atomic layer deposition (Savannah 100, Cambridge Nanotech Inc.) using a procedure described previously.21 Films were prepared by 1,200 ALD cycles and measured to be ~60 nm by absorption measurements (Perkin Elmer, Lambda 35 with a Labsphere integrating sphere) corrected for reflection as described previously, as well as ellipsometry measurements (Horiba Jobin Yvon, Smart-SE).40 Films were determined to be hematite by Raman Spectroscopy and XRD measurements in a previous publication.20 4.
(6) Energy & Environmental Science. Hematite electrodes were masked with a 60 µm Surlyn film (Solaronix) with a 0.25 cm2 hole to define the active area and to prevent scratching of the thin films. Surlyn films were adhered to the electrodes by heating to 120° C. The hematite electrodes were examined in contact with aqueous solutions buffered to pH 6.9 using a 0.1 M phosophate buffer, with 200 mM KCl as a supporting electrolyte. The pH was determined with Fisher Scientific Accumet pH meter. Electrolytes containing the [Fe(CN)6]3-/4- redox couple consisted of 200 mM K4Fe(CN)6 and 20 mM K3Fe(CN)6. The protected hematite electrodes were clamped to a custom made glass electrochemical cell. A homemade saturated Ag/AgCl electrode was used as a reference electrode and high surface area platinum mesh was used as the counter electrode. Impedance spectroscopy and photoelectrochemical measurements were made with an Eco Chemie Autolab potentiostat coupled with Nova electrochemical software. Impedance data were gathered using a 10 mV amplitude perturbation of between 10,000 and 0.01 Hz. Data were fit using Zview software (Scribner Associates). The light source was a 450 W Xe arc lamp (Horiba Jobin Yvon). An AM 1.5 solar filter was used to simulate sunlight at 100 mW cm-2 (1 sun). Neutral density filters were used to adjust the intensity to 33 mW cm-2 (0.33 Sun) and 10 mW cm-2 (0.1 Sun). All photoelectrochemical measurements were performed by shining light from the substrateelectrode (SE) interface. Light chopped J-V curves were measured at a rate of 75 mV/s. The light was chopped using a computer controlled ThorLabs solenoid shutter which was set to activate every 266 ms such that the light was turned on or off every 20 mV. Steady state J-V curves were measured at a scan rate of 20 mV/s. Cyclic voltammogram surface state measurements were performed by applying a potential of 1.4 V vs Ag/AgCl under 1 sun illumination for 60 seconds, and then scanning over a potential range in the dark.. Results Steady state J-V curves of a typical thin film hematite electrode immersed in an aqueous electrolyte (H2O) and an aqueous electrolyte containing the [Fe(CN)6]3-/4- redox couple can be seen in figure 1. We have recently shown that the J-V response of hematite thin film electrodes in contact with the [Fe(CN)6]3-/4- redox couple is limited by the fraction of holes that reach the semiconductor/liquid interface which is determined by the potential drop across the electrode.15, 20, 23. In other words, the surface-hole collection efficiency by [Fe(CN)6]4- is essentially unity.15. Since the same film is used in the J-V measurements shown in Fig. 1, in aqueous electrolytes 5. Page 7 of 34.
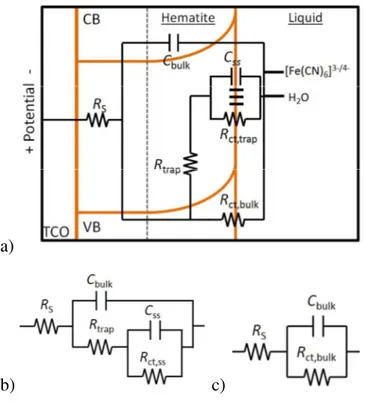
(7) Page 8 of 34. Energy & Environmental Science. buffered to the same pH under the same illumination conditions, the discrepancy in photocurrent density and onset potential can be attributed to differences in the surface-hole collection efficiency under H2O oxidation conditions (in the absence of a fast hole collector such as [Fe(CN)6]4-). The details underlying this discrepancy are discussed below.. Figure 1. Steady state J-V curve of a hematite electrode in contact with a H2O (red curve) and [Fe(CN)6]3-/4- (orange curve) electrolyte. IS measurements were also performed for nominally identical hematite electrodes under the same conditions as the J-V measurements with varying illumination intensities. Nyquist plots resulting from measurements in each electrolyte under 1 sun illumination at 0.7 V vs Ag/AgCl and at 1 V vs Ag/AgCl are displayed in figure 2a and 2b, respectively. At 0.7 V vs Ag/AgCl, two clear semicircles are visible for the H2O electrolyte. A full equivalent circuit representing the hematite/liquid junction is shown in figure 3a. The equivalent circuit elements include a space-charge capacitance of the bulk hematite, Cbulk, surface state capactitance, Css; the resistances consist of a series resistance, RS, a resistance which represents the trapping of holes in the surface states, Rtrap, a charge transfer resistance from the surface states to solution, Rct,ss, and a charge transfer resistance from the valence band to solution, Rct,bulk. To allow unambiguous fitting of the impedance data to the equivalent circuit in figure 3a, Rct,bulk was removed for the case of water oxidation, which yielded the simplified equivalent circuit in figure 3b, for reasons that have been discussed elsewhere.21 At potentials positive of ~0.85 V, the impedance spectra for water oxidation loses the low frequency semicircle and becomes a single semicircle; in this 6.
(8) Energy & Environmental Science. case the simple Randle’s circuit, shown in figure 3c, is used to fit these impedance spectra. Only one semicircle is visible at all potentials and light conditions measured with the [Fe(CN)6]3-/4electrolyte, therefore a simple Randle’s circuit is also used to fit these impedance spectra.. a). b) Figure 2. Nyquist plots for IS data measured under 1 sun illumination for H2O (red circles) and [Fe(CN)6]3-/4- (orange triangles) electrolytes at (a) 0.70 V vs. Ag/AgCl and (b) 1.00 V vs. Ag/AgCl.. 7. Page 9 of 34.
(9) Page 10 of 34. Energy & Environmental Science. a). b). c). Figure 3. a) Full equivalent circuit used to conceptualize hematite-liquid junctions. b) Simplified model used to fit IS data for Nyquist plots that show 2 semicircles. c) Simplified model used to fit IS data for Nyquist plots that show 1 semicircle.. Results from fitting the impedance spectra to the appropriate equivalent circuits described above can be seen in figure 4 (additional fitting results are provided in SI). Figure 4a shows a Gaussian distribution of CSS in the H2O electrolyte, which shifts to more negative potentials with increasing light intensity; this behavior was described previously.21 The CSS peak corresponds to a dip in Rct,ss (Fig 4b), which indicates that interfacial charge transfer (water oxidation) is related to charging of these surface states.21 With [Fe(CN)6]3-/4- in solution, however, the charge transfer resistance is essentially constant over the measured potential range for a given light intensity as shown in figure 4c. The absence of a measureable surface state capacitance and absence of a dip in the charge transfer resistance suggests that photooxidaiton of [Fe(CN)6]4- does not involve surface states and can be described as a simple outersphere valence band hole collection process. In both electrolytes, there is an obvious decrease of the charge transfer resistance with increasing light intensity which is attributed to a concomitant increase in the number of photogenerated valence band holes with light intensity. 8.
(10) Energy & Environmental Science. Mott Schottky plots were created from the derived Cbulk values from both H2O and [Fe(CN)6]3-/4- electrolytes in the dark and under 1 sun illumination conditions, which are shown in figure 4d. The Mott Schottky plots measured under illumination for water oxidation conditions show a significant horizontal shift compared to the dark, which is an example of Fermi level pinning.21, 41 The Mott Schottky plots with the [Fe(CN)6]3-/4- electrolyte are identical in the dark and under illumination, however, further indicating that the surface states do not play a role in [Fe(CN)6]4- oxidation. In addition, the impedance spectra and Mott Schottky plots are essentially identical for the H2O and [Fe(CN)6]3-/4- electrolytes in the dark, which indicates the surface states are only active under illumination. The details of the surface states are described further below.. a). b). 9. Page 11 of 34.
(11) Page 12 of 34. Energy & Environmental Science. c). d) Figure 4. Equivalent circuit parameters obtained from fitting IS data for a hematite electrode in contact with H2O (a and b) and [Fe(CN)6]3-/4- (c) electrolytes under 0.1 sun (orange triangles), 0.33 sun (yellow squares) and 1 sun (green diamonds) illumination. d) Mott Schottky plots calculated from Cbulk values determined from fitting the impedance spectra for H2O (circles) and [Fe(CN)6]3-/4- (triangles) electrolytes in the dark (grey) and under 1 sun illumination (colored). The total resistance, Rtot was calculated from the IS fittings (Rtot = RS + Rtrap + Rct,ss for H2O oxidation and Rtot = RS + Rct,bulk for [Fe(CN)6]4- oxidation) and was compared to the resistance calculated from the J-V curves where Rtot=dV/dJ.21 A plot of Rtot calculated from both methods for both H2O and [Fe(CN)6]3-/4- electrolytes can be seen in figure 5 under 1 sun illumination. The agreement between the calculated Rtot from the IS and J-V curves helps to confirm the validity of the equivalent circuit models employed. At potentials negative of the photocurrent onset potential for H2O oxidation, Rtot is found to be approximately two orders of 10.
(12) Energy & Environmental Science. magnitude higher compared to Rtot for the oxidation of [Fe(CN)6]4-. This large resistance is consistent with the lack of photocurrent density at these potentials. At around 0.6 V, the Rtot due to water oxidation drops coincidently with the initiation of photocurrent. Interestingly, Rtot for both H2O and [Fe(CN)6]3-/4- electrolytes become equal at about 1 V vs Ag/AgCl, suggesting that this hole transfer reaction is not the rate limiting step in water oxidation at positive potentials.. Figure 5. Rtot calculated from dV/dJ of the J-V curves (lines) and from IS data (symbols) for H2O and [Fe(CN)6]3-/4- electrolytes under 1 sun illumination. In order to gain further insight into the differences in behavior of hematite electrodes in contact with H2O and [Fe(CN)6]3-/4- electrolytes, J-V curves were also measured under light chopping conditions and compared with J-V curves with constant illumination. Figure 6a shows the superimposed chopped and constant light J-V curves when [Fe(CN)6]3-/4- is present in the solution. The instantaneous photocurrent density with chopped light reaches the constant light photocurrent density and remains constant until the light is turned off, where the current immediately decays to J0.23 This ideal behavior is consistent with the expectations of a fast hole collector efficiently scavenging valence band holes at the surface of a hematite photoelectrode.15, 24, 42 In the case of water oxidation, however, the behavior is quite different: see figure 6b. At potentials from 0.2 – 0.6 V vs. Ag/AgCl, there is a significant instantaneous photocurrent density when the chopped light is turned on, which quickly decays to the near zero steady-state photocurrent density under constant illumination. Interestingly, the peak of the H2O anodic transient photocurrent density closely matches the steady state photocurrent density measured with the [Fe(CN)6]3-/4- electrolyte (also shown). This is attributed to the identical flux 11. Page 13 of 34.
(13) Page 14 of 34. Energy & Environmental Science. of photogenerated holes which initially reach the surface. When the holes that reach the surface are efficiently collected, as in the case of [Fe(CN)6]4- oxidation, this flux determines the steady state photocurrent density. Under water oxidation conditions, however, the photocurrent density decay indicates that a faradaic current cannot be sustained and the hole transfer efficiency is therefore minimal. In this case, the flux of holes that reach the surface must either be trapped in surface states or recombine with conduction band electrons. When the light is switched off at potentials where transient anodic peaks are observed, transient cathodic peaks are also visible. The cathodic transients are thus attributed to reducing the surface-trapped holes. This behavior is consistent with previous reports where current transients were also attributed to the charging and discharging of surface states of α-Fe2O3,30, 42, 43 CdTe,44 and TiO2.45 Indeed, measuring transient peaks through light chopping has become a prevalent method of qualitatively probing the surface states of hematite.24, 46-50 All additional photogenerated holes, which are not stored in surface states, therefore undergo recombination.. a). b) 12.
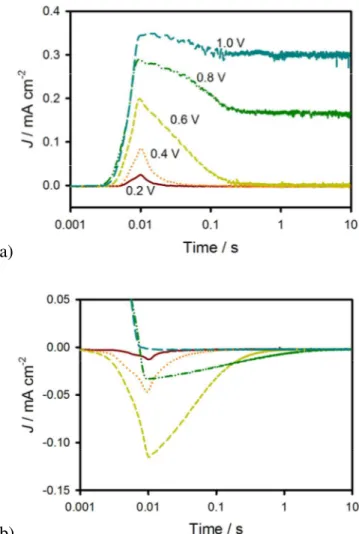
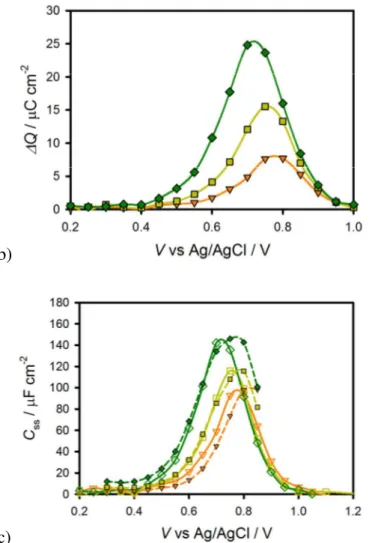
(14) Energy & Environmental Science. Figure 6. a) Chopped light (grey line) and steady state (orange line) J-V measured under 1 sun illumination for a hematite electrode in contact with a Fe(CN)63-/4- electrolyte. b) Chopped light (grey line) and steady state (red line) J-V measured under 1 sun illumination for a hematite electrode in contact with a H2O electrolyte (the steady state J-V curve measured in a Fe(CN)63-/4electrolyte (yellow line) is also shown for comparison).. In order to deconvolute the change in potential with change in current over time as in the data shown in figure 6, current transients at a constant potential were also measured. These measurements were performed by measuring the current as a function of time at a fixed potential in response to turning on (anodic) and off (cathodic) 1 sun illumination. Plots of the anodic and cathodic current transients measured at various constant potentials can be seen in figures 7a and 7b, respectively. Clearly, there is a dependence in the magnitude of the current transient with potential as well as the rate of decay. In order to determine the amount of charge stored in the surface state at a given potential, the current vs. time plots in figure 7 were integrated. A plot of the anodic and cathodic charge stored as a function of potential is shown in figure 8a. The anodic charge was not calculated for potentials above 0.6 V vs Ag/AgCl because the faradaic and charging current cannot be separated accurately. The cathodic and anodic charge is approximately equal, at least for potentials up to 0.6 V vs Ag/AgCl, suggesting that the charge measured is related to the amount of charge trapped in surface states on the hematite electrode. There is a clear peak in the stored charge at approximately 0.7 V vs Ag/AgCl. Interestingly, this is near the potential which yields the peak CSS from IS measurements. The same experiments were also performed in response to varying illumination intensities; the results are displayed in figure 8b which were calculated from cathodic current transients. The magnitude of the peak clearly increases with light intensity and the peak shifts to more negative potentials with increasing light intensity. This is the same trend found with the peak of CSS as a function of light intensity measured by IS. The charge measured by the current transients can be related to CSS by the equation CSS =. ∆Q where ∆V is the change in the quasi-Fermi level as a result of turning the ∆V. light off at a constant potential. Assuming the surface states probed by IS and current transients are the same, ∆V can be calculated by plotting CSS obtained from IS vs. ∆Q measured from current transients (see SI). From the slope of these plots, ∆V was found to be 0.08 , 0.13 and 13. Page 15 of 34.
(15) Page 16 of 34. Energy & Environmental Science. 0.17 V for 0.1, 0.33 and 1 sun respectively. This corresponds to an increase of 92 mV per 10 fold increase in light intensity, in good agreement with ideal behavior. The CSS calculated from the current transients and can be seen in figure 8c. Taken together, these results confirm that the CSS measured with IS is the same entity probed by measuring the stored charge of the current transients.. a). b) Figure 7. J measured for a constant V vs. Ag/AgCl plotted vs. time for when 1 sun illumination is turned on (a) and off (b). Time is corrected so that the all of the peaks occur at 10 ms. Measurements are shown for 0.2 V (red solid line), 0.4 V (orange dotted line), 0.6 V (yellow small dashed line), 0.8 V (green dashed dotted line), and 1V (blue large dashed line) vs. Ag/AgCl.. 14.
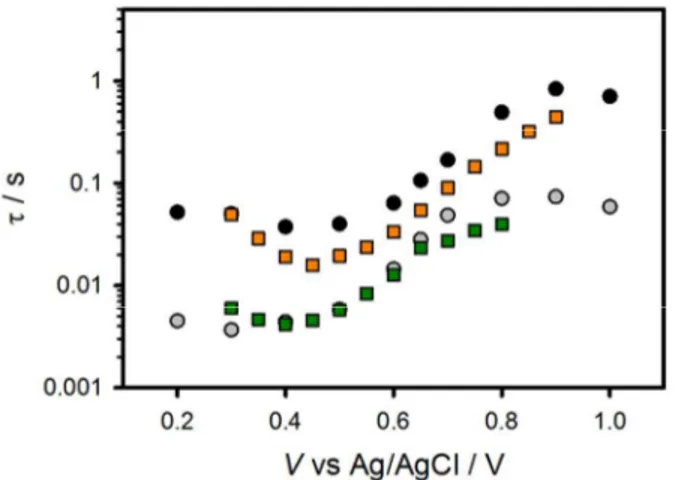
(16) Energy & Environmental Science. The potential dependence of the transient photocurrent decay was also examined. Abrantes and Peter examined the decay of current transients of passive iron oxide electrodes in an H2O electrolyte and were able to gain kinetic insight on the back reaction of electrons reducing surface states (i.e. filling surface trapped holes) by fitting the decays to a single exponential function.42 We found, however, that a double exponential decay is necessary to achieve good fits for the decays measured (See SI). Fitting the decays to a double exponential decay function ( J ( t ) = J ( 0 )1 e − t / τ 1 + J ( 0 )2 e − t / τ 2 + J ( ∞ ) where J(0) is the maximum current for the decay process at time = 0, τ is the lifetime of the process and J(∞) is the steady state current reached after both processes have fully decayed) produced two lifetimes that differ by approximately an order of magnitude, which are displayed in figure 9. Two lifetimes were also calculated from current transients for both doped and undoped hematite electrodes in water oxidation conditions by Glasscock et. al.51 This result is also in reasonable agreement with a recent report by Pendlebury et. al. of transient absorption spectroscopic measurements on hematite electrodes under water oxidation conditions.27 Both lifetimes are dependent on potential where the lifetimes increase by approximately an order of magnitude from when there is no faradaic current (0.4 V vs Ag/AgCl) to when there is signification faradaic current (>0.8 V vs Ag/AgCl). This also agrees with a recent paper correlating long lived holes and photocurrent on hematite electrodes.27. a). 15. Page 17 of 34.
(17) Page 18 of 34. Energy & Environmental Science. b). c) Figure 8. a) Transient anodic (red circles) and cathodic (orange triangles) charge passed as a function of potential. b) Transient cathodic charge vs. potential under 0.1 sun (orange triangles), 0.33 sun (yellow squares) and 1 sun (green diamonds) illumination. c) CSS determined from IS, (open shapes) and CSS determined from current transients (filled in shapes) under 0.1 Sun (orange triangles), 0.33 sun (yellow squares) and 1 sun (green diamonds) illumination.. The origin of the two lifetimes found actually result from a single process: the discharging of the surface state. As mentioned above, under illumination, charge is accumulated in the surface state. At short times after switching off the light, the conditions of the trap state (amount of charge accumulated, trap transfer resistance) are similar as when under illumination. Therefore, the short lifetimes obtained from the transients in figure 7b are very close to the relaxation times of the surface state at 1 sun: τ 1 ≈ ( RS + Rtrap ) × C SS . As the surface state. 16.
(18) Energy & Environmental Science. discharges (is reduced), both Rtrap and Css change. In fact, the amount of charge accumulated in the surface states sweeps the states produced at lower light intensities until reaching dark conditions. Thus, the discharging time rises providing the second, slower process, τ 2 . Figure 9 shows the two lifetimes fit from the double exponential decay of the transients (figure 7b) as well as the relaxation time of the trapped electrons measured from IS data under 1 sun and 0.1 sun illumination. It is observed that there is a good match between the fast time constant of the transient discharge time and the relaxation time measured under 1 sun illumination. As the light intensity diminishes, conditions approach those in the dark thus the surface state discharging time obtained at 0.1 sun approaches the slow time constant found from the cathodic discharge. The increase in the time constant obtained is due to the increase in Rtrap during the discharge of the surface state.. Figure 9. A plot of the 2 different lifetimes (black and grey circles) fit from a double exponential of the cathodic decays shown in figure 7B. The lifetime of the surface state charging-discharging process at 1 sun (green squares) and at 0.1 sun (orange squares) are also shown.. The anodic and cathodic current density transients measured above are attributed to the reversible oxidation and reduction, respectively, of surface species. In other words, surface trapping of holes means the photooxidation of a chemical species on the surface (discussed below), and surface recombination is the reduction of that oxidized surface species. We therefore reasoned that we should also be able to measure the light-generated surface trapped holes using cyclic voltammetry in the dark. In this experiment, holes accumulate on the surface 17. Page 19 of 34.
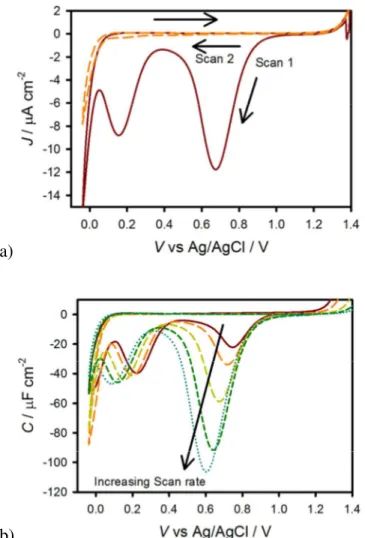
(19) Page 20 of 34. Energy & Environmental Science. by applying a positive potential under illumination,52 followed by measuring the cathodic current in the dark as the potential is scanned negatively and the surface states are reduced.53, 54 A representative experiment measured at 200 mV s-1 is shown in figure 10a. On the first cycle, shown as a red solid line, a peak in current appears at around 0.7 V and 0.2 V vs Ag/AgCl. On the second cycle, both of these peaks are gone. The fact that the peaks cannot be seen on the second cycle is consistent with the idea that these peaks represent the reduction of surface trapped holes as the potential is scanned negative on the first cycle. These holes are not reoxidized by the application of a positive potential (at least on the relatively fast timescale of the experiment) which indeed means that the holes are generated by photoexcitation of hematite and not by the potential. Thus there are no longer oxidized surface species to be reduced on the second cycle. The peak at 0.7 V is very close to the peak of CSS fit by the IS data, shown in figures 4a, as well as the potential where the maximum transient charge is found, shown in figure 8. This suggests the peak at 0.7 V is due to filling the surface states which are associated with water oxidation. In order to probe the timescale of the transient peaks, a scan rate dependence of the CV measurements was performed. Capacitance plots were then calculated by dividing the current density by the scan rate, which can be seen in figure 10b for varying scan rates. It is apparent that the species probed at 0.7 V vs Ag/AgCl decreases with scan rate which means the states occupancy decays over time. The time constant(s) of this decay process cannot be confirmed quantitatively because of the constantly changing potential, however the timescale is in general agreement with the transient lifetimes displayed in Fig 9. This further suggests that the state measured is the same measured in the current transients. The charge passed from the surface states corresponding to the peak at 0.7 V vs Ag/AgCl was calculated to be 25 µC cm-2 when measured at a fast scan rate of 1 V s-1. The similar values between the charge measured through the CV peak, the CSS peak from IS and the charge passed through current transients, as well as the lifetimes measured from the decay of the CV peak and current transients, all suggest that the species being measured around 0.7 V vs Ag/AgCl is the same for all measurements. Similar CV measurements were also performed with [Fe(CN)6]3-/4- in solution, (see SI) however no cathodic current was measured until the reduction of the [Fe(CN)6]3- began, again suggesting that the surface states are associated with water oxidation intermediates and not intrinsic to the hematite electrode.. 18.
(20) Energy & Environmental Science. a). b) Figure 10. a) Cyclic voltametry of hematite in H2O scanned at 200 mV s-1 after holding the electrode at a potential of 1.4 V vs Ag/AgCl for 60 seconds under 1 sun illumination. The first cycle is a solid red line and the second cycle is a dashed orange line. b) CVs measured with the same conditions as (a) at different scan rates: 20 mV s-1 (red, solid), 50 mV s-1 (orange, long dash), 200 mV s-1 (yellow, medium dash), 500 mV s-1 (green, short dash) and 1,000 mV s-1 (blue, dots).. Discussion The J-V curves of hematite electrodes immersed in an aqueous electrolyte containing [Fe(CN)6]3-/4- can be described by the potential dependent fraction of photogenerated holes that reach the electrode surface.23 These valence band holes at the surface are efficiently collected by [Fe(CN)6]4-, and this faradaic charge transfer results in a steady-state photocurrent density.15 19. Page 21 of 34.
(21) Page 22 of 34. Energy & Environmental Science. Under H2O oxidation conditions the flux of holes to reach the surface (which is just a property of the same bulk semiconductor) is the same, however a steady-state photocurrent is not produced at low applied potentials. Instead of the surface holes undergoing interfacial charge transfer to solution, a fraction of the holes are initially (at low potentials) trapped in surface states; the remainder recombine. This charging of surface states was observed through IS, transient photocurrent and cyclic voltammetric measurements. These results provoke questions regarding the identity of these surface states and their role in the water oxidation process. Instead of being what is generically termed a surface state, we believe the surface states presented herein actually consist of intermediates in the overall water oxidation reaction. One piece of (albeit indirect) evidence of this is that the surface state is only, and always, observed under water oxidation conditions – not in the dark or in the presence of a competitive hole scavenger. In addition, the pH-dependant surface state is at the same energy as the water oxidation potential,29 which we believe is not just a coincidence. We therefore propose that the charging of the surface state is actually the first oxidative step in the overall water oxidation reaction. The fully hydroxylated species, (OH)3–Fe–H3O3–R where R represents the bulk hematite crystal, is the thermodynamically most stable surface configuration of the (0001) surface.55 Hellman and Pala recently suggested that the first step of water oxidation on hematite electrodes is the proton coupled oxidation of such surface hydroxide species.56 This is also in agreement with one of the general mechanisms of water oxidation at metal oxide electrodes previously reviewed by others.57-59 The initial step is thus given by: +. h → Fe( IV ) = O + H + Fe( III ) − OH ← − e. (1). We believe this reaction is what is referred to as “hole trapping” or “surface state charging.” Hellman and Pala further calculated that the most stable configuration during water oxidation (at higher applied potentials) is the oxidized (OH)3-Fe-O3-R surface, also consistent with this assignment.56 Since the oxidized species on the surface, Fe=O, can be reduced, as demonstrated by the cathodic current transients (figure 7) and the CV measurements (figure 10), the reaction is written as reversible. While it is very challenging to directly determine the identity of surface states on a bulk electrode, there are molecular iron catalysts which can serve as analogs. There are several examples of Fe(IV)=O complex intermediates which are known to be involved in catalytic. 20.
(22) Energy & Environmental Science. Page 23 of 34. cycles.60, 61 For example, a Fe-TAML complex was recently shown to catalyze the oxidation of water to dioxygen.62 Further, Collins and co-workers have shown that the Fe(IV)-oxo species has a reduction potential of 0.9 V vs NHE in basic conditions, according to the reaction 2−. 2−. Fe ( IV ) L ( = O )( OH2 ) + e− + H2O → Fe ( III ) L ( OH )( OH2 ) + OH−. (2). which is essentially the recombination reaction (reduction of the surface intermediate species) proposed herein.61 This behavior of the Fe(III)-OH / Fe(IV)=O molecular complexes is therefore in good agreement with the proposed first water oxidation step on hematite electrodes. In addition, it was shown that an intermediate Fe(IV)=O complex has a broad absorption spectrum centered at 820 nm.60 This absorbance is also consistent with the broad near IR absorption observed during water oxidation with hematite electrodes.27, 32 There are two important features of the surface state behavior that provide further insight into the water oxidation mechanism. The first is that at potentials where the surface oxidation begins, the formation of the proposed intermediate Fe=O doesn’t result in subsequent water oxidation steps as indicated by the lack of steady-state photocurrent; i.e. the transient photocurrent at these potentials decays to zero. Attack of the surface Fe=O by water molecules, leading to a surface bound peroxide followed by decomposition to O2, should be thermodynamically downhill.56 In this case, it is expected that the steady-state concentration of surface Fe=O should lead to photocurrent production. Since no photocurrent is observed under these conditions, this is not the predominant mechanism. The other feature is the fact that steady-state concentration of surface Fe=O reaches a peak that is coincident with a sharp drop in the charge transfer resistance and an increase of photocurrent. This indicates that a critical concentration of the surface intermediate species is necessary before the further water oxidation steps can proceed. The necessary number of surface intermediates can be estimated by integrating the capacitance as a function of potential. The CSS peaks determined from IS data were fit to a Gaussian curve and integrated to calculate the total charge of the surface states to be 24.3, 31.6 and 38.8µC cm-2 for 0.1, 0.33, and 1 sun illumination respectively. Using the value for 1 sun illumination as an example, this corresponds with a surface coverage of 2.4 × 1014 cm2. . The surface coverage is then calculated to be ~53%, by using the unit cell parameters for the. 0001 surface of hematite, and estimating 1 active site per unit cell.56, 63-66 This behavior is consistent with the surface intermediate decomposing bimolecularly, such as:. 21.
(23) Page 24 of 34. Energy & Environmental Science. 2 Fe( IV ) = O → 2 Fe( III ) + O2. (3). We note that such an oxygen formation mechanism has been proposed extensively before, although not applied to hematite photoelectrodes.57-59 A water molecule, or hydroxide, could then quickly coordinate to the open iron site to complete the photocatalytic cycle. At positive potentials (≥ 0.85 V vs. Ag/AgCl) the current transients become negligible, the low frequency semicircle disappears from the IS spectra and high steady state photocurrent densities are achieved. This behavior is essentially indistinguishable from when the fast hole collector [Fe(CN)6]4- is present in solution (figure 6b). Further, these two systems have the same charge transfer resistance at positive potentials. Therefore, the surface hole collection efficiency must also be essentially unity under water oxidation conditions at such positive potentials. Thus, once a sufficient concentration of intermediate is built up, allowing the subsequent steps of water oxidation to proceed, water oxidation is not the rate limiting step in the photoelectrochemical behavior of hematite electrodes; the flux of holes to the electrode surface limits the photocurrent density at these potentials. We note that the J-V curves of the H2O and [Fe(CN)6]3-/4- electrolytes, as seen in figure 1, do not overlap exactly, even at positive potentials; the H2O electrolyte always produces somewhat lower photocurrents at a given positive potential compared to [Fe(CN)6]3-/4-. Since we have demonstrated the surface hole collection efficiency is essentially unity for both of these systems, and the surface hole concentration is determined by the potential drop of the electrode, the discrepancy can be attributed to the extra potential needed to compensate for Fermi level pinning in the H2O electrolyte. According to the Mott-Schottky plots, the bands under water oxidation are shifted positive compared to [Fe(CN)6]3-/4-. Shifting the J-V curve in the H2O electrolyte by 200 mV produces excellent agreement with the [Fe(CN)6]3-/4- J-V curve at positive potentials. A 200 mV shift in band position is also in reasonable agreement with the shift indicated by the Mott-Schottky plot (see SI). Finally, the above discussion of the intrinsic role of the surface state seen at 0.7 V does not include the other state that we observed around 0.2 V in the CV measurements. Since this state’s energy is significantly higher than the water oxidation potential, and it is not observed in the impedance spectra at photocurrent onset, we don’t think it plays an active role in water oxidation. There are surface terminations of hematite, in addition to the (OH)3–Fe–H3O3–R termination discussed above, that are stable. According to Trainor et. al., the other most relevant 22.
(24) Energy & Environmental Science. surface is the (OH)3–R termination.55 This surface can also be oxidized, i.e. trap a hole, but it is thermodynamically uphill for subsequent water oxidation. Importantly, this termination’s oxidation potential is approximately 0.5 V more negative than the (OH)3–Fe–H3O3–R termination, which is in excellent agreement with the differences in potential of the two surface states we observed. Conclusion The photoelectrochemical behavior of hematite electrodes in contact with H2O and [Fe(CN)6]3-/4- electrolytes were compared. The steady state photocurrent onset potential was approximately 0.6 V higher in H2O compared to [Fe(CN)6]3-/4-, which is in accord with literature reports.15, 24, 67 The much more positive onset potential represents a loss of energy which must be minimized for any practical use of hematite in water splitting applications. A combination of impedance spectroscopy, photocurrent transient and cyclic voltammetry measurements were therefore employed to determine the cause of the large overpotential for water splitting. We found that at moderate potentials, prior to the photocurrent onset potential, photogenerated holes became trapped in surface states. We deduce that the physical meaning of photogenerated holes being trapped at the surface is that this is the first step in the water oxidation process, specifically the reversible oxidation of surface hydroxide species. It is only after a buildup of these oxidized intermediates that water oxidation proceeds. This calls into question the strategy of passivating surface states on hematite electrodes which has been pursued recently since they might be an inherent feature of oxidizing water, and not necessarily deleterious.48, 50 It is well known that water oxidation proceeds by an innersphere mechanism, thus a proposed mechanisms should account for this;59 describing this reaction as a charge transfer from a valence band hole is misleading. In addition, the negligible faradaic, steady state photocurrent densities at these potentials is often attributed to slow hole transfer kinetics of water oxidation.25, 26, 28-30 We suggest that this may be an intrinsic part of the bimolecular mechanism of water oxidation on the hematite surface. At high applied potentials, however, the photocurrent density is essentially the same for the H2O and [Fe(CN)6]3-/4- systems; the minor difference is attributed to Fermi level pinning in the H2O electrolyte. This ideal behavior at high potentials is consistent with the idea that water oxidation is not the rate limiting step, once a critical concentration of surface intermediates is formed. While the addition of catalysts have been shown to improve performance, the cause of the improvement has not been established.31, 46, 68-71 Insight into the 23. Page 25 of 34.
(25) Page 26 of 34. Energy & Environmental Science. mechanism of water oxidation on hematite, and other surfaces, is critical for the design of better catalysts or other systems aimed at improving the efficiency of water splitting. Work is ongoing in our lab to clarify these points.. Acknowledgements TWH thanks the National Science Foundation (CHE-1150378) and the Donors of the American Chemical Society Petroleum Research Fund (51099-DNI10) for support of this research. JB & FFS acknowledge support by projects from Ministerio de Ciencia e Innovación (MICINN) of Spain (Consolider HOPE CSD2007-00007), and Generalitat Valenciana (PROMETEO/2009/058). SG acknowledges support by MICINN of Spain under the Ramon y Cajal programme.. References 1. 2. 3. 4. 5. 6. 7. 8. 9. 10. 11. 12. 13. 14. 15. 16. 17. 18.. in World Energy Assessment Report: Energy and the Challenge of Sustainability, United Nations Development Program, New York, 2003. A. Fujishima and K. Honda, Nature, 1972, 238, 37-38. M. G. Walter, E. L. Warren, J. R. McKone, S. W. Boettcher, Q. X. Mi, E. A. Santori and N. S. Lewis, Chemical Reviews, 2010, 110, 6446-6473. J. Bolts and M. Wrighton, The Journal of Physical Chemistry, 1976, 80, 2641-2645. M. A. Butler and D. S. Ginley, Journal of Material Science, 1980, 15, 1-19. J. H. Kennedy and K. W. Frese, J. Electrochem. Soc., 1978, 125, 709-714. A. B. Murphy, P. R. F. Barnes, L. K. Randeniya, I. C. Plumb, I. E. Grey, M. D. Horne and J. A. Glasscock, International Journal of Hydrogen Energy, 2006, 31, 1999-2017. L. A. Marusak, R. Messier and W. B. White, J. Phys. Chem. Solids, 1980, 41, 981-984. A. Duret and M. Gratzel, Journal of Physical Chemistry B, 2005, 109, 17184-17191. J. Brillet, M. Cornuz, F. Le Formal, J. H. Yum, M. Gratzel and K. Sivula, Journal of Materials Research, 2010, 25, 17-24. H. L. Wang, T. Deutsch and J. A. Turner, Journal of the Electrochemical Society, 2008, 155, F91-F96. R. F. G. Gardner, F. Sweett and D. W. Tanner, Journal of Physics and Chemistry of Solids, 1963, 24, 1183-1196. A. G. Joly, J. R. Williams, S. A. Chambers, G. Xiong, W. P. Hess and D. M. Laman, Journal of Applied Physics, 2006, 99, 6. A. J. Bosman and H. J. Vandaal, Advances in Physics, 1970, 19, 78. B. M. Klahr and T. W. Hamann, Journal of Physical Chemistry C, 2011, 115, 8393-8399. A. Kay, I. Cesar and M. Gratzel, Journal of the American Chemical Society, 2006, 128, 15714-15721. U. Bjorksten, J. Moser and M. Gratzel, Chem. Mater., 1994, 6, 858-863. S. K. Mohapatra, S. E. John, S. Banerjee and M. Misra, Chem. Mater., 2009, 21, 30483055. 24.
(26) Energy & Environmental Science. 19. 20. 21. 22. 23. 24. 25. 26. 27.. 28. 29.. 30. 31. 32. 33. 34. 35. 36. 37. 38. 39. 40. 41. 42. 43. 44.. I. Cesar, K. Sivula, A. Kay, R. Zboril and M. Graetzel, J. Phys. Chem. C, 2009, 113, 772782. B. M. Klahr, A. B. F. Martinson and T. W. Hamann, Langmuir, 2011, 27, 461-468. B. Klahr, S. Gimenez, F. Fabregat-Santiago, J. Bisquert and T. W. Hamann, J. Am. Chem. Soc., 2012, DOI: 10.1021/ja210755h. F. Cardon and W. P. Gomes, J. Phys. D: Appl. Phys., 1978, 11, L63-L67. B. M. Klahr and T. W. Hamann, Applied Physics Letters, 2011, 99, 3. H. Dotan, K. Sivula, M. Gratzel, A. Rothschild and S. C. Warren, Energy Environ. Sci., 2011, 4, 958-964. K. G. Upul Wijayantha, S. Saremi-Yarahmadi and L. M. Peter, Physical Chemistry Chemical Physics, 2011, 13, 5264-5270. L. M. Peter, K. G. U. Wijayantha and A. A. Tahir, Faraday Discussions, 2012. S. R. Pendlebury, A. J. Cowan, M. Barroso, K. Sivula, J. Ye, M. Gratzel, D. R. Klug, J. Tang and J. R. Durrant, Energy & Environmental Science, 2012, DOI: 10.1039/C1031EE02567H. S. R. Pendlebury, M. Barroso, A. J. Cowan, K. Sivula, J. W. Tang, M. Gratzel, D. Klug and J. R. Durrant, Chemical Communications, 2011, 47, 716-718. A. J. Cowan, C. J. Barnett, S. R. Pendlebury, M. Barroso, K. Sivula, M. Gra tzel, J. R. Durrant and D. R. Klug, Journal of the American Chemical Society, 2011, 133, 1013410140. M. P. Dareedwards, J. B. Goodenough, A. Hamnett and P. R. Trevellick, J. Chem. Soc., Faraday Trans. 1 F, 1983, 79, 2027-2041. M. Barroso, A. J. Cowan, S. R. Pendlebury, M. Gra tzel, D. R. Klug and J. R. Durrant, Journal of the American Chemical Society, 2011, 133, 14868-14871. C. Y. Cummings, F. Marken, L. M. Peter, K. G. Upul Wijayantha and A. A. Tahir, Journal of the American Chemical Society, 2011, 134, 1228-1234. T. W. Hamann, A. B. F. Martinson, J. W. Elam, M. J. Pellin and J. T. Hupp, J. Phys. Chem. C, 2008, 112, 10303-10307. T. W. Hamann, A. B. F. Martinson, J. W. Elam, M. J. Pellin and J. T. Hupp, Adv. Mater., 2008, 20, 1560–1564. S. M. George, Chem. Rev., 2010, 110, 111-131. A. B. F. Martinson, J. W. Elam, J. Liu, M. J. Pellin, T. J. Marks and J. T. Hupp, Nano Letters, 2008, 8, 2862-2866. Y. Lin, G. Yuan, S. Sheehan, S. Zhou and D. Wang, Energy & Environmental Science, 2011, 4, 4862-4869. Y. J. Lin, S. Zhou, S. W. Sheehan and D. W. Wang, Journal of the American Chemical Society, 2011, 133, 2398-2401. M. Rooth, A. Johansson, K. Kukli, J. Aarik, M. Boman and A. Harsta, Chemical Vapor Deposition, 2008, 14, 67-70. B. M. Klahr, A. B. F. Martinson and T. W. Hamann, Langmuir, 2011, 27, 461-468. S. R. Morrison, Electrochemistry at Semiconductor and Oxidized Metal Electrodes, Plenum, New York, 1980. L. M. Abrantes and L. M. Peter, Journal of Electroanalytical Chemistry and Interfacial Electrochemistry, 1983, 150, 593-601. K. L. Hardee and A. J. Bard, J. Electrochem. Soc., 1977, 124, 215-224. D. Lincot and J. Vedel, Journal of Electroanalytical Chemistry, 1987, 220, 179-200. 25. Page 27 of 34.
(27) Page 28 of 34. Energy & Environmental Science. 45. 46. 47. 48. 49. 50. 51. 52. 53. 54. 55. 56. 57. 58. 59. 60. 61. 62. 63. 64. 65. 66.. 67. 68.. P. Salvador, Journal of Physical Chemistry, 1985, 89, 3863-3869. K. J. McDonald and K. S. Choi, Chemistry of Materials, 2011, 23, 1686-1693. F. Le Formal, M. Graetzel and K. Sivula, Advanced Functional Materials, 2010, 20, 1099-1107. F. Le Formal, N. Tetreault, M. Cornuz, T. Moehl, M. Gratzel and K. Sivula, Chemical Science, 2011, 2, 737-743. K. Sivula, R. Zboril, F. Le Formal, R. Robert, A. Weidenkaff, J. Tucek, J. Frydrych and M. Grätzel, Journal of the American Chemical Society, 2010, 132, 7436-7444. T. Hisatomi, F. Le Formal, M. Cornuz, J. Brillet, N. Tetreault, K. Sivula and M. Gratzel, Energy & Environmental Science, 2011, 4, 2512-2515. J. A. Glasscock, P. R. F. Barnes, I. C. Plumb and N. Savvides, Journal of Physical Chemistry C, 2007, 111, 16477-16488. ****, We found the addition of light was necessary to obtain reproducible results by fully oxidizing the surface species. J. Bisquert, F. Fabregat-Santiago, I. Mora-Sero, G. Garcia-Belmonte, E. M. Barea and E. Palomares, Inorganica Chimica Acta, 2008, 361, 684-698. G. Boschloo and D. Fitzmaurice, The Journal of Physical Chemistry B, 1999, 103, 22282231. T. P. Trainor, A. M. Chaka, P. J. Eng, M. Newville, G. A. Waychunas, J. G. Catalano and G. E. Brown Jr, Surface Science, 2004, 573, 204-224. A. Hellman and R. G. S. Pala, The Journal of Physical Chemistry C, 2011, 115, 1290112907. H. Dau, C. Limberg, T. Reier, M. Risch, S. Roggan and P. Strasser, Chemcatchem, 2010, 2, 724-761. T. R. Cook, D. K. Dogutan, S. Y. Reece, Y. Surendranath, T. S. Teets and D. G. Nocera, Chemical Reviews, 2010, 110, 6474-6502. B. E. Conway and B. V. Tilak, in Advances in Catalysis, Academic Press, New York, 1992, pp. 1-147. J.-U. Rohde, J.-H. In, M. H. Lim, W. W. Brennessel, M. R. Bukowski, A. Stubna, E. Münck, W. Nam and L. Que, Science, 2003, 299, 1037-1039. D.-L. Popescu, M. Vrabel, A. Brausam, P. Madsen, G. Lente, I. Fabian, A. D. Ryabov, R. van Eldik and T. J. Collins, Inorganic Chemistry, 2010, 49, 11439-11448. W. C. Ellis, N. D. McDaniel, S. Bernhard and T. J. Collins, Journal of the American Chemical Society, 2010, 132, 10990-10991. R. L. Blake and R. E. Hessevick, The American Mineralogist, 1966, 51, 123-129. C. M. Eggleston and M. F. Hochella, American Mineralogist, 1992, 77, 911-922. C. M. Eggleston, A. G. Stack, K. M. Rosso, S. R. Higgins, A. M. Bice, S. W. Boese, R. D. Pribyl and J. J. Nichols, Geochimica et Cosmochimica Acta, 2003, 67, 985-1000. ****, The number of active sites per unit cell is estimated by assuming one Fe atom in a given plane per unit cell. Each atom is estimated to have only 1 active site because the formation of 2 oxo groups on a single Fe atom is energetically unfavorable. H. L. Sanchez, H. Steinfink and H. S. White, Journal of Solid State Chemistry, 1982, 41, 90-96. D. K. Zhong, M. Cornuz, K. Sivula, M. Graetzel and D. R. Gamelin, Energy & Environmental Science, 2011, 4, 1759-1764.. 26.
(28) Energy & Environmental Science. 69. 70. 71.. C. Y. Cummings, F. Marken, L. M. Peter, A. A. Tahir and K. G. U. Wijayantha, Chemical Communications, 2012, 48, 2027-2029. D. K. Zhong and D. R. Gamelin, Journal of the American Chemical Society, 2010, 132, 4202-4207. D. K. Zhong, J. W. Sun, H. Inumaru and D. R. Gamelin, Journal of the American Chemical Society, 2009, 131, 6086-6087.. 27. Page 29 of 34.
(29) Page 30 of 34. Energy & Environmental Science. Electrochemical and Photoelectrochemical Investigation of Water Oxidation with Hematite Electrodes Benjamin Klahr†, Sixto Gimenez‡, Francisco Fabregat-Santiago‡, Juan Bisquert‡, Thomas Hamann†*. †. Department of Chemistry, Michigan State University, East Lansing, MI 48824-1322. ‡. Photovoltaics and Optoelectronic Devices Group, Departament de Física, Universitat Jaume I,. 12071 Castelló, Spain *Email: hamann@chemistry.msu.edu. Supporting Information.
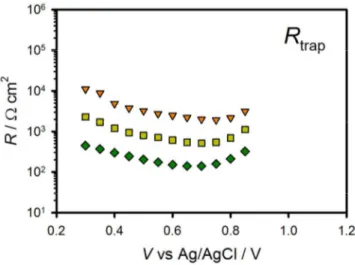
(30) Energy & Environmental Science. Figure S1. Rtrap and Cbulk values fit from IS data of a hematite electrode in contact with a H2O electrolyte in the dark (red circles), under 0.1 sun (orange triangles), 0.33 sun (yellow squares) and 1 sun (green diamonds) illumination.. Figure S2. Cbulk values fit from IS data of a hematite electrode in contact with a [Fe(CN)6]3-/4electrolytes in the dark (red circles), under 0.1 sun (orange triangles), 0.33 sun (yellow squares) and 1 sun (green diamonds) illumination.. Page 31 of 34.
(31) Page 32 of 34. Energy & Environmental Science. Figure S3. Experimentally measured decay (black line) and fits for a single exponential decay (blue small dashed line) and double exponential decay (red long dashed line). The charge measured by the current transients can be related to CSS by the equation Q CSS = where ∆V is the change in the quasi-Fermi level as a result of turning the light off at a ∆V constant potential. Since the surface states probed by IS and transients are expected to be the same, ∆V can be calculated by plotting CSS from EIS vs Q measured from the transients. The inverse of the slope would thus be ∆V. ∆V was found to be 0.07 , 0.13 and 0.16 V for 0.1, 0.33 and 1 sun respectively. This corresponds to an increase of ~80 mV per 10 fold increase in light intensity (inset of figure S4).. Figure S4.CSS from EIS vs Q from transients for a given potential measured under 0.1 Sun (orange triangles), 0.33 sun (yellow squares) and 1 sun (green diamonds) illumination. Insert.
(32) Energy & Environmental Science. Figure S6. Cyclic voltammetry of hematite in [Fe(CN)6]3-/4- electrolyte scanned at 200 mV s-1 after holding the electrode at a potential of 1.4 V vs Ag/AgCl for 60 seconds under 1 sun illumination. The first cycle (solid red line) and the second cycle (dashed orange line) are overlapping.. Figure S7. J-V curve measured for a hematite electrode in a [Fe(CN)6]3-/4- electrolyte (orange curve) and in a H2O electrolyte (red curve). The H2O curve has been shifted by 200 mV to overlap with the [Fe(CN)6]3-/4- curve.. Page 33 of 34.
(33) Page 34 of 34. Energy & Environmental Science. Figure S8. Mott Schotty plot made from Cbulk values measured under 1 sun illumination. The lines represent lines of best fit of the points measured at potentials negative (red circles) and positive (green circles) of the shift in the flat band. The white circles were not used in either fit. Both sets of data were made to share the same slope in the fit. Using this method, the shift in flat band potential is calculated to be 140 mV. Also included is the Css measured under one sun illumination (green diamonds) and the Gaussian fit (green line)..
(34)
Figure
![Figure 1. Steady state J-V curve of a hematite electrode in contact with a H 2 O (red curve) and [Fe(CN) 6 ] 3-/4- (orange curve) electrolyte](https://thumb-us.123doks.com/thumbv2/123dok_es/3361763.606188/7.918.110.467.286.537/figure-steady-state-hematite-electrode-contact-orange-electrolyte.webp)
![Figure 2. Nyquist plots for IS data measured under 1 sun illumination for H 2 O (red circles) and [Fe(CN) 6 ] 3-/4- (orange triangles) electrolytes at (a) 0.70 V vs](https://thumb-us.123doks.com/thumbv2/123dok_es/3361763.606188/8.918.106.487.219.782/figure-nyquist-measured-illumination-circles-orange-triangles-electrolytes.webp)
![Figure 4. Equivalent circuit parameters obtained from fitting IS data for a hematite electrode in contact with H 2 O (a and b) and [Fe(CN) 6 ] 3-/4- (c) electrolytes under 0.1 sun (orange triangles), 0.33 sun (yellow squares) and 1 sun (green diamonds)](https://thumb-us.123doks.com/thumbv2/123dok_es/3361763.606188/11.918.114.549.119.667/equivalent-parameters-obtained-hematite-electrode-electrolytes-triangles-diamonds.webp)
+7
![Figure 5. R tot calculated from dV/dJ of the J-V curves (lines) and from IS data (symbols) for H 2 O and [Fe(CN) 6 ] 3-/4- electrolytes under 1 sun illumination](https://thumb-us.123doks.com/thumbv2/123dok_es/3361763.606188/12.918.115.459.286.531/figure-calculated-curves-lines-data-symbols-electrolytes-illumination.webp)
Documento similar
The integration having been carried out along the real axis, the lowest eigenvalues jump from family to family when crossing the points where the potential is purely
Degradation of the paracetamol with the nanostructure was performed in a quartz glass reactor with a configuration of three electrodes being the iron oxide nanostructure the
The emission at negative voltage for the nanocrystals, is reminiscent of that of the underlying NaCl template. The light intensity at positive polarity, with the tip over a
Figure 6 shows the same normalized intensity as Figure 5 but only for the horizontal segment edges, with measurements of the phasing subaperture on the segment center and shift left
[r]
Figure 3 shows the evolution of the uncertainties in the background prediction, before the fit to the invariant mass distribution described in section 8, as a function of m γγ in
Both the fact that the distribution of the derived oxygen abundance gradients is compatible with a Gaussian distribution and this lack of correlations between the slope values and
A 10 -4 M solution of molecularly dissolved Pc in water and 81% of Py was diluted with water and monitored by UV-vis and CD (Figure 3a, b). The fully aggregated state was
