Correspondence between the habitat of the threatened pudú (Cervidae) and the national protected area system of Chile
7
0
0
Texto completo
(2) Pavez‑Fox and Estay BMC Ecol (2016) 16:1. flowers [7, 9]. As the only specialist deer of the temperate rainforest, this species likely plays a key role as a seed disperser [10, 11]. The restricted home range and its role as a seed disperser have led some authors to suggest that it is possible that viable pudú populations could be maintained within natural reserves [12, 13]; thus, some believe that the pudú is a viable target for conservation efforts. Nationally managed protected areas have been an invaluable tool for in situ conservation [14]. These systems of protected areas have proven their effectiveness at protecting ecosystems and species with respect to the significant pressures of land-use change and land clearing [15]. The Chilean National System of Protected Areas (SNASPE in Spanish) has been a key instrument in determining wildlife conservation strategies in the country. Currently, the SNASPE is comprised of 100 management units distributed among 36 national parks, 49 national reserves, and 15 natural monuments. These units cover an area of 14.5 million hectares corresponding to 19.2 % of mainland Chile; thus, Chile’s current system of protected areas is above the 10 % protected ecosystems per country target threshold set by the Convention on Biological Diversity of the United Nations [16]. However, this system appears to be insufficient for the conservation of the fauna associated with temperate forests [17]. Since over 90 % of protected areas in Chile are concentrated at high latitudes (>43°), the areas with the highest species richness (35.6–41.3° S) remain largely outside the system. This, in turn, increases the risk of extinction not only due to the lack of protected areas in temperate forests but also because these areas are isolated within a mosaic of tree plantations, agricultural landscapes, and urban areas [17]. Although the pudú is commonly cited as the most common herbivore in national parks [18], there are no systematic records of its presence in these areas [7]. The conservation of a rare species is a difficult task considering the lack of information about current and potential habitats or habitat requirements [19]. Subsequently, predictive models, such as niche-based modeling, can be useful for obtaining reliable distribution maps to assess the suitability of proposed sites for conservation [20]. In this regard, the emergence of new mathematical methods for estimating potential distributions has complemented the lack of data [2, 21–23]. These methods often use the environmental characteristics of areas where a species is known to inhabit in order to estimate the environmental suitability of regions that currently lack records [24]. Currently, mathematical modeling of species distributions has several applications in conservation science including the prediction of geographic ranges of threatened or rare species [25–27], the identification of priority areas for conservation efforts [28, 29], the evaluation. Page 2 of 7. of extinction risk and/or suitable sites for reintroduction programs, and the implementation of wildlife corridors [20]. Considering the ecological importance of the pudú and the lack of up to date information concerning the distribution and conservation status of this species, in this study we estimate the distribution of the pudú within the National System of Protected Areas of Chile. Additionally, we evaluate the effectiveness of the system for the conservation of this species, define the priorities for new areas to protect, and evaluate the reduction of potential pudú habitat due to landscape fragmentation.. Methods Study area. Although originally encompassing an area of 300,000 km2 [30, 31], the geographical range of the temperate rainforest of Chile and Argentina has been considerably reduced at geological time scales as a result of the advance and retreat of mountain glaciers during the Pleistocene [32], and in recent history due to large-scale human impacts on the landscape [33]. Now remnant vegetation covers just 30 % of the original area [31]. The current distribution of the temperate rainforest ranges from 38–49°S on the Chilean side of the Andes and adjacent areas of the provinces of Neuquén, Río Negro, and Chubut in Argentina [34]. The temperate rainforest has a Mediterranean pluviseasonal bioclimate and a temperate and sub-Mediterranean hyper-oceanic bioclimate [35]. The temperate rainforest of Chile encompasses the Valdivian Rainforest Ecoregion, which has been listed among the most endangered ecoregions of the world and has a critical conservation status [36, 37]. The high number of endemic birds (2 %), mammals (16 %), reptiles (62 %), amphibians (54 %) and plant species (49 %) makes this region biologically valuable. Hence, the Valdivian Rainforest Ecosystem is considered a hotspot of biodiversity and, therefore, a region of high conservation priority [31, 38, 39]. Occurrence data. Records of occurrence of the pudú were collected from several sources found in the literature [6, 8, 40, 41], as well as from databases of museum collections like MaNIS [42]. Points were considered only within the distribution range normally cited for Chile and Argentina [4, 5], since records of the southern area are controversial and their validity is unclear [41, 43]. In total, we considered 135 points of occurrence, of which 73 are located in Chile and 62 are located in Argentina (Fig. 1). In the event that the occurrences were not georeferenced (only location names), a standard procedure was followed whereby coordinates were assigned using the Gazetter GeoNames (http://www.geonames.org). Details of the presence.
(3) Pavez‑Fox and Estay BMC Ecol (2016) 16:1. Page 3 of 7. layers of the pudú distribution and the Chilean system of protected are were obtained from the IUCN [4] and the Chilean Forest Service (CONAF), respectively. Considering records of individuals moving up to 20 km in Argentina [46], and the fact that the pudú has an evolutionary history in the region, the study area used to train the model was defined by bounding the observed presences with a buffer of 100 km as a reasonable proxy of the area that has been accessible and probably explored [47, 48] by this small cervid. Processing of the environmental layers was performed in QGIS 2.10 and GRASS7. Statistical methods. Fig. 1 Georeferenced occurrence points of P. puda used for model fitting (red) in Chile (light grey) and Argentina (green). Dark blue poly‑ gons represent protected areas of Chile within the study area. points including source, year, and coordinates can be found in the Additional file 1. Environmental and geographic data. Global layers of the current weather conditions were obtained from the WorldClim database; the data have a spatial resolution of 2.5 arc—minutes (~5 km; [44]). These layers contain grouped variables collected monthly from 1950 to 2000. The variables used were selected according to previous modeling studies of other species of deer (e.g. Odocoileus hemionus; [45]). The following variables were used: average annual temperature (Ann T°), mean diurnal temperature range (MDR), temperature seasonality (T° S), maximum temperature of the warmest month (T° Max), minimum temperature of the coldest month (T° Min), annual precipitation (Ann Pp), seasonal precipitation (Pp S), precipitation over the wettest quarter (Pp Wet), precipitation of the driest quarter (Pp Dri), precipitation of the warmest quarter (Pp War), and precipitation of the coldest quarter (Pp Col). In addition to these variables, altitude (Alt) [44] was also incorporated in the analysis. The. A practical way to estimate the geographic distribution of a species is by characterizing the environmental conditions that are currently suitable for its persistence [49] and then identifying those areas where such conditions may be found [50]. A group of quantitative modeling approaches, known collectively as species distribution models (SDM), have been widely used to predict the potential geographic distribution of several animal species [24, 25, 49, 50]. Species distribution models are numerical tools that combine observations of species (either presence or presence and absence data) in a set of locations with environmental variables to obtain ecological and evolutionary insights and to predict distributions across landscapes [11, 15]. Considering that only presence data could be gathered to estimate the pudú geographical distribution, a maximum entropy approach was implemented in the Maxent 3.3.3 k software [51–53] as our ecological niche modeling approach. The Maxent model is a probability distribution selected by maximizing the entropy subject, which is constrained in that the expected value of each environmental variable under this uniform distribution should match the empirical value [51, 52]. The logistic model output represents the degrees of “habitat suitability”, ranging from 0 (not suitable) to 1 (suitable) [49]. The Maxent model was fitted using the default settings, and then it was evaluated using the AUC of the ROC curve and the “regularized training gain”. The ROC curve corresponds to the graph between 1—specificity (false positive rate) versus sensitivity (rate of true positives, [52]). The AUC measures the ability (probability) of the Maxent model to discriminate between presence sites and background sites [51, 54, 55]. The relative importance of each variable was estimated using the jack-knife method. First, the decrease in gain is calculated by adjusting the model using all variables except the focal variable and comparing this value with the gain of the full model (including all variables). Then, the model is fit using only the focal variable and comparing the gain with respect to the full model. The Maxent model results correspond.
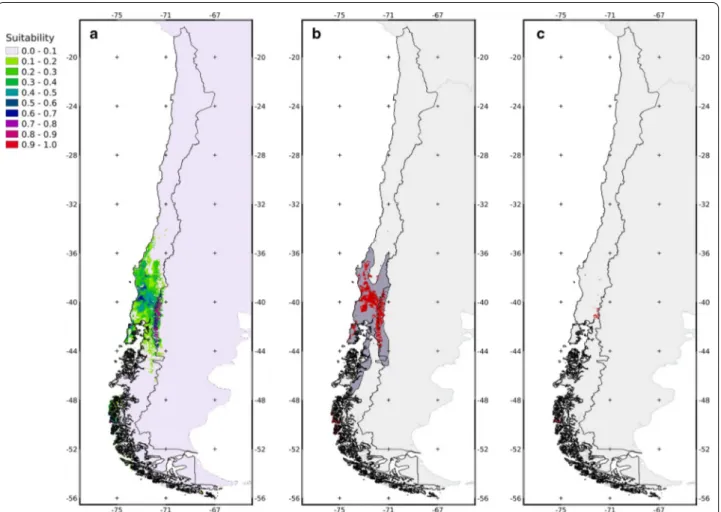
(4) Pavez‑Fox and Estay BMC Ecol (2016) 16:1. to the average value of 20 replicas using a cross-validation framework [54, 56]. We used 20 replicates instead of the standard 10 just to increase our evaluation of the model’s predictive ability. The cross-validation scheme divides the dataset into 20 subsets. In each step, the model is fitted using 19 subsets and using the last dataset (independent) to test (validate) the fit. This procedure is repeated 20 times, and the AUC and jackknife values reported correspond to the average value of the 20 testing procedures. Post‑processing. Our results are focused and restricted to Chilean habitats and protected areas. The fitted model, trained in the study area, was later projected to Chile, to estimate the distribution of the species. The original map was converted to a binary map (0 = no-suitable, 1 = suitable), applying a threshold that maximizes sensitivity and specificity [57] to obtain a balance between commission and omission errors. Then, the percentage of the area contained in the public protected areas was calculated for the distribution map (Fig. 1). In addition, the percentage of area containing the pudú distribution proposed by the IUCN was calculated.. Results The most suitable areas for the pudú were restricted to the central valley (between the Andes and the Cordillera de la Costa) at low altitudes in the Andes from 38.67 to 39.81°S and in some isolated patches from 42.02°S southwards (Fig. 2a). The AUC for the model was 0.818, indicating a high predictive capacity [55]. The most important variables, according to their effect on the training gain (decrease), were seasonal temperature and mean diurnal temperature range (Table 1). Furthermore, the analysis of the models including only one variable showed that the models fitted with only seasonal temperature, precipitation of the driest quarter, and mean diurnal temperature range, had the highest values of gain (Table 1). The threshold that maximizes sensitivity and specificity was 0.3591, which was used to obtain the binary maps. The pudú distribution predicted by the Maxent model had an estimated area of 79,047 km2 (33,934 km2 in Chile, 43 %), 37,722 km2 (29.4 %) of which matched the IUCN estimated distribution of 128,278 km2 (Fig. 2b). The area of the model-predicted distribution contained in Chilean protected areas is almost entirely located at high altitudes of the Andes. There was only 4644 km2 of overlap between the predicted distribution of the pudú and area currently being protected in Chile; this overlap represents only 5.87 % of the complete distribution of the pudú (Fig. 2c).. Page 4 of 7. Discussion The estimated distribution of the pudú calculated here is almost entirely contained within the area described by the IUCN for this species [4], however the predicted distribution is less extensive in size. The predicted distribution lies within the Valdivian Rainforest Ecoregion, which is consistent with the habitat preferences previously described for this temperate rainforest associated species [5, 6, 39]. Studies have noted that this species prefers rainforest habitats where it can find shelter and highly nutritional food [7, 9]. The most suitable habitats for the pudú were located in the central valley (central depression) of Chile. This area is currently a highly fragmented landscape with isolated populations that are vulnerable to strong anthropogenic pressures [58]. Furthermore, in this area the system of public protected areas (SNASPE) has low coverage making the viability of these remnant populations more difficult (Fig. 2c). Landscape fragmentation in the central valley has resulted in the degradation of the most favorable pudú habitats. As has been found for other species, this fragmentation has forced relict populations to persist in the periphery of their historical geographic range [59]. The model supports the presence of the pudú in the 14 protected areas cited in the literature: the Vicente Perez Rosales, Puyehue, Villarrica, Tolhuaca, Conguillo, and Chiloé National Parks; and the Nonguen, Ñuble, Altos de Pemehue, Isla Mocha, Huerquehue, Mocho Choshuenco, Alerce Costero, and Futaleufu National Reserves (Figs. 1, 2c). The percentage of the predicted pudú distribution in protected areas was low, and in most cases these were not considered to be the most suitable areas for the species according to our models. Due to the fact that the majority of the overlay between pudú favorable habitat and protected area being located in the Andes, together with the low representation of protected areas in the central valley and the coast, imply a major threat to the species as a result of isolation between these populations [60–62]. Suitable areas outside the protected parks represent an opportunity for the conservation of this cervid. Approximately 14,000 km2 of the area around the parks houses broadleaved forests in different stages of conservation [63] that are currently being used for pudú corridors and refuges. However, the high fragmentation of these lands makes coordinating conservation efforts difficult. The most important variables affecting the estimated distribution of the pudú were the mean diurnal temperature range and temperature seasonality (these variables were selected using two different criteria). According to the models, mean diurnal temperate range was negatively related with habitat suitability. This suggests that the pudú is intolerant to sudden changes in temperature throughout the day and is probably better adapted to tolerate.
(5) Pavez‑Fox and Estay BMC Ecol (2016) 16:1. Page 5 of 7. Fig. 2 Model results: a Projection of the model fitted for the Chilean territory. Colors represent the suitability of each pixel for P. puda habitat. b Binary map of the projection of the model fitted for the Chilean territory (red) with respect to the distribution determined by the IUCN (dark grey) for P. puda. c Overlap areas between P. puda suitable areas and protected areas according to the model (red). low rather than high temperatures. This is in agreement with previous studies, which indicate that the pudú is less active when the sun’s intensity is highest and instead is more active during sunrise and sunset [8]. The same negative effect of sunlight or temperature has been described for the kudu (Tragelaphus strepsiceros), elk (Cervus canadensis), and other deer species (i.e. Odocoileus spp.) [64]. Moreover, some authors suggest that ungulate species inhabiting temperate climates would have a lower tolerance to high temperatures than ungulates inhabiting non-temperate climates [64, 65]. On the other hand, the relationship between temperature seasonality and habitat suitability found in this study was irregular, but in general it has been suggested that the pudú can tolerate moderate seasonal variation in temperature, which could be due to the relationship between temperature and the availability of vegetation that it feeds on [66, 67]. The current condition of the pudú within the Chilean system of protected areas remains unknown;. however, it has been suggested that even within national parks and reserves, there are still anthropogenic threats such as the presence of feral dogs and domestic livestock [68]. The categorization of the species as Vulnerable according to the IUCN seems to be appropriate given the low representation of suitable habitat within protected areas and the limited amount of information on the status of wild populations. It is therefore crucial to implement new protected areas within the central valley, which could serve as corridors to reduce the rate of species extinctions and increase the likelihood of the re-colonization of parks [60, 67]. The importance of the pudú extends beyond the species’ ecological role. As the pudú is a small charismatic species, this deer is a good candidate flagship species that could help attract public attention and sympathy to the conservation of these important habitats, and this, in turn, would likely be of benefit to other species [68]..
(6) Pavez‑Fox and Estay BMC Ecol (2016) 16:1. Page 6 of 7. Table 1 Jackknife statistics of model performance and relative importance of each variable Environmental variables. Training gain. Alt. 0.942†−0.120. Ann T°. 0.938†−0.101. Ann Pp. 0.955−0.295. Pp S. 0.946−0.240. Pp Wet. 0.952−0.254. Pp Dri. 0.955−0.325‡. Pp War. 0.956−0.326‡. Pp Col. 0.949−0.257. MDR. 0.903†−0.328‡. T° S. 0.879†−0.326‡. T° Max. 0.948−0.118. T° Min. 0.951−0.068. For each variable, the first value corresponds to the gain of a model fitted using all variables except the focal one. The most important variables according to this criterion are marked with † The second value corresponds to the gain of a model fitted using only the focal variable. The most important variables according to this criterion are marked with ‡ (see “Methods” for details). Conclusions Overall, the results of this study indicate that the habitat of this endangered cervid is poorly represented in the Chilean system of nationally protected areas. Habitat within this system only represents marginal (less suitable) sites of the pudú’s original distribution. Currently, the more suitable areas, in the central valley of Chile, are highly fragmented and used for agricultural, forestry, or other human activities. This highly fragmented land may be a major obstacle for conservation efforts. Initiatives such as new protected areas (public and private), feral dog control, habitat conservation, among others, will contributed to the viability of the small remnant populations of pudú in the central valley. Additional file Additional file 1. List of the presence points used in this study. The table includes information source, year recorded, and coordinates.. Abbreviations IUCN: International Union for Conservation of Nature; SNASPE: Chilean National System of Protected Areas; MaNIS: The Mammal Networked Informa‑ tion System; AUC: area under the curve; ROC: receiver operating characteristic. Authors’ contributions Both authors contributed to the conception and design of the study, inter‑ pretation of analyses, and critical revision of the manuscript. MPF collected data, carried out the analyses, and drafted the paper. Both authors read and approved the final manuscript. Author details 1 Instituto de Ciencias Ambientales y Evolutivas, Facultad de Ciencias, Universidad Austral de Chile, Valdivia, Chile. 2 Magíster en Ciencias Biológicas. mención Neurociencia, Facultad de Ciencias, Universidad de Valparaíso, Val‑ paraíso 2360102, Chile. 3 Center of Applied Ecology and Sustainability (CAPES), Facultad de Ciencias Biológicas, Pontificia Universidad Católica de Chile, Santiago 6513677, Chile. Acknowledgements We thank Stella Januario and Daniela López for their help during the prepara‑ tion of the manuscript. Funded by CAPES-CONICYT grant FB-0002, line 4. Competing interests The authors declare that they have no competing interests. Received: 3 May 2015 Accepted: 23 December 2015. References 1. Ehrlich PR. The loss of diversity: Causes and consequences. In: Wilson O, editor. Biodiversity. Washington: National Academic Press; 1988. p. 21–7. 2. Papes M, Gaudet P. Modelling ecological niches from low numbers of ocurrences: assessment of the conservation status of poorly known viverrids (Mammalia, Carnivora) across two continents. Divers Distrib. 2007;13:890–902. 3. Weber M, Gonzalez S. Latin American deer diversity and conservation: a review of status and distribution. Ecoscience. 2003;10:443–54. 4. Jiménez J, Ramilo E. Pudu puda. In: IUCN. IUCN Red List of Threatened Species. 2013. www.iucnredlist.org. Accessed 25 Sept 2014. 5. Miller S, Rottmann J, Taber R. Dwindling and endangered ungulates of Chile: Vicugna, Lama, Hippocamelus, and Pudu. TN Am Wildl Nat Res. 1973;38:55–68. 6. Meier D, Merino ML. Distribution and habitat features of southern pudu (Pudu puda Molina, 1782) in Argentina. Mamm Biol. 2007;72:204–12. 7. Jiménez JE. Southern pudu Pudu puda (Molina 1782). In: Barbanti JM, González S, editors. Neotropical Cervidology: biology and medicine of latin american deer. Jaboticabal: Funep and IUCN; 2013. p. 140–50. 8. Eldridge WD, MacNamara MM, Pacheco NV. Activity patterns and habitat utilization of pudus (Pudu puda) in South-Central Chile. In: Wemmer CM, editor. Biology and management of the Cervidae. Washington: Smithso‑ nian Institution Press; 1987. p. 352–70. 9. Pavez-Fox M, Pino M, Corti P. Muzzle morphology and food consumption by pudu (Pudu puda Molina 1782) in south-central Chile. Stud. Neotrop. Fauna Environ. 2015; 1–6. 10. Novillo A, Ojeda RA. The exotic mammals of Argentina. Biol Invasions. 2008;10:1333–44. 11. Stoner KE, Riba-Hernández P, Vulinec K, Lambert JE. The role of mammals in creating and modifying seedshadows in Tropical forests and some possible consequences of their elimination. Biotropica. 2007;39:316–27. 12. Shaffer M. Minimum viable populations: doping with uncertainty. In: Soulé M, editor. Viable populations for conservation. Cambridge: Cam‑ bridge University Press; 1987. p. 69–86. 13. Simonetti JA, Mella JE. Park size and the conservation of Chilean mam‑ mals. Rev Chil Hist Nat. 1997;70:213–20. 14. Chape S, Harrison J, Spalding M, Lysenko I. Measuring the extent and effectiveness of protected areas as an indicator for meeting global biodi‑ versity targets. Proc R Soc B. 2005;360:443–55. 15. Bruner AG, Gullison RE, Rice RE, da Fonseca GAB. Effectiveness of Parks in protecting tropical biodiversity. Science. 2001;291:125–8. 16. UNEP-WCMC. United Nations Environment Programme—World Conserva‑ tion Monitoring Centre: Green Report 2009. Cambridge: UNEP-WCMC; 2010. 17. Armesto JJ, Rozzi R, Smith-Ramírez C, Arroyo MTK. Conservation targets in South American temperate forests. Science. 1998;282:1271–2. 18. CONAMA. Biodiversidad de Chile: Patrimonio y desafíos. Santiago: MMA; 2008. 19. Silva-Rodríguez EA, Verdugo C, Aleuy OA, Vianna JA, Vidal F, Jiménez JE. Priorities for the conservation of the pudu (Pudu puda) in southern South America. Anim Prod Sci. 2011;51:375–7. 20. Chefaoui RM, Hortal J, Lobo JM. Potential distribution modelling, niche characterization and conservation status assessment using GIS tools: a case study of Iberian Copris species. Biol Cons. 2005;122:327–38..
(7) Pavez‑Fox and Estay BMC Ecol (2016) 16:1. 21. Gaubert P, Papes M, Peterson AT. Natural history collections and the conservation of poorly known taxa: ecological niche modeling in central African rainforest genets (Genetta spp.). Biol Cons. 2006;130:106–17. 22. Peterson AT, Soberón J, Sánchez-Cordero V. Conservatism of ecological niches in evolutionary time. Science. 1999;285:1265–7. 23. Phillips SJ, Dudik M, Schapire RE. A maximum entropy approach to spe‑ cies distribution modeling. In: Proceedings of the twenty-first interna‑ tional conference on Machine learning. New York: ACM Press; 2004. p. 655–662. 24. Anderson RP, Peterson AT, Gómez-Laverde M. Using niche-based GIS modeling to test geographic predictions of competitive exclusion and competitive release in South American pocket mice. Oikos. 2002;98:3–16. 25. Anderson RP, Martínez-Meyer E. Modeling species’ geographic distri‑ butions for preliminary conservation assessments: an implementa‑ tion with the spiny pocket mice (Heteromys) of Ecuador. Biol Cons. 2002;116:167–79. 26. Loiselle BA, Howell CA, Graham CH, Goerck JM, Brooks T, Smith KG, et al. Avoiding pitfalls of using species-distribution models in conservation planning. Conserv Biol. 2003;17:1–10. 27. Raxworthy CJ, Martínez-Meyer E, Horning N, Nussbaum RA, Schneider GE, Ortega-Huerta MA, et al. Predicting distributions of known and unknown reptile species in Madagascar. Nature. 2004;426:837–41. 28. Peterson AT, Egbert SL, Sánchez-Cordero V, Price KP. Geographic analysis of conservation priority: endemic birds and mammals in Veracurz. Mexico Biol Cons. 2000;93:85–94. 29. Rondini C, Stuart S, Boitani L. Habitat suitability models and the shortfall in conservation planing for African vertebrates. Cons Biol. 2005;19:1488–97. 30. Alaback PB. Comparative ecology of temperate rainforests of the Americas along analogous climatic gradients. Rev Chil Hist Nat. 1991;64:399–412. 31. Myers N, Mittermeier RA, Mittermeier CG, da Fonseca GAB, Kent J. Biodi‑ versity hotspots for conservation priorities. Nature. 2000;403:853–8. 32. Armesto J, Rozzi R, Caspersen J. Temperate forests of North and South America. In: Chapin F, Sala O, Huber-Sannwald E, editors. Global biodiver‑ sity in a changing environment. Scenarios for the 21st Century. New York: Springer; 2011. p. 223–49. 33. Armesto J, Villagrán C, Donoso C. Desde la era glacial a la industria: la historia del bosque templado chileno. Ambiente y Desarrollo. 1994;10:66–72. 34. Lücking R, Wirth V, Ferraro LI, Cáceres MES. Foliicolous lichens from Valdiv‑ ian temperate rain forest of Chile and Argentina: evidence of an austral element, with the description of seven new taxa. Global Ecol Biogeogr. 2003;12:21–36. 35. Luebert F, Pliscoff P. Sinopsis bioclimática y vegetacional de Chile. San‑ tiago: Editorial Universitaria; 2004. 36. Dinerstein EDM, Olson DM, Graham DJ, Webster AL, Primm SA, Book‑ binder MP, Ledec G. A conservation assessment of the terrestrial ecore‑ gions of Latin America and the Caribbean. Washington: The World Bank; 1995. 37. Olson DM, Dinerstein E. Issues in International Conservation: the Global 200: a representation approach to conserving the Earth’s most biologi‑ cally valuable ecoregions. Cons Biol. 1998;12:502–15. 38. Smith-Ramírez C. The Chilean coastal range: a vanishing center of biodi‑ versity and endemism in South American temperate rainforests. Biodivers Conserv. 2004;13:373–93. 39. Ormazábal CS. The conservation of biodiversity in Chile. Rev Chil Hist Nat. 1993;66:383–402. 40. Fuentes-Hurtado M, Marín JC, González-Acuña D, Verdugo C, Vidal F, Vianna JA. Molecular divergence between insular and continental Pudu deer (Pudu puda) populations in the Chilean Patagonia. Stud Neotrop Fauna E. 2011;46:23–33. 41. Hershkovitz P. Neotropical deer (Cervidae). Part I. Pudus, genus Pudu Gray. Fieldana Zool New series. 1982;11:1–86. 42. Stein BA, Wieczorek J. Mammals of the world: MaNIS as an example of data integration in a disturbed network environment. Biodiversity Infor‑ matics. 2004;1:14–22. 43. Muñoz-Pedreros A, Yañez, J. Mamíferos de Chile. Temuco Chile: Centro de Estudios Agrarios & Ambientales (CEA) and Museo Nacional de Historia Natural de Chile; 2000.. Page 7 of 7. 44. Hijmans RJ, Cameron SE, Parra JL, Jones PG, Jarvis A. Very high resolu‑ tion interpolated climate surfaces for global land areas. Int J Climatol. 2005;25:1965–78. 45. Pease KM, Freedman AH, Pollinger JP, McCormack JE, Buermann W, Rodzen J, et al. Landscape genetics of California mule deer (Odocoileus hemionus): the roles of ecological and historical factors in generating differentiation. Mol Ecol. 2009;18:1848–62. 46. Jiménez JE. Southern pudu Pudu puda (Molina 1782). In: Barbanti Duarte, JM, Gonzalez S, editors. Neotropical Cervidology: Biology and Medicine of Latin American Deer. Funep & IUCN, Jaboticabal & Gland. 2010. p. 140–150. 47. Peterson AT, Soberón J, Pearson RG, Anderson RP, Martínez-Meyer E, Nakamura M, Araújo MB. Ecological Niches and Geographic Distributions (MPB-49). Princeton University Press. 2011. 48. Peterson AT. Mapping disease transmission risk: enriching models using biogeography and ecology. Baltimore: JHU Press; 2014. 49. Pearson RG, Raxworthy CJ, Nakamura M, Peterson AT. Predicting species distributions from small numbers of ocurrence records: a test case using cryptic geckos in Madagascar. J Biogeography. 2007;34:102–17. 50. Franklin J. Mapping species distribution: spatial inference and prediction. Cambridge: Cambridge University Press; 2009. 51. Phillips SJ, Anderson RP, Schapire RE. Maximum entropy modeling of spe‑ cies geographic distributions. Ecol Model. 2006;190:231–59. 52. Phillips SJ, Dudik M. Modeling of species distributions with Max‑ ent: new extensions and a comprehensive evaluation. Ecography. 2008;31:161–75. 53. Elith J, Phillips SJ, Hastie T, Dudík M, En Chee Y, Yates CJ. A statistical expla‑ nation of MaxEnt for ecologists. Divers Distrib. 2011;17:43–57. 54. Fielding AH, Bell JF. A review of methods for the assessment of predic‑ tion errors in conservation presence/absence models. Environ Conserv. 1997;24:38–49. 55. Hosmer DW, Lemeshow S. Applied Logistic Regression. New York: Wiley and Sons; 1989. 56. Hijmans RJ. Cross-validation of species distribution models: remov‑ ing spatial sorting bias and calibration with a null model. Ecology. 2012;93:679–88. 57. Liu C, White M, Newell G. Selecting thresholds for the prediction of spe‑ cies occurrence with presence-only data. J Biogeogr. 2013;40:778–89. 58. Bello MA. Ecología del pudú (Pudu pudu, Molina 1782) y su valor como especie focal, en la Provincia de Valdivia, Ecorregión Valdiviana. Temuco: Thesis Universidad Católica de Temuco; 2003. 59. Naves J, Wiegand T, Revilla E, Delibes M. Endangered species constrained by natural and human factors: the case of brown bears in Northern Spain. Cons Biol. 2003;17:1276–89. 60. Harris LD. The fragmented forest: island biogeography theory and the preservation of biotic diversity. Chicago: The University of Chicago Press; 1984. 61. Bennett AF. Linkages in the landscape: the role of corridors and connec‑ tivity in wildlife conservation. 2nd ed. Cambridge UK: IUCN; 2003. 62. Carey C, Nigel D, Stolton S. Squandering paradise? The importance and vulnerability of the world’s protected areas. Gland Switzerland: World Wildlife Found; 2000. 63. USGS. Global land cover characterization. South America land cover characteristics data base version 2.0. 2008. http://edc2.usgs.gov/glcc/ sadoc2_0.php#usgs. Accessed 20 Jan. 64. Belovsky GE, Slade JB. Time budgets of grassland herbivores: body size similarities. Oecologia. 1986;70:56–62. 65. Owen-Smith N. How high ambient temperature affects the daily activity and foraging time of a subtropical ungulate, the greater kudu (Tragelaphus strepsiceros). J Zool. 1998;246:183–92. 66. Ogutu JO, Piepho HP, Dublin HT, Bhola N, Reid RS. Rainfall influences on ungulate population abundance in the Mara-Serengeti ecosystem. J Anim Ecol. 2008;77:814–29. 67. Ogutu JO, Owen-Smith N. ENSO, rainfall and temperature influences on extreme population declines among African savanna ungulates. Ecol Lett. 2003;6:412–9. 68. Silva-Rodríguez EA, Verdugo C, Aleuy OA, Sanderson JG, Ortega-Solís GR, Osorio-Zúñiga F, et al. Evaluating mortality sources for the vulnerable pudu Pudu puda in Chile: implications for the conservation of a threat‑ ened deer. Oryx. 2010;44:97–103..
(8)
Figure

Documento similar
Government policy varies between nations and this guidance sets out the need for balanced decision-making about ways of working, and the ongoing safety considerations
No obstante, como esta enfermedad afecta a cada persona de manera diferente, no todas las opciones de cuidado y tratamiento pueden ser apropiadas para cada individuo.. La forma
In the “big picture” perspective of the recent years that we have described in Brazil, Spain, Portugal and Puerto Rico there are some similarities and important differences,
1. S., III, 52, 1-3: Examinadas estas cosas por nosotros, sería apropiado a los lugares antes citados tratar lo contado en la historia sobre las Amazonas que había antiguamente
In this respect, a comparison with The Shadow of the Glen is very useful, since the text finished by Synge in 1904 can be considered a complex development of the opposition
In the previous sections we have shown how astronomical alignments and solar hierophanies – with a common interest in the solstices − were substantiated in the
While Russian nostalgia for the late-socialism of the Brezhnev era began only after the clear-cut rupture of 1991, nostalgia for the 1970s seems to have emerged in Algeria
Díaz Soto has raised the point about banning religious garb in the ―public space.‖ He states, ―for example, in most Spanish public Universities, there is a Catholic chapel
