The Next Generation Fornax Survey (NGFS) III Revealing the Spatial Substructure of the Dwarf Galaxy Population Inside Half of Fornax's Virial Radius
8
0
0
Texto completo
(2) The Astrophysical Journal, 859:52 (8pp), 2018 May 20. Ordenes-Briceño et al.. flat-fielding, cross-talk correction).After the CP-processing, we apply further processing using the ASTROMATIC15 software suite to astrometrically calibrate and stack the individual frames and to conduct basic photometry (SCAMP, SWARP, SOURCE EXTRACTOR, hereafter SE; Bertin & Arnouts 1996; Bertin et al. 2002; Bertin 2006).Astrometric and photometric calibration has been performed using the 2MASS astrometric Point Source Catalog (Skrutskie et al. 2006) and SDSS u′g′i′ stripe 82 standard stars, respectively.To ensure accurate photometric calibration, we cross-verified it with the globular cluster catalog from Kim et al. (2013) in the Fornax area, which was compiled using U-, B-, V-, and I-band photometry taken with MOSAICII camera on CTIO/Blanco.We use the empirical transformation equations from Jordi et al. (2006) for the comparison, finding good agreement within the uncertainties.Finally, we proceed to the final image stacking and source detection. In previous contributions (Muñoz et al. 2015; Eigenthaler et al. 2018), we presented the NGFS results, focusing on the inner ∼3 deg2 (rvir/4) region of the Fornax cluster.We presented optical colors and structural parameters for 250 dwarf galaxy candidates, reaching out to a projected distance of ∼350 kpc from NGC 1399; its spatial distribution suggested a rich and substructured dwarf galaxy population extending well beyond these limits. In this paper, we expand upon these initial results by using the surrounding DECam pointings (NGFS tiles 2–7; see Figure 1) to identify 271 new dwarf galaxy candidates, of which 39 are nucleated.In the following, we refer to the surrounding NGFS tiles (2–7) as the outer footprint.Together with the 121 previously found NGFS dwarfs from the central tile (Muñoz et al. 2015; Eigenthaler et al. 2018), there is a total of 392 new dwarfs, of which 56 are nucleated, that were discovered in the NGFS data.Our by-eye dwarf detection strategy used for the central tile is again utilized, where several members of the NGFS team (KAM, KXR, MAT, PE, THP, YOB) independently compiled dwarf candidate lists for tiles 2–7 using RGB full-color image stacks, constructed from the individual u′g′i′ frames. By using cross-matching lists and setting a minimum threshold of three independent detections, we yielded a new robust list of dwarf galaxy candidates projected within rvir/2 of NGC 1399.While all frames are fully reduced, we defer a full-color and stellar population analysis to a future paper and limit the scope of the present work to a monochromatic i′-band presentation of magnitudes, structural parameters, and spatial distribution characteristics. We complement our final catalog with the known dwarf galaxy population in Fornax, using the likely members in the Fornax Cluster Catalog (FCC; Ferguson 1989).In the outer NGFS footprint (0.25<R/Rvir0.5), we find a total of 114 FCC galaxies (29.6%) and in the so-far searched NGFS survey area, a total of 251 literature galaxies (39%; Ferguson 1989; Mieske et al. 2007).Taking into account the dwarfs from existing catalogs and the new NGFS dwarfs, the total Fornax dwarf galaxy population reported in this work consists of 643 dwarfs of which 462 are nonnucleated and 181 are nucleated.. environments, especially in rich galaxy clusters.Statistically significant samples allow us to study their clustering properties on large scales (Muñoz et al. 2015) and potentially probe the dark matter (DM) fine-structure within the cluster halo.This distribution in return serves as an ideal laboratory for comparisons with predictions from structure formation models (e.g., Bovill et al. 2016). Recently, observations have revealed that low-mass dwarf galaxies appear to form surprisingly thin planes in the local universe (Pawlowski et al. 2012; Ibata et al. 2013; Tully et al. 2015). The observations of such planes challenge current ΛCDM models of hierarchical structure formation (Kroupa et al. 2005; Pawlowski et al. 2014).The frequency of the occurrence of such anisotropic distributions in dense environments will inform an updated view of structure formation in modern galaxy formation models.These findings show that deep homogeneous surveys are necessary to highlight the spatial distribution of the faint dwarf galaxies in nearby groups and clusters of galaxies without completeness. In the present work, we attempt to lay the foundation for addressing these issues by investigating the faint dwarf galaxy population in the Fornax galaxy cluster out to half of its virial radius (rvir), using data obtained as part of the Next Generation Fornax Survey (NGFS).The most prominent survey covering the galaxy cluster outskirts (Ferguson 1989), while seminal, is showing signs of age and suffers from shallow detection limits (mB20mag for point sources and μB24mag arcsec−2 in surface-brightness sensitivity) compared to the potential of modern instrumentation.Given the faint surface brightness of dwarf galaxies recently detected in various galaxy aggregates, the goal of this paper is to update the known population of Fornax dwarf galaxies out to rvir/2, where one might expect to witness the transition from the central galaxy population to those residing in the cluster outskirts.The Fornax cluster is the nearest high-density region in the southern hemisphere (m–M=31.51mag or DL=20.0Mpc, Blakeslee et al. 2009). Given that its proximity is twice the central galaxy density and its early-type galaxy (ETG) fraction is larger than its northern hemisphere counterpart, the Virgo Cluster, Fornax is an important nearby laboratory to investigate the dependence of galaxy evolution on the dynamical state of the environment. 2. Observations and Image Processing The data presented in this paper is part of the observed NGFS (Muñoz et al. 2015), an ongoing, panchromatic ∼30 deg2 survey of the Fornax galaxy cluster using the Dark Energy Camera (DECam; Flaugher et al. 2015) mounted on the 4 m Blanco telescope at Cerro Tololo Interamerican Observatory (CTIO). Figure 1 illustrates the Fornax cluster region that is covered by our inner NGFS footprint, which consists of seven tiles centered on the dominant NGC 1399 galaxy, and homogeneously maps the cluster out to ∼50% of its virial radius (rvir;1.4Mpc; Drinkwater et al. 2001). The dwarf galaxy population in the central tile corresponding to rrvir/4 was already studied in Muñoz et al. (2015) and Eigenthaler et al. (2018).All tiles are observed in three optical bands reaching point-source detections with S/N5 at 26.5, 26.1, and 25.3 ABmag in the u′-, g′-, and i′-band, respectively. Initial image processing is carried out by the CTIO Community Pipeline (CP; Valdes et al. 2014), focusing mainly on instrumental signature removal (e.g., bias subtraction,. 3. Structural Parameters of the Dwarf Candidates The surface brightness profiles for the dwarfs are studied with GALFIT (v3.0.5 Peng et al. 2002) using a Sŕsic profile (Sérsic 1963; Caon et al. 1993).Our procedure has been 15. 2. http://www.astromatic.net/software.
(3) The Astrophysical Journal, 859:52 (8pp), 2018 May 20. Ordenes-Briceño et al.. Figure 1. Illustration of the spatial distribution of Fornax dwarf galaxy candidates in a grayscale underlying image from DSS.The footprint of the NGFS survey (inside∼rvir/2), which is indicated by the gray shaded DECam tiles with tile 1 for the central region and tiles 2–7 for the outer region (see also NGFS footprint in Figure 1 Eigenthaler et al. 2018), labeled with their respective numbers (middle panel).The positions of nonnucleated dwarfs are shown by red open circles while the nucleated dwarfs are marked by red circles with a central dot. The left and right panels show examples of the newly detected dwarfs in the different NGFS footprint tiles (2–7).Each stamp image contains the NGFS tile number (bottom right), which contains the corresponding dwarfs galaxy as well as the scale bar (solid line) showing 10. 3 = ˆ 1 kpc at the bottom left of each panel. The gray-dashed circles show NGC 1399-centric distances of rvir/4 (;350 kpc) and rvir/2 (;700kpc).. described in detail in Muñoz et al. (2015) and Eigenthaler et al. (2018).It is an iterative process where the light profile is approximated with a one-component fit to the two-dimensional (2D) galaxy surface brightness distribution.We run GALFIT on cutout images of 105″×105″ in size (10.2kpc× 10.2kpc) using object masks created from SE segmentation maps and PSF models created with PSFEX (Bertin 2011).For nucleated dwarfs, we iterate the method described above several times and improve the object mask in each iteration step until the nucleus is completely masked (see Eigenthaler et al. 2018; Ordenes-Briceño et al. 2018, for more details).The final fitting profile considers only the spheroid light component of the dwarf galaxy, leaving a residual image (original– spheroid model) with the nuclear cluster in the galaxy center.The analysis of the nuclear star clusters will be presented in an upcoming NGFS contribution.In the following, we focus on the structural parameters of the spheroid sample.The dwarf candidates from the outer footprint have absolute i′-band magnitudes in the range −18.80 Mi′−8.78 with photometric errors <0.1mag, effective radii between 1 8and 22 8(reff,i′=0.18–2.22kpc at the Fornax cluster distance of DL=20.0Mpc), a mean Sérsic index of ánñi = 0.81, and an average axis ratio of áb añi ¢ = 0.69.. Comparing the central and outer regions in terms of mean structural parameters and nucleation fraction, we see some interesting differences mostly in the mean magnitudes and effective radii.Nonnucleated dwarfs in the central region are brighter and larger with áMi ¢ñ = -11.99 0.12 mag and áreff, i ¢ñ = 0.61 0.03 kpc, relative to nonnucleated dwarfs in the outer region, which have áMi ¢ñ = -11.65 0.10 mag and áreff, i ¢ñ = 0.55 0.02 kpc. Nucleated dwarfs in the central region have significantly fainter average luminosities but are similar in average size compared to their nucleated counterparts in the outer footprint, áMi ¢ñ = -12.43 0.21mag, áreff, i ¢ñ = 0.91 0.04 kpc (central) and áMi ¢ñ = -13.87 0.2 mag and áreff, i ¢ñ = 0.95 0.04 kpc (outer).These differences are more pronounced when comparing the nucleated and nonnucleated dwarf population, i.e.,the nonnucleated dwarf population is fainter than nucleated dwarfs by DáMi ¢ñ = 0.44 mag in the central region and DáMi ¢ñ = 2.25 mag in the outer region.In addition, the nonnucleated dwarf population is, on average, smaller than the nucleated dwarf population by Dáreff, i ¢ñ = 0.3 kpc and Dáreff, i ¢ñ = 0.4 kpc, in the central and outer regions, respectively. Nonnucleated dwarfs have similar mean sizes and luminosities independent of local environmental density, i.e.,central 3.
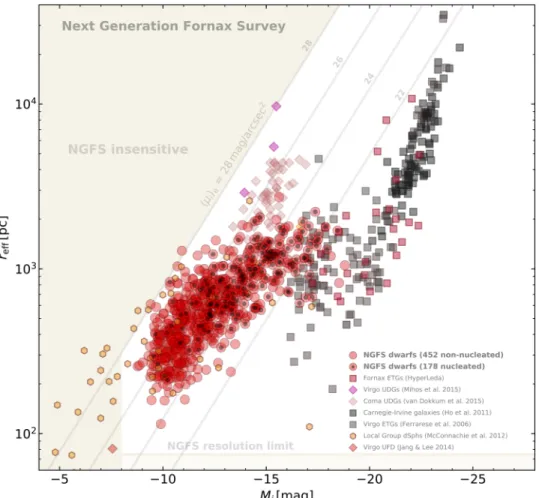
(4) The Astrophysical Journal, 859:52 (8pp), 2018 May 20. Ordenes-Briceño et al. Table 1 Dwarf Galaxies in the Fornax Cluster. ID NGFS033260-341909 NGFS033304-334329. α2000. δ2000. mi (mag). Mi a (mag). nb. reff (arcsec). reffa (kpc). Typec. 03:32:59.92 03:33:03.61. −34:19:08.8 −33:43:29.2. 20.07 15.78. −11.44 −15.73. 1.3208 1.2081. 5.13 12.90. 0.497 1.251. d e. Reference. FCC111. Notes. a Assuming a distance modulus of (m−M)0=31.51mag or DL=20.0Mpc (Blakeslee et al. 2009). b Sérsic index (Sérsic 1963; Caon et al. 1993). c Morphological galaxy type classification: e = nucleated, d = nonnucleated dwarf galaxy. (This table is available in its entirety in machine-readable form.). massive DM halos (e.g., Beasley et al. 2016; van Dokkum et al. 2016), and their population size scales with the mass of the central halo (van der Burg et al. 2016, 2017; Janssens et al. 2017).Together with predictions from theoretical studies, this suggests that UDGs are a consequence of rapidly spinning, massive halos (1010 M) that recently fell into denser environments (e.g., Rong et al. 2017; Amorisco 2018). In our NGFS footprint, six UDG candidates are found in the central region and one in the outer region.Their magnitudes and effective radii are in the range -15.62 Mi ¢ -13.85mag and reff,i′=1.79−2.72 kpc, respectively.Of the seven candidates, two harbor a nuclear star cluster.Their properties make them very similar to UDGs found in other galaxy cluster environments, such as Coma and Virgo (Mihos et al. 2015; van Dokkum et al. 2015).A curious Local Group counterpart is the currently disrupting Sagittarius dwarf galaxy (MV= −13.5mag and reff=2.6 kpc, McConnachie 2012) with its nucleus and the central star cluster M54 (Bellazzini et al. 2008; Mucciarelli et al. 2017). Figure 2 shows that the nucleation fraction of the NGFS dwarf sample decreases strongly with luminosity.The overall nucleation fraction is 28% for the entire luminosity range of the NGFS dwarfs.Nonetheless, the nucleation fraction reaches ∼90% at bright magnitudes, i.e.,Mi′−17 mag and drops to zero at the faintest galaxy luminosities, i.e.,Mi′−9.56 mag.This limit marks the currently faintest nucleated galaxy in the NGFS dwarf galaxy sample (see also Muñoz et al. 2015; Ordenes-Briceño et al. 2018).. versusouter region.However, central nucleated dwarfs are on average about 1.4 mag fainter than nucleated dwarfs in the outer regions.In the central regions, nucleated and nonnucleated have similar magnitudes but different mean sizes. However, in the outer region, nucleated dwarfs are on average brighter and larger than the nonnucleated dwarfs.Table 1 lists the IDs, coordinates, and structural parameters for the dwarf candidates at cluster–centric radii rNGC 1399>rvir/4, complementing the sample from Eigenthaler et al. (2018) for the inner region (rNGC 1399<rvir/4). 4. Discussion 4.1. Size–Luminosity Relation Scaling relations are useful tools to gain insight into the link of the formation processes between different astronomical objects.We illustrate in Figure 2 the size–luminosity relation in terms of the effective radius and absolute i′-band magnitude for the entire NGFS dwarf sample.A total of 452 nonnucleated and 178 nucleated dwarfs are shown.Thirteen dwarfs do not have structural parameter information due to very low surface brightness and/or complicated contamination in their nearby environment (e.g., bright star spikes, detector blemishes, crowded field).To map a large luminosity range, we overplot different galaxy samples, including Local Group dwarfs (McConnachie 2012), ultra-diffuse galaxies from the Coma and Virgo clusters (Mihos et al. 2015; van Dokkum et al. 2015), and giant ellipticals from Fornax, Virgo and the CarnegieIrvine catalog (Ferrarese et al. 2006; Ho et al. 2011).The NGFS dwarf sample by itself covers a range in absolute magnitude of −18.80Mi′−8.78mag and effective radii reff,i′=0.11–2.72 kpc, comprising an effective surface brightness from ámi ¢ñe = 20–28 mag arcsec−2.The sequence of giant ellipticals stretching from the upper-to-center-right of the diagram is connected to that of the NGFS dwarfs and dSphs (center to lower-left) by an intermediate bridge of galaxies.The bridge spans the −20<Mi′<−15 mag, 0.6reff,i′/kpc2 parameter space and blends the brightest NGFS dwarfs with the faint regime of ETGs.We note here that the dwarfs in this group consist primarily of nucleated candidates such that 44/63 of these dwarfs show clear nuclei. UDGs seem to follow their own sequence, roughly along constant effective surface brightness, avoiding the bridge between dwarf and giant galaxies.Although UDGs seem to have similar magnitudes to the brightest dwarf galaxies, they are much more extended. UDGs have been detected in multiple environments (e.g., Koda et al. 2015; Mihos et al. 2015; Muñoz et al. 2015; van Dokkum et al. 2015; Janssens et al. 2017; Lee et al. 2017; Venhola et al. 2017).They show signatures of. 4.2. Spatial Distribution Figure 3 shows the spatial distribution of the dwarf galaxy candidates in the NGFS survey region, with dashed black circles indicating NGC 1399-centric radii of rvir/4 and rvir/2 that correspond to ∼350 and 700 kpc at the distance of Fornax.The dwarfs and giant galaxies are distributed throughout the field with the projected dwarf galaxy surface number density profile, SN (a, d ), shown by the color shading, computed along a 15×15 bins grid—corresponding to physical bin sizes of 152×146kpc2—and show the resulting 2D histogram smoothed with Lanczos interpolation.We also estimate SN (a, d ) by a nonparametric kernel density estimate using a Gaussian kernel of 0°. 25 bandwidth and show resulting curves of iso-density contours by white-scaled thin solid lines.We point out that variations in surface brightness limits due to bright galaxy haloes do not affect the results, as the typical size of a galaxy halo is negligible compared to the area studied here and the structures found therein. Both SN (a, d ) estimates show a general concentration of dwarfs in the core regions of Fornax within 4.
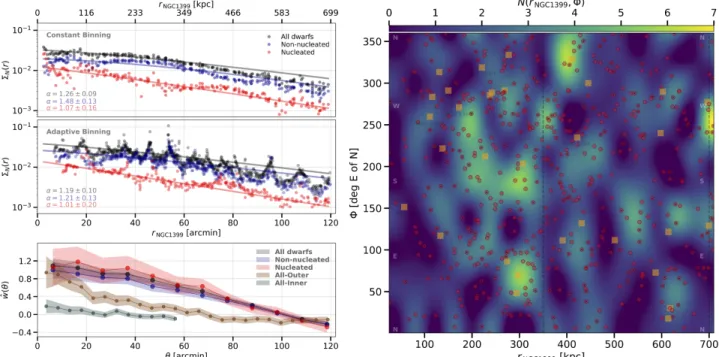
(5) The Astrophysical Journal, 859:52 (8pp), 2018 May 20. Ordenes-Briceño et al.. Figure 2. Size–luminosity relation for dwarf and giant galaxies in Fornax and the nearby universe (see the legend at the bottom right).Galaxy size is given by the effective radius and the luminosity represented as the absolute i′-band magnitude.The NGFS dwarf population is shown with red circles containing black dots, indicating the nucleated galaxies.The data for bright Fornax ETGs were taken from the HyperLeda database (http://leda.univ-lyon1.fr), where the effective radii were computed, in order of preference, from Caon et al. (1994), de Vaucouleurs et al. (1991), and Lauberts & Valentijn (1989).Lines of constant average effective surface brightness are indicated for ámi ¢ñe = 28, 26, 24, 22 mag arcsec−2.An approximate surface brightness limit of our NGFS data is illustrated by the shaded region toward the top left.The spatial resolution limit (0 8 in the i′ filter, corresponding to ∼78pc) is indicated by the lightly shaded region at the bottom part of the diagram; below this limit, objects appear as unresolved point sources in our NGFS data at the distance of Fornax (m−M=31.51mag or DL=20.0Mpc, Blakeslee et al. 2009).. r350 kpc.NGC 1399 itself can be seen to occupy an apparent saddle-point between two main dwarf galaxy overdensities toward the East and West (see Figures 1 and 3, and also Muñoz et al. 2015).The projected distribution of dwarfs in the western over-density generally follows that of the giant galaxies, which may suggest a physical association.While the current data cannot confirm such a connection, we note the contrast with the ∼200kpc scale over-density to the east.This group shows a more regular morphology and lies in between to the projected positions of only two bright galaxies, complicating the notion of physical origins with nearby giant hosts.Weaker density contrasts are found for a third “orphan” group of dwarf candidates located near (α, δ)≈(03h33m,−35°. 75). The top two left-hand panels of Figure 4 show the SN (a, d ) profile calculated with respect to NGC 1399.To guard against potential biases introduced in choosing arbitrary bin sizes, we resample the dwarf galaxies using both a constant and an adaptive binning strategy.For the former, we choose constant bins between 5′ and 25′, in steps of 1′.At each step, we calculate SN (a, d ) in each of the corresponding annuli and show the aggregated data as dots.We have done this procedure for nonnucleated and nucleated dwarfs and the entire dwarf sample.Similarly, the middle panel of Figure 4 shows the data. based on adaptive bin sizes with the three samples described above.Here, bins are chosen such that each of them contains exactly N dwarf candidates with 5 N 25.The constant binning produces a much smoother variation in SN (a, d ), while the adaptive binning shows a sensitivity to local dwarf overdensities resulting in artificially small annuli and corresponding spikes in the SN (a, d ) profile.We approximate the dwarf SN (a, d ) profiles by a power-law model, following other radially dependent projected densities (e.g., SN (a, d ) ∝ exp(A R α); Sérsic 1963; Einasto 1965) by Markov-Chain Monte Carlo (MCMC) sampling.We use MCMC with a normal prior to sample the posterior probability of (A, α) 105 times, which allows sufficient burn-in to skip over stochastic or unreliable results from early iterations so that each chain converges to consistent, well-defined peaks in the marginalized parameter estimate distributions.The resulting ΣN(r) estimates are shown in the two top left panels of Figure 4 as solid curves.The text displays the means of the posterior probability density functions for α alongside the corresponding 95% confidence limits.The projected radial surface number density for the nonnucleated dwarfs has a flat distribution up to ∼350 kpc and slowly declines beyond that radial distance.On the other hand, nucleated dwarfs have a steeper ΣN(r) distribution than nonnucleated dwarfs, being more concentrated 5.
(6) The Astrophysical Journal, 859:52 (8pp), 2018 May 20. Ordenes-Briceño et al.. Figure 3. Distribution of dwarf galaxies (fainter than Mi′≈−19mag) in the Fornax galaxy cluster within about half of its virial radius (∼rvir/2) shown as a surface number density distribution (see colorbar scale).Overplotted are the NGFS dwarf candidates (red dots) and bright Fornax galaxies (Mi′−19mag, orange squares) with NGC 1399 shown by the large square. The black dashed circles show NGC 1399-centric distances of rvir/4 (;350 kpc) and rvir/2 (;700kpc), while the solid contours represent 2D Gaussian KDEs with a 0°. 25 kernel width.. dwarfs, with correlation lengths θ binned in steps of 10′ for the total, nonnucleated, and nucleated samples, and 5′ for the two subsamples.Estimating wˆ (q ) using different bin sizes reveals mild deviations but with the overall behaviors unchanged. Given that the likelihood of finding two points separated by an angular distance θ compared to a purely uniform distribution is encapsulated by wˆ (q ), we find particularly strong evidence for dwarf clustering on sub-100 kpc scales for the overall and outer dwarf population.In particular, the outer dwarf galaxies appear more likely to be clustering on scales approaching ∼50 kpc with a notable decrease on scales 100 kpc.Overall, the apparent smaller clustering scale appears superimposed on the ∼350kpc scale over-density shown in Figure 3.This larger clustering scale is reflected by the almost flat SN (a, d ) profile within ∼350 kpc, outside of which a general steepening of the profile is seen, modulo local, projected dwarf clustering and sub-groups.Conversely, the dwarf population inside of r≈ 350 kpc does not appear to show evidence as strong for clustering at any scale, but we note that the limited spatial region will tend to mute wˆ (q ).In any case, we check against an underlying uniform distribution of dwarf galaxies by creating a large artificial set of three-dimensional dwarf galaxy. in the inner regions near the cD galaxy NGC 1399 and decreasing rapidly outwards. This is similar to the results of Lisker et al. (2007) who found, based on SDSS photometry (MB−13mag), that the bright nucleated dwarf galaxy population in the Virgo galaxy cluster is more centrally concentrated than the nonnucleated dwarf population. The bottom left-panel of Figure 4 shows the results of a two-point angular correlation function (wˆ (q ); Landy & Szalay 1993) analysis of the dwarf galaxy candidates, using the same three samples (nonnucleated, nucleated, and all dwarfs).The two-point angular correlation function quantifies the excess probability of finding galaxy pairs at a given angular separation over a random distribution without a restriction to Gaussianity (e.g., Connolly et al. 2002; Sato et al. 2009) and is typically used to constrain cosmological parameters and structure formation models (e.g., Bernardeau et al. 2002; Cooray & Sheth 2002; Tegmark et al. 2002, 2004; Dolney et al. 2006). Noting the steepening of the SN (a, d ) profile at ∼350 kpc and the ΣN(r) distribution, we split the total sample into those dwarf galaxies inside and outside of this radius and estimate wˆ (q ) for each subpopulation.The solid lines along with ±1σ bounds show the results for the three samples, in addition to all outer and all inner 6.
(7) The Astrophysical Journal, 859:52 (8pp), 2018 May 20. Ordenes-Briceño et al.. Figure 4. Projected surface number density and clustering profiles for NGFS dwarf galaxy candidates.Left, top panels: the two upper panels show radial surface number density distributions of dwarfs using constant (top) and adaptive (middle) binning strategies (see the text).An Einasto profile (Einasto & Haud 1989) is fit to each of these distributions, with the exponential slope and bootstrapped uncertainties indicated.Only the homogeneously sampled region within 700 kpc (rvir/2) of NGC 1399 is considered.Left, bottom panel: the two-point angular correlation functions and associated bootstrapped uncertainties are shown for the total (blue), and outer/inner samples (brown/gray; split at r=350 kpc).Right panel: 2D density distribution showing dwarf clustering in the Φ−rNGC 1399 space, smoothed using Lanczos interpolation. The red circles are dwarf galaxies while orange squares show the locations of bright Fornax galaxies. The dashed vertical lines indicate the NGC 1399-centric radii of rvir/4 (;350kpc) and rvir/2 (;700kpc).. evolution and transformation in the local universe (e.g., Martínez-Delgado et al. 2012; Annibali et al. 2016; OrdenesBriceño et al. 2016; Stierwalt et al. 2017).Theoretical considerations predict that close associations between dwarf galaxies should be common in that as many as 50% of 106 M scale dwarf galaxies might be expected to have companions within ∼50 kpc (Wetzel et al. 2015; Wheeler et al. 2015).Given the isolated natures of many of the recently discovered dwarf pairs/groups, combined with the locations of other purported dwarf groups ranging out to ∼100 kpc from giant galaxy hosts, the current findings may indicate that at least some of these groups are truly interacting in the halos of Fornax giant galaxy members or that they may have origins in the primordial universe and are falling into the Fornax cluster environment for the first time.. coordinates, uniformly distributed within a 1 Mpc radius sphere centered on NGC 1399. We limit this population to those lying within the coordinate limits of our observed sample and extract the 2D projected distances from NGC 1399. Two-sample Kolmogorov–Smirnov tests comparing the simulated NGC 1399-centric projected separations and position angles to the new dwarfs rule out a flat surface density distribution of dwarf galaxies within the NGFS field of view at a very high confidence level (i.e., p=0.004 for separations and p=0.001 for galaxy position angles). The right-hand panel of Figure 4 shows an alternate view of the spatial distribution.Here, we show the projected number density as a function of azimuthal angle (Φ; degrees east of north) and radial distance from NGC 1399.Symbols are the same as in Figure 3 with dashed lines indicating rvir/2 and rvir/4, which corresponds to 350 and 700 kpc from NGC 1399.We apply (DF = 36, DrNGC 1399) binning and smooth the 2D histogram with Lanczos interpolation, which serves to highlight dwarf groupings aligning along “lines-ofsight” to NGC 1399, which do not appear as obvious as in the projected (α, δ) space (see Figure 3).Nevertheless, similar 100 kpc scale over-densities are apparent at all radii, further supporting the nonuniformity of the Fornax dwarf galaxy population, in particular the E–W bimodality shown near rNGC 1399=rvir/4≈350 kpc.Spectroscopic observations are required to assess the phase-space coherence of the found dwarf galaxy over-densities. Taken together, the evidence of clustering at 100 kpc scales within the central cluster–centric radius of ∼1 Mpc of Fornax broadly concurs with the growing observational evidence for the common occurrence, and importance, of dwarf galaxy pairs and groups in low-mass galaxy. Y.O.-B. acknowledges financial support via CONICYTChile (grant CONICYT-PCHA/Doctorado Nacional/201421140651) and the DAAD through the PUC-HD Graduate Exchange Fellowship. P.E. acknowledges support from the Chinese Academy of Sciences (CAS) through CAS-CONICYT Postdoctoral Fellowship CAS150023 administered by the CAS South America Center for Astronomy (CASSACA) in Santiago, Chile. M.A.T. is supported by the Gemini Observatory, which is operated by the Association of Universities for Research in Astronomy, Inc., on behalf of the international Gemini partnership of Argentina, Brazil, Canada, Chile, and the United States of America. T.H.P. acknowledges the support through the FONDECYT Regular Project No.1161817 and the BASAL Center for Astrophysics and Associated Technologies (PFB-06). T.H.P. and A.L. gratefully acknowledge ECOSSud/CONICYT project C15U02. This project used data 7.
(8) The Astrophysical Journal, 859:52 (8pp), 2018 May 20. Ordenes-Briceño et al.. obtained with the Dark Energy Camera (DECam), which was constructed by the Dark Energy Survey (DES) collaboration. Facility: CTIO:Blanco/DECam. Software: astropy (Astropy Collaboration et al. 2013), matplotlib (Hunter 2007), scikit-learn, (Pedregosa et al. 2012), astroML, (VanderPlas et al. 2012) SCAMP (Bertin et al. 2002), SWARP (Bertin 2006), Source Extractor (Bertin & Arnouts 1996), Galfit (Peng et al. 2002).. Dolney, D., Jain, B., & Takada, M. 2006, MNRAS, 366, 884 Drinkwater, M. J., Gregg, M. D., Holman, B. A., & Brown, M. J. I. 2001, MNRAS, 326, 1076 Eigenthaler, P., Puzia, T. H., Taylor, M. A., et al. 2018, ApJ, 855, 142 Einasto, J. 1965, TrAlm, 5, 87 Einasto, J., & Haud, U. 1989, A&A, 223, 89 Ferguson, H. C. 1989, AJ, 98, 367 Ferrarese, L., Côté, P., Jordán, A., et al. 2006, ApJS, 164, 334 Ferrarese, L., Côté, P., Sánchez-Janssen, R., et al. 2016, ApJ, 824, 10 Flaugher, B., Diehl, H. T., Honscheid, K., et al. 2015, AJ, 150, 150 Grebel, E. K., Gallagher, J. S., III, & Harbeck, D. 2003, AJ, 125, 1926 Ho, L. C., Li, Z.-Y., Barth, A. J., Seigar, M. S., & Peng, C. Y. 2011, ApJS, 197, 21 Hunter, J. D. 2007, CSE, 9, 90 Ibata, R. A., Lewis, G. F., Conn, A. R., et al. 2013, Natur, 493, 62 Janssens, S., Abraham, R., Brodie, J., et al. 2017, ApJL, 839, L17 Jordi, K., Grebel, E. K., & Ammon, K. 2006, A&A, 460, 339 Kim, H.-S., Yoon, S.-J., Sohn, S. T., et al. 2013, ApJ, 763, 40 Koda, J., Yagi, M., Yamanoi, H., & Komiyama, Y. 2015, ApJL, 807, L2 Kroupa, P., Theis, C., & Boily, C. M. 2005, A&A, 431, 517 Landy, S. D., & Szalay, A. S. 1993, ApJ, 412, 64 Lauberts, A., & Valentijn, E. A. 1989, The Surface Photometry Catalogue of the ESO-Uppsala Galaxies (Garching: European Southern Observatory) Lee, M. G., Kang, J., Lee, J. H., & Jang, I. S. 2017, ApJ, 844, 157 Lisker, T., Grebel, E. K., Binggeli, B., & Glatt, K. 2007, ApJ, 660, 1186 Martínez-Delgado, D., Romanowsky, A. J., Gabany, R. J., et al. 2012, ApJL, 748, L24 McConnachie, A. W. 2012, AJ, 144, 4 Mieske, S., Hilker, M., Infante, L., & Mendes de Oliveira, C. 2007, A&A, 463, 503 Mihos, J. C., Durrell, P. R., Ferrarese, L., et al. 2015, ApJL, 809, 21 Misgeld, I., Mieske, S., & Hilker, M. 2008, A&A, 486, 697 Mucciarelli, A., Bellazzini, M., Ibata, R., et al. 2017, A&A, 605, A46 Müller, O., Jerjen, H., & Binggeli, B. 2017, A&A, 597, A7 Muñoz, R. P., Eigenthaler, P., Puzia, T. H., et al. 2015, ApJL, 813, L15 Ordenes-Briceño, Y., Eigenthaler, P., Taylor, M. A., Puzia, T. H., et al. 2018, ApJ, in press (arXiv:1805.00491) Ordenes-Briceño, Y., Taylor, M. A., Puzia, T. H., et al. 2016, MNRAS, 463, 1284 Pawlowski, M. S., Famaey, B., Jerjen, H., et al. 2014, MNRAS, 442, 2362 Pawlowski, M. S., Pflamm-Altenburg, J., & Kroupa, P. 2012, MNRAS, 423, 1109 Pedregosa, F., Varoquaux, G., Gramfort, A., et al. 2012, JMLR, 12, 2825 Peng, C. Y., Ho, L. C., Impey, C. D., & Rix, H.-W. 2002, AJ, 124, 266 Roediger, J. C., Ferrarese, L., Côté, P., et al. 2017, ApJ, 836, 120 Rong, Y., Guo, Q., Gao, L., et al. 2017, MNRAS, 470, 4231 Sandage, A., & Binggeli, B. 1984, AJ, 89, 919 Sato, M., Hamana, T., Takahashi, R., et al. 2009, ApJ, 701, 945 Sérsic, J. L. 1963, BAAA, 6, 41 Skrutskie, M. F., Cutri, R. M., Stiening, R., et al. 2006, AJ, 131, 1163 Stierwalt, S., Liss, S. E., Johnson, K. E., et al. 2017, NatAs, 1, 0025 Tegmark, M., Blanton, M. R., Strauss, M. A., et al. 2004, ApJ, 606, 702 Tegmark, M., Dodelson, S., Eisenstein, D. J., et al. 2002, ApJ, 571, 191 Tully, R. B., Libeskind, N. I., Karachentsev, I. D., et al. 2015, ApJL, 802, L25 Valdes, F., Gruendl, R. & DES Project 2014, adass XXIII, 485, 379 van der Burg, R. F. J., Hoekstra, H., Muzzin, A., et al. 2017, A&A, 607, A79 van der Burg, R. F. J., Muzzin, A., & Hoekstra, H. 2016, A&A, 590, A20 van Dokkum, P., Abraham, R., Brodie, J., et al. 2016, ApJL, 828, L6 van Dokkum, P. G., Abraham, R., Merritt, A., et al. 2015, ApJL, 798, L45 VanderPlas, J., Connolly, A. J., Ivezic, Z., & Gray, A. 2012, in Proc. Conf. Intelligent Data Understanding, 47 Venhola, A., Peletier, R., Laurikainen, E., et al. 2017, A&A, 608, A142 Wetzel, A. R., Deason, A. J., & Garrison-Kimmel, S. 2015, ApJ, 807, 49 Wheeler, C., Oñorbe, J., Bullock, J. S., et al. 2015, MNRAS, 453, 1305 Wittmann, C., Lisker, T., Ambachew Tilahun, L., et al. 2017, MNRAS, 470, 1512. ORCID iDs Yasna Ordenes-Briceño https://orcid.org/0000-0001-7966-7606 Paul Eigenthaler https://orcid.org/0000-0001-8654-0101 Matthew A. Taylor https://orcid.org/0000-0003-3009-4928 Thomas H. Puzia https://orcid.org/0000-0003-0350-7061 Karla Alamo-Martínez https://orcid.org/0000-0002-5897-7813 Karen X. Ribbeck https://orcid.org/0000-0002-3004-4317 Roberto P. Muñoz https://orcid.org/0000-0003-1743-0456 Hongxin Zhang https://orcid.org/0000-0003-1632-2541 Eva K. Grebel https://orcid.org/0000-0002-1891-3794 Simón Ángel https://orcid.org/0000-0002-5322-9189 Patrick Côté https://orcid.org/0000-0003-1184-8114 Laura Ferrarese https://orcid.org/0000-0002-8224-1128 Michael Hilker https://orcid.org/0000-0002-2363-5522 Ariane Lançon https://orcid.org/0000-0002-7214-8296 Steffen Mieske https://orcid.org/0000-0003-4197-4621 Bryan W. Miller https://orcid.org/0000-0002-5665-376X Yu Rong https://orcid.org/0000-0002-2204-6558 Ruben Sánchez-Janssen https://orcid.org/0000-0003-4945-0056 References Amorisco, N. C. 2018, MNRAS, 475, L116 Annibali, F., Nipoti, C., Ciotti, L., et al. 2016, ApJL, 826, L27 Astropy Collaboration, Robitaille, T. P., & Tollerud, E. J. 2013, A&A, 558, A33 Beasley, M. A., Romanowsky, A. J., Pota, V., et al. 2016, ApJL, 819, L20 Bellazzini, M., Ibata, R. A., Chapman, S. C., et al. 2008, AJ, 136, 1147 Bernardeau, F., Colombi, S., Gaztañaga, E., & Scoccimarro, R. 2002, PhR, 367, 1 Bertin, E. 2006, adass XV, 351, 112 Bertin, E. 2011, adass XX, 442, 435 Bertin, E., & Arnouts, S. 1996, A&AS, 117, 393 Bertin, E., Mellier, Y., Radovich, M., et al. 2002, in ASP Conf. Ser. 281, Astronomical Data Analysis Software and Systems XI, ed. D. A. Bohlender, D. Durand, & T. H. Handley (San Francisco, CA: ASP), 228 Binggeli, B., Sandage, A., & Tammann, G. A. 1985, AJ, 90, 1681 Blakeslee, J. P., Jordán, A., Mei, S., et al. 2009, ApJ, 694, 556 Bovill, M. S., Puzia, T. H., Ricotti, M., & Taylor, M. A. 2016, ApJ, 832, 88 Caon, N., Capaccioli, M., & D’Onofrio, M. 1993, MNRAS, 265, 1013 Caon, N., Capaccioli, M., & D’Onofrio, M. 1994, A&AS, 106, 199 Connolly, A. J., Scranton, R., Johnston, D., et al. 2002, ApJ, 579, 42 Conselice, C. J., Gallagher, J. S., III, & Wyse, R. F. G. 2003, AJ, 125, 66 Cooray, A., & Sheth, R. 2002, PhR, 372, 1 de Vaucouleurs, G., de Vaucouleurs, A., Corwin, H. G., Jr., et al. 1991, in Third Reference Catalogue of Bright Galaxies, Vol. I: Explanations and references. Vol. II: Data for galaxies between 0h and 12h. Volume III: Data for galaxies between 12h and 24h, ed. G. de Vaucouleurs et al. (New York: Springer), 2091 den Brok, M., Peletier, R. F., Valentijn, E. A., et al. 2011, MNRAS, 414, 3052. 8.
(9)
Figure


+2
Documento similar