Improving http adaptive streaming systems, the latency and content distribution questions
74
0
0
Texto completo
(2) 1. Reviewer: Name. 2. Reviewer:. Day of the defense:. Signature from head of PhD committee:. ii.
(3) Abstract. Put your abstract or summary here, if your university requires it..
(4) iv.
(5) To ....
(6) Acknowledgements. I would like to acknowledge the thousands of individuals who have coded for the LaTeX project for free. It is due to their efforts that we can generate professionally typeset PDFs now..
(7) Contents List of Figures. vii. List of Tables. ix. 1 Introduction. 1. 1.1. Motivation. . . . . . . . . . . . . . . . . . . . . . . . . . . . . . . . . . .. 1. 1.2. Hypothesis . . . . . . . . . . . . . . . . . . . . . . . . . . . . . . . . . .. 2. 1.3. Objectives . . . . . . . . . . . . . . . . . . . . . . . . . . . . . . . . . . .. 3. 1.4. Research methodology . . . . . . . . . . . . . . . . . . . . . . . . . . . .. 3. 1.4.1. Research strategy . . . . . . . . . . . . . . . . . . . . . . . . . . .. 3. 1.4.2. Data generation techniques . . . . . . . . . . . . . . . . . . . . .. 4. 1.4.3. Evaluation . . . . . . . . . . . . . . . . . . . . . . . . . . . . . .. 4. Research plan . . . . . . . . . . . . . . . . . . . . . . . . . . . . . . . . .. 4. 1.5. 2 State of the art 2.1. 7. State of the Art . . . . . . . . . . . . . . . . . . . . . . . . . . . . . . . .. 7. 2.1.1. HTTP streaming history . . . . . . . . . . . . . . . . . . . . . . .. 7. 2.1.2. HTTP adaptive streaming . . . . . . . . . . . . . . . . . . . . . .. 8. 2.1.3. MPEG-DASH . . . . . . . . . . . . . . . . . . . . . . . . . . . . .. 9. 2.1.3.1. MPEG-DASH main characteristics compared to different streaming technologies . . . . . . . . . . . . . . . .. 10. 2.1.4. New possibilities for MPEG-DASH, extensions etc... . . . . . . .. 11. 2.1.5. Future of MPEG-DASH . . . . . . . . . . . . . . . . . . . . . . .. 13. 2.1.6. Latency improvement in MPEG-DASH . . . . . . . . . . . . . .. 14. 2.1.7. CDN content distribution . . . . . . . . . . . . . . . . . . . . . .. 14. 2.1.8. More about CDN . . . . . . . . . . . . . . . . . . . . . . . . . . .. 15. iii.
(8) CONTENTS. 2.1.9. 2.2. Previous research work . . . . . . . . . . . . . . . . . . . . . . . .. 16. 2.1.9.1. HTTP/1.1 vs HTTP/1.0 . . . . . . . . . . . . . . . . .. 16. 2.1.9.2. Modifying MPEG-DASH manifest . . . . . . . . . . . .. 16. Summary . . . . . . . . . . . . . . . . . . . . . . . . . . . . . . . . . . .. 17. 2.2.1. Server side . . . . . . . . . . . . . . . . . . . . . . . . . . . . . .. 17. 2.2.2. Client side . . . . . . . . . . . . . . . . . . . . . . . . . . . . . . .. 17. 2.2.3. Quality measurement . . . . . . . . . . . . . . . . . . . . . . . .. 17. 2.2.4. Content distribution . . . . . . . . . . . . . . . . . . . . . . . . .. 18. 3 Evaluation 3.1. 3.2. 19. QoS . . . . . . . . . . . . . . . . . . . . . . . . . . . . . . . . . . . . . .. 20. 3.1.1. Data requirements . . . . . . . . . . . . . . . . . . . . . . . . . .. 21. 3.1.1.1. Technologies to be measured . . . . . . . . . . . . . . .. 21. 3.1.2. Data generation method . . . . . . . . . . . . . . . . . . . . . . .. 22. 3.1.3. Measuring proposed streaming system . . . . . . . . . . . . . . .. 22. 3.1.4. Measuring others streaming systems . . . . . . . . . . . . . . . .. 23. QoE measuring . . . . . . . . . . . . . . . . . . . . . . . . . . . . . . . .. 23. 3.2.1. Purpose . . . . . . . . . . . . . . . . . . . . . . . . . . . . . . . .. 24. 3.2.2. QoE as an objective data measure . . . . . . . . . . . . . . . . .. 24. 3.2.3. Objective approach to QoE measure . . . . . . . . . . . . . . . .. 25. 3.2.4. Questionnaire Design. . . . . . . . . . . . . . . . . . . . . . . . .. 26. 3.2.4.1. Data . . . . . . . . . . . . . . . . . . . . . . . . . . . .. 26. 3.2.4.2. Sampling frame . . . . . . . . . . . . . . . . . . . . . .. 27. 3.2.4.3. Sampling techniques . . . . . . . . . . . . . . . . . . . .. 27. 3.2.4.4. Convenience Sampling . . . . . . . . . . . . . . . . . . .. 28. 3.2.4.5. Snowball Sampling . . . . . . . . . . . . . . . . . . . . .. 28. 3.2.4.6. Response rate and non-responses . . . . . . . . . . . . .. 28. 3.2.4.7. Sample size . . . . . . . . . . . . . . . . . . . . . . . . .. 28. Infrastructure . . . . . . . . . . . . . . . . . . . . . . . . . . . . .. 29. 3.2.5.1. How to do it . . . . . . . . . . . . . . . . . . . . . . . .. 29. 3.2.5.2. Streaming technologies . . . . . . . . . . . . . . . . . .. 30. Questions . . . . . . . . . . . . . . . . . . . . . . . . . . . . . . .. 30. 3.2.6.1. 31. 3.2.5. 3.2.6. Quality . . . . . . . . . . . . . . . . . . . . . . . . . . .. iv.
(9) CONTENTS. 3.2.6.2. Buffer performance . . . . . . . . . . . . . . . . . . . .. 31. 3.2.6.3. System Performance . . . . . . . . . . . . . . . . . . . .. 31. 3.2.6.4. Scoring . . . . . . . . . . . . . . . . . . . . . . . . . . .. 32. 3.2.7. Quantitative data analysis . . . . . . . . . . . . . . . . . . . . . .. 32. 3.2.8. Quantitative conclusions . . . . . . . . . . . . . . . . . . . . . . .. 33. 3.3. Final evaluation . . . . . . . . . . . . . . . . . . . . . . . . . . . . . . . .. 33. 3.4. Implementing questionnaire . . . . . . . . . . . . . . . . . . . . . . . . .. 33. 3.4.1. Server Side . . . . . . . . . . . . . . . . . . . . . . . . . . . . . .. 33. 3.4.2. Client side . . . . . . . . . . . . . . . . . . . . . . . . . . . . . . .. 34. 3.4.3. Bandwidth control . . . . . . . . . . . . . . . . . . . . . . . . . .. 35. 3.4.3.1. Seed data . . . . . . . . . . . . . . . . . . . . . . . . . .. 35. Answers to the questionnaire . . . . . . . . . . . . . . . . . . . .. 36. 3.4.4.1. Grouping answers . . . . . . . . . . . . . . . . . . . . .. 37. 3.4.4.2. Scoring the answers . . . . . . . . . . . . . . . . . . . .. 38. 3.4.4.3. Getting calculation formula . . . . . . . . . . . . . . . .. 39. 3.4.4.4. Comparing results . . . . . . . . . . . . . . . . . . . . .. 40. 3.4.4.5. Minimum acceptable QoE. . . . . . . . . . . . . . . . .. 40. QoS metric definition . . . . . . . . . . . . . . . . . . . . . . . .. 41. 3.4.4. 3.4.5 4 Discussion. 43. 4.1. Obtained data. . . . . . . . . . . . . . . . . . . . . . . . . . . . . . . . .. 43. 4.2. Conclusions . . . . . . . . . . . . . . . . . . . . . . . . . . . . . . . . . .. 44. 4.3. Discussion . . . . . . . . . . . . . . . . . . . . . . . . . . . . . . . . . . .. 45. 4.3.1. Player dependency . . . . . . . . . . . . . . . . . . . . . . . . . .. 45. 4.3.2. Questionnaire planing . . . . . . . . . . . . . . . . . . . . . . . .. 45. 4.3.3. Number of answers . . . . . . . . . . . . . . . . . . . . . . . . . .. 46. 4.3.4. Answers scoring. . . . . . . . . . . . . . . . . . . . . . . . . . . .. 46. Contribution to knowledge . . . . . . . . . . . . . . . . . . . . . . . . . .. 46. 4.4.1. Minimum bandwidth settings . . . . . . . . . . . . . . . . . . . .. 46. 4.4.2. Answers weight . . . . . . . . . . . . . . . . . . . . . . . . . . . .. 47. Future work . . . . . . . . . . . . . . . . . . . . . . . . . . . . . . . . . .. 47. 4.4. 4.5. 5 Materials & methods. 49. v.
(10) CONTENTS. References. 51. vi.
(11) List of Figures 2.1. moov header scheme . . . . . . . . . . . . . . . . . . . . . . . . . . . . .. 8. 2.2. adaptive content scheme . . . . . . . . . . . . . . . . . . . . . . . . . . .. 9. 3.1. color bar video . . . . . . . . . . . . . . . . . . . . . . . . . . . . . . . .. 22. 3.2. survey architecture for proposed system . . . . . . . . . . . . . . . . . .. 23. 3.3. survey architecture for streaming . . . . . . . . . . . . . . . . . . . . . .. 23. vii.
(12) LIST OF FIGURES. viii.
(13) List of Tables 3.1. Bandwidth HLS / MPEG-DASH response . . . . . . . . . . . . . . . . .. 36. 3.2. Bandwidth to be evaluated . . . . . . . . . . . . . . . . . . . . . . . . .. 36. 3.3. Numerical value for continuity answers . . . . . . . . . . . . . . . . . . .. 39. 3.4. Numerical value for quality answers. . . . . . . . . . . . . . . . . . . . .. 39. 4.1. QoE values for 150Kbs . . . . . . . . . . . . . . . . . . . . . . . . . . . .. 43. 4.2. QoE values for 200Kbs . . . . . . . . . . . . . . . . . . . . . . . . . . . .. 43. 4.3. QoE values for 250Kbs . . . . . . . . . . . . . . . . . . . . . . . . . . . .. 44. 4.4. QoE values for 300Kbs . . . . . . . . . . . . . . . . . . . . . . . . . . . .. 44. ix.
(14) LIST OF TABLES. x.
(15) 1. Introduction 1.1. Motivation. According to Cisco Visual Networking Index (7) INTERNET video traffic will increase from 63% in 2014 to to 80% by 2019 of all INTERNET traffic. More specifically, one of the most popular technologies is streaming, that, according to Global INTERNET phenomena report (19) cited by Venturebeat’s (26) magazine, could be a 71% of INTERNET traffic in some moments of the day. This fact will make video streaming technologies one of the most important ones in the future INTERNET. Because of that, all agents on industry are trying to improve streaming technologies making them better in performance, cheaper and easier to be adopted to final users. On the upcoming days a technology defined as HTTP adaptive streaming has become very popular instead former technologies like RTSP 1 or UDP 2 streaming based technologies. HTTP adaptive streaming techniques consists on the encode of the multimedia content in different resolutions and bitrates and it’s sent via HTTP to final users. This way user’s player can choose the most appropriate streaming quality (bitrate and resolution) is to its environmental circumstances like connection bandwidth, latency, kind of device used to to play the content, and other network conditions. 1 2. Real Time Streaming Protocol User Datagram Protocol. 1.
(16) 1. INTRODUCTION. The main advantage of this solution is that, since it is based on HTTP, it makes much easier to deploy it and to be consumed by final user. That is because no kind of NAT address conversion or firewalling techniques are necessary like in other technologies (UDP RTSP ). Due to the aforementioned benefits, several industry agents and researchers have moved their attention to HTTP streaming based technologies. On the other side can be seen that this new technology has several handicaps that have not been optimized and need some research to work better. One of the main handicaps of these kind of technologies is the end to end latency produced on live streaming transmissions. This latency is intrinsic to this technology because of it’s basis, but exists some possibilities to improve that unwanted behavior. As commented before, HTTP adaptive streaming systems can be deployed in an easy way using some HTTP tools like CDN servers 1 . This can make deployment cheaper but it has of some problems in performance. There are opportunities to optimize the use of those kind of servers to improve their performance.. 1.2. Hypothesis. Due the research work made in chapter 2.1.9 and it’s results, an research topic centered in the improvement of the CDN performance has appeared. Our research work and hypothesis will run into that topic: A streaming server too busy or with a very narrow bandwidth will offer worse results in a HTTP adaptive streaming connection than the use of multiple balanced servers with the same content and narrow bandwidth. If we could build a system that could balance the streaming load between different servers it could take advantage of the added bandwidth of all servers to get better 1. Content Delivery Network HTTP://www.webopedia.com/TERM/C/CDN.html. 2.
(17) 1.3 Objectives. results in terms of QoS and QoE offering the best available experience for the user. Our hypothesis is that load times QoS obtained when using a balanced loaded servers should be lower than the load times obtained from an unique streaming server when low bandwidth is available in each one of them. That would mean to better results in terms of QoE perceived by users.. 1.3. Objectives. Main objectives for this research work will be the demonstration of hypothesis defined on 1.2. Secondary objective, that will be a requisite to get the first objective will be the design and implementation of an balanced streaming server based on several streaming servers with different bandwidths. In summary, these objectives will be oriented to improve two main factors that are measured in streaming solutions:. • QoS Quality of Service (a objective measure) • QoE Quality of Experience (a subjective measure from the point of view of the user). 1.4. Research methodology. 1.4.1. Research strategy. Given the objectives mentioned in section 1.3, the most appropriated research tools and strategies according to Oates book (30) to carry out this research seem to be: • Design and creation • Tests to check the differences of the QoS of the existing solutions by measuring latency, consumed bandwidth and many other parameters.. 3.
(18) 1. INTRODUCTION. • Questionnaires to ask the users about their perception of QoE that they have about the existing solutions and the proposed by this research work.. 1.4.2. Data generation techniques. As said in section 1.4.1 there will be some tests to probe the validity of the hypothesis of this research work. Those tests will the main data generation sources to obtain quantitative data that could measured and compared. There will be some tests that will generate data form our proposed architecture and from previous used architecture. This way quantitative data can be compared to obtain a result about which one of the selected architectures will offer better performance in terms of QoS. On the other side QoE will be evaluated using questionnaires, those questionnaires will be oriented to get a punctuation about the QoE perceived by the user, so more quantitative data will be obtained in this part of the research work.. 1.4.3. Evaluation. As said before we are supposed to obtain quantitative data, so the comparison between obtained data will get us a way to evaluate the performance from our proposed architecture.. 1.5. Research plan. To achieve all objectives proposed in section 1.3 a research plan has been designed based in the following items: • An intensive State of the art study during almost all research duration • Design tests, surveys and questionnaires – CDN’s performance surveys design – QoE survey and questionnaires design. 4.
(19) 1.5 Research plan. • Measuring existing technologies – CDN’s performance surveys execution on existing platforms – Obtained data analysis – Conclusions – QoE survey to users • MPEG-DASH Server design and implementation • CDN Server prototype design and implementation • CDN’s improved performance experiments execution • Final data analysis and conclusions • Writing thesis and presentation In the Gantt diagram attached document can be seen which will be the temporal execution of the proposed items. The estimated duration of this research work is about 33 months. But for this current subject, the research work will only take into account the first steps of the research proposed plan. Only research planning about State of the art and experiments and surveys design will be taken as subject of study. There are some task that can run in parallel to other task, for example, the State of the art study will take almost all research duration but there will be a main study in the first three months to situate the research and the rest of the time, this task will be limited to a vigilance role to check if there are new researches about this kind of technology. Other task that can run in parallel are the surveys, those surveys are sent to the final users and can run in a parallel way because they wont need a full time research implication, only to be available to answer users questions and save answered surveys. This Research plan will accomplish with all Research objectives mentioned on section 1.3 and it’s organization will help to complete in a right way this research work.. 5.
(20) State of the Art. Writing presentation. Corrections. Writing thesis. Writing thesis and presentation. Data analysis and conclusions. Final data analysis and conclusions. CDN’s improved performance experiments execution. CDN’s improved server implementation. CDN’s performance optimization server design. CDN Server. QoE survey for prototype. Data analysis from experiments. QoE survey for current technologies. QoE survey design. CDN’s performance conclusions. CDN’s performance experiments execution on existing platforms. CDN’s performance experiments design. Measuring existing technologies. Design experiments and surveys. 1. 2. 3. 4. 5. 6. 7. 8. 9. 10. 11. 12. 13. 14. 15. 16. 17. 18. 19. 20. 21. 22. 23. 24. 25. 26. 27. 28. 29. 30. 31. 32. 33.
(21) 2. State of the art 2.1. State of the Art. In this section an initial study of the current State of the Art of this research field can be seen. It will help to situate the current knowledge in this research field.. 2.1.1. HTTP streaming history. In the beginning was HTTP progressive download. This was the very first streaming technology based on HTTP. It consisted on downloading in a progressive way the file that is going to be played from server to client. This file must complain a special characteristic, it must have its codec headers at the beginning of the file, by letting the client downloading it at the beginning of streaming.This will able the client to know the codec content that will be played and this way it could start playing this content without the need to have downloaded the complete file. On contrary side, if the header of codec is present at the end of the file, the player will have to wait to download all content until starting playing it. HTTP progressive download is usually based on mp4 files. Mp4 files complain the requisites of content header at the beginning of the file since they can have it’s moov header at the beginning of the file. This moov header contains the data content information about bitrate, resolution and codec of the media contained on the file (see figure 2.1). In (10), researchers show that HTTP progressive download. when no low-latency is required offers very good. results. This fact, joined together to the simplicity and cheapness of streaming server. 7.
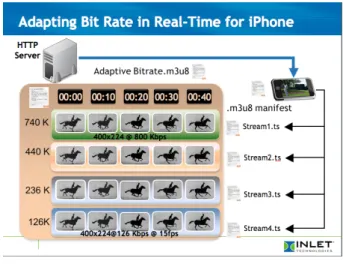
(22) 2. STATE OF THE ART. makes that technology very attractive. This type of streaming let to do seeking on the played file without downloading it completely and is very easy to implement, but lacks of adaptive streaming capabilities, once the client has selected a file to play, it is very difficult to switch to other file with higher or lower quality when network condition requires it. Other factor for adopting HTTP streaming technologies is the fact that now, the client is the element that holds the bigger weight on intelligence and negotiation capabilities, freeing the server of that work. This way the process of selecting the most appropriate streaming quality is much easier and fully relies on client network condition and capabilities.. Figure 2.1: moov header scheme. Nowadays video streaming is consumed in so much different ways, at home in a PC or in a smart TV, in mobility with a smartphone or a tablet. Video streaming technologies must adapt the content to consumers device and network capabilities at the moment of the streaming. This need has made that some industry companies had created the concept of HTTP adaptive streaming to accomplish those needs.. 2.1.2. HTTP adaptive streaming. In HTTP adaptive streaming the server divides multimedia content in segments of given duration and codifies them into different qualities and resolutions. This way the player. 8.
(23) 2.1 State of the Art. can select which segment can be played depending on the resolution and available bandwidth at the moment. This architecture (Fig 2.2) let the player to switch to lower or higher quality streaming during playing depending on network condition changes.. Figure 2.2: adaptive content scheme. First, and most popular, aproximations to HTTP adaptive streaming were made several years ago by Microsoft creating Smooth streaming server, Netflix player , Adobe OSMF Player and Apple with its HLS streaming server. In (2) researchers have compared the behavior of some of those HTTP adaptive streaming technologies by modifying network conditions and observing what was happening to the streaming. This way they study the way the players are able to manage network issues and how those network issues affect to the QoE (quality of experience) perceived by the user. At the same time they suggest a new algorithm to select which content quality should be requested by player at the time that there is a network condition change. This new algorithm will have mooth transitions in network conditions changes and will be more robust to sudden network conditions changed making the QoE much better for the final user.. 2.1.3. MPEG-DASH. The evolution of those types of HTTP adaptive streaming technologies has come from the hand of MPEG group (17) and 3GPP group (15). They have taken all of those previous approximations and have made it’s own approximation to HTTP adaptive. 9.
(24) 2. STATE OF THE ART. streaming architecture, MPEG-DASH (16).This architecture is an open standard and can be adopted by anyone. This way there could be multiple implementations of the architecture from multiple companies of any element of the architecture. For example, a company could make a MPEG-DASH server application and other one could implement it’s own version of the MPEG-DASH player and both should be compatible to each other. This architecture is being adopted nowadays as a standard for almost major industry agents in streaming technologies and is studied by researchers to improve its performance.. 2.1.3.1. MPEG-DASH main characteristics compared to different streaming technologies. One of the main factors to measure the quality of a streaming technology is the QoE perceived by final user, Singh et al. (40) have designed a new algorithm to measure QoE in the combined case of adaptive bitrate video and the use of a reliable transport protocol, which is the case of HTTP adaptive streaming. The algorithm could be very useful to measure QoE in different implementations or improvements of MPEG-DASH. In (32), we can see the most advantages of MPEG-DASH architectures against older implementations of HTTP adaptive streaming technologies and HTTP progressive download architecture. This paper shows in terms of QoE the results of that comparison, there can be confirmed that MPEG-DASH offers better results than previous technologies. All logic and intelligence of MPEG-DASH architecture is based on client side. The big challenge on the client side is the selection of the best adaptation set to be played depending on the current network conditions and device capabilities. To achieve this goal client can follow different strategies Research made in (23) uses the expected delivery time of the content consumed from different servers to create a new metric to define how to keep QoS (quality of service) on the client side. To achieve the best results for this metric, they have implemented a new algorithm for selecting the quality of the content consumed by player. Then, they. 10.
(25) 2.1 State of the Art. study their results based on the quality of the content consumed by the client player. As described by Thang et al. in (43), the selection of connection throughput to estimate the adaptation set that have to be downloaded could bring some problems to get smooth transitions between quality changes in the segments. To solve that potential problems, in (43) researcher propose is using the flexibility of MPEG-DASH MPD to indicate to the player a quality range in a way that the player can select which adaptation set is the most appropriate for the quality required by the network conditions on the client side. This implementation of new characteristics to MPEG-DASH is very useful to get smoother and better streaming quality, but breaks it’s compatibility with other implementations of the standard.. 2.1.4. New possibilities for MPEG-DASH, extensions etc.... MPEG-DASH is a mature architecture in a lot of ways and some researchers want to improve it in several ways that weren’t kept in mind in it’s definition; This section will show the improvements that have been proposed to MPEG-DASH in order to improve the content that is perceived by the user in terms of new content and QoE and QoS. Research work (42) shows how MPEG-DASH flexibility can be used to provide more quality content through different heterogeneous network in a synchronized way. This can improve the content received by final user. One of the possible applications of this technique could be adding HDR capabilities to MPEG-DASH architecture in a way that the players that ”understand” this implementation could have this capability through other networks (internet + broadcast) and clients that don’t understand this implementation could read NON-HDR streaming quality from broadcast streaming. This implementation could be used too to improve the quality of the streaming by consuming higher bitrate (combined from various sources) by the client. In a general way all MPEG-DASH try to consume the highest quality content in terms of bitrate and resolution that current network bandwidth permits. In (36) Reznik. 11.
(26) 2. STATE OF THE ART. presents a different approach to get the best QoE. The proposal is oriented to mobile devices, using its sensors, extra information of environment parameters could be given to the MPEG-DASH client. This way the client could select a more appropriate quality content depending on those environment variables and not only based on available bandwidth. This sounds a good idea but the lacking of any implementation or measure of this solution doesn’t give us any ideas about the grade of improving of this solution. In (8) researchers make an experimental study to improve the quality of the content consumed by client player by creating a P2P heterogeneous network. This paper proposes that some mobile clients (smartphones) that consume content from 3G mobile network can use WIFI connections between them to create a P2P network. The study concludes that this kind of P2P networks improve the results of quality consumed similar to the quality given by the addition of all 3G networks.This approximation means a better quality of streaming on client side, but the conditions to get this better results are very restrictive, clients must be very near one to each other to share a WIFI connection to get this results, this solution doesn’t have any value to clients that are not in the same location. Other ways to improve the QoS of MPEG-DASH is to provide more servers where content can be downloaded. In (44), authors present a propose to use multiple servers to get the content by downloading in a simultaneous way the content from different servers. In a similar way, (31) use different networks where the client device is connected to detect which one of them will offer the better performance in terms of bandwidth and network quality to get the content from the best available network. Another similar strategy is used in (33), where researchers propose Openflow (12) to manage the load over SDN. 1. in order to select which network will offer the best. results in terms of latency and bandwidth.. 1. Software Defined Networks. 12.
(27) 2.1 State of the Art. In (51) researchers propose a strategy based on server and client to get better performance in receiving streaming content. Their propose is a feedback receiver that in client side “asks” the server to generate different duration segments depending on the available buffer in the client.. 2.1.5. Future of MPEG-DASH. Nowadays there are a lot of technologies that have some influence in the performance and behavior of MPEG-DASH, some of those technologies are expected to change or to evolve. This section will cover the research made over MPEG-DASH and how those changes will affect to its performance. HTTP/2.0 is the expected evolution of current HTTP/1.0-1.1 protocol, some INTERNET service providers have are using it in experimental way and it is expected to be adopted in the future for almost INTERNET service providers. (27) research shows that there is some overhead in the communications, that drives to a higher bandwidth consumption with the same quality. On the other side HTTP/2.0 adds some elements that fill the lacks of HTTP/1.0-1.1 obtaining a better performance on received streaming. Those results have been obtained by disabling the security layer of HTTP/2.0, that is a problem because that security layer is mandatory in HTTP/2.0. Although MPEG-DASH is a codec-agnostic architecture, that means that no audio or video codec is specified for the architecture, the de-facto standard for video and audio codec are h264 and aac respectively. That means that most implementations of MPEG-DASH are based on those video and audio codecs. Nowadays those codecs are used widely in most of video and audio content. MPEG is the organization that has defined those codecs and in the case of video codec, it has created a new version evolved from h264, that codec is called h265. In (20) researchers have made a study about the implementation of an MPEG-DASH server based on h265 codec and how network conditions and variations of bitrates and different profiles of h265 influences in the QoE of the streaming.. 13.
(28) 2. STATE OF THE ART. 2.1.6. Latency improvement in MPEG-DASH. The main problem on MPEG-DASH has to be with the technologies on which it is based. The fact that it is based on HTTP protocol makes by design bigger latency than technologies that are based in other technologies like for example UDP based technologies. Bouzakaria et al. have worked in the improvement of the latency in two aspects of it. In (6) have improved the bootstrap latency. 1. by applying some techniques: make. connections using HTTP/1.1 or HTTP/2.0 protocols instead HTTP/1.0. As we saw on section 2.1.5 using those kind of protocols can reduce headers in TCP connection, so it will reduce the average data to load reducing the latency of the connection. Other technique that researchers consider to use is encoding the MPD file on base64, that will reduce the load time too. Their last try to reduce latency consists on adding extra tags to MPD file containing the ISOBMFF headers, this way the client doesn’t need to download the file segment that contains those headers, reducing this way the load and the latency oh the connection. Using the same technique, in (5) they have reduced the by using HTTP/1.1 connection on server and client side. This way client and server can use HTTP chunk download property, letting the client to download segment chunks even the segment has not been complete deployed on server side. Shuai et al. (39) research work improves latency on MPEG-DASH by designing a minimal buffer on the client side and synchronizing data generation and data consumption to avoid excess data on server side.. 2.1.7. CDN content distribution. There are some research works about CDN distribution content that tries to improve the performance of CDN servers. According to (24), main problems in CDN delivery content consists in choosing which content should be put on each CDN server, because all content cannot be dis1. The latency that is produced in the loading of MPD file and ISOBMFF (47) segment headers. 14.
(29) 2.1 State of the Art. tributed in an equal way to all CDN servers because problems of cost and performance. In (24) researchers define some new strategies to deliver content through CDN and servers that depending on the kind of content (live streaming, VoD, etc . . . ) offers better results than classic delivery strategies.. In (37), researchers propose a Big data technology to design an algorithm to learn from previous deployments and customers streaming consumption, which content should be delivered in a priority way to determined CDN servers. They predict what cache servers will need some backup support and deploy more if necessary.. Those research works show that some work has been done in the field of reducing the latency on the server side, but not so much work has been done in the field of content distribution using CDN servers.. 2.1.8. More about CDN. In (34) research work researchers have created an algorithm that used TCP multiple connections to download the same MPEG-DASH segment from different CDN servers and probed that that way offered a much better bandwidth use than using a single TCP request.. Jiang et al. made a research about balancing CDN request using an algorithm that combined cookies, CDN dynamic feedback load balancing algorithm. They compared their algorithm results versus other different algorithms and probed that their algorithm offered better performance. In (35) researchers use new tools like SDN 1 to deploy virtual CDN networks that can be deployed and managed in an easy way. Using that technology Rego et al. have proposed a Load balance algorithm that deploys and removes streaming servers depending on the demand and elasticity policies.. 1. Software defined networks. 15.
(30) 2. STATE OF THE ART. In (41) Sinha et al. have faced the problem of selecting the optimal node from an CDN network and probed some different strategies to get the best results possible. In (28) authors refer to a new way to improve CDN’s by offering users bandwidth to create a high distributed CDN network with a *load balance* algorithm to manage all available CDN’s by surrogating connections to the *home users CDn’s* if available bandwidth exists and have shown that its performance is good enough to be compared with commercial CDN types in terms of speed. In (14) researchers look for a good way to selecting the optimal way in terms of network speed when downloading multimedia content from different CDN servers. In (22) Kyryk et al. put their eyes on the delay time, server load an probability of packet loss to create a system to measure QoS and describe a load balancing mechanism to get the lowest values and consequently the best QoS in the terms mentioned.. 2.1.9. Previous research work. In previous research work I have made, I studied different ways to reduce the latency perceived by the user in MPEG-DASH streaming in a effort to improve the QoS in live streaming situations. Two different technical approaches have been done in previous research work. 2.1.9.1. HTTP/1.1 vs HTTP/1.0. In this research work the use of web servers based on different version of the HTTP protocol will will offer different latencies for the same content. Results obtained shown that HTTP/1.1 web based servers offered lower latency than HTTP/1.0 based web servers. 2.1.9.2. Modifying MPEG-DASH manifest. Other option studied was based in the modification of the profile on-demand from MPEG-DASH in order to improve the load time in live content consumption.. 16.
(31) 2.2 Summary. That modification made an improvement of latency perceived by the user and consequently a better QoS of the service.. 2.2. Summary. In this state of the art about HTTP adaptive streaming are several parts very well differentiated parts mainly focused into MPEG-DASH architecture:. 2.2.1. Server side. In the server side, there are several research works that are pushing the limits of the TCP and HTTP protocols trying to decrease MPEG-DASH latency to obtain better QoS. Main leaders for this research lines are a group from ParisTech University.. 2.2.2. Client side. On the client side there is a research effort to offer better algorithms to get the best QoS and QoE for HTTP adaptive streaming depending on the network environment conditions. It doesn’t seems to be a common direction of those research work to achieve this objective. A closer look into those papers and trying to review more recent work from authors could help to more knowledge about this research field.. 2.2.3. Quality measurement. Measuring QoS and QoE is a research topic very common in this state of the art, in a general way for any kind of multimedia content or in a particular way focusing into MPEG-DASH. I find this research topic very interesting, especially focusing in the effort to get a relationship between QoE, an subjective measure, and QoS, an objective measure. This relationship is very important because it will give to the content distributors a direct way to measure QoE of their content without the need of a direct answer from their. 17.
(32) 2. STATE OF THE ART. customers, just reading QoS metrics that can be done in an automatic and transparent way for customers will lead to a valid QoE metric.. 2.2.4. Content distribution. Content distribution seems to be the less studied research topic into this state of the art, but a lot of research works mentioned in this document are pointing in the same direction to get results for better content delivery. They are focused into using big data to learn from old data and take actions and systems like OpenFlow to execute those actions and deploy, scale and remove new content distribution servers in order to meet the needs for content delivery in certain moments. Based on all learned from this State of the art, the most hopeful research topics both in terms of more research work to be done and future impact are: • Relationship between QoS and QoE • Content distribution Content distribution will be very important because of CDN servers, both virtual ones or real ones and the logic to deploy content on them and their savings for the content providers in terms of bandwidth an storage space. These technology presumably will offer too better QoE for customers into the aspect of getting content much earlier if they are deployed into a nearly server. As evaluated before, a relationship between QoS and QoE will offer a good way to get QoE measures from QoS measures made by content providers getting a better experience for the customer.. 18.
(33) 3. Evaluation In this chapter the evaluation of the proposed architecture will be discussed. Main objectives referred on chapter 1.3 of this research work will be the improvement of the QoS and QoE of an streaming session using an improvement for MPEG-DASH architecture. First step to determine the improvement of any factor is measuring it, because of that measuring QoS and QoE of received streamings will be the first task to be executed. To measure those two aspects of an streaming communication will be necessary to know what they mean:. • QoS: is the description or measurement of the overall performance of a service ((49)) • QoE: is a measure of the delight or annoyance of a customer’s experiences with a service ((48)) To evaluate those measures it will be necessary to determine which kind of measures are.. 19.
(34) 3. EVALUATION. On one side QoS can be defined in terms of an objective measure, like used bandwidth, resolution of the played streaming, bitrate of the streaming, etc.... On the other side, by definition, QoE has been defined for a long time as a subjective aspect perceived and determined by the user who consumes the content, in our case, the streaming.. Given those differences, the way to measure those factors must be different for each one of them.. 3.1. QoS. QoS has always been measured as a combination of several objective factors of the played streaming. That makes easy to develop tests to measure those factors and to create a good QoS equivalent for multiple systems that have to be compared.. In the state of the art, section 2.1.3.1, we couldn’t find a suitable way to measure QoS of the candidates we are going to use to compare against our proposed system architecture for streaming, so a new one must be defined to have a common measure to compare between different available architectures and streaming systems.. We will define the description of an streaming on its “physical” characteristics measured at client side:. • Resolution • Bitrate • Latency • Buffer size. 20.
(35) 3.1 QoS. 3.1.1. Data requirements. First step will be determining which factors are representative for us to measure the QoS. • Streaming resolution • Streaming bitrate • Streaming latency • Streaming Buffer size • Resolution changes • Bitrate changes • Buffer size changes Those factors are a combination of streaming metrics that can be measured in an objective way. That makes that, according to to Oates ((30)) book, using surveys should to be the best approach to measure those metrics.. 3.1.1.1. Technologies to be measured. But there is still a question that has not been answered, what is going to be compare? In several parts from this document has been told that purpose was comparing the performance of different HTTP adaptive streaming technologies by comparing its QoS and QoE measures. The streaming technologies that are going to be compared are: • Apple HLS streaming (4) • MPEG-DASH (16) • MPEG-DASH improved architecture (our research work) Those streaming technologies are the most representative ones in terms of HTTP adaptive streaming technologies according to (25) .. 21.
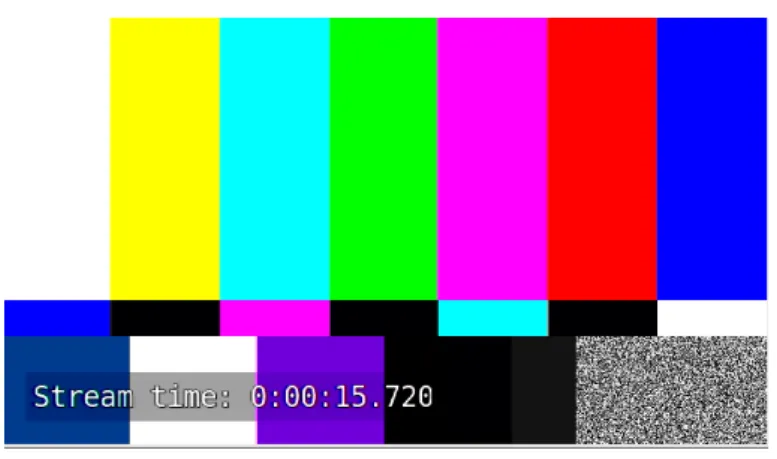
(36) 3. EVALUATION. 3.1.2. Data generation method. Wowza Streaming Server (50) will be used to implement and deploy all available streaming platforms except this research work one.. Our MPEG-DASH based streaming technology will be deployed manually with its own streaming server.. The objective of this kind of surveys is to measure the behavior of all streaming servers in the same conditions, so the same content must be streamed by all of them and in the same network conditions. So the system will be deployed in a controlled local network and the content will be a color bars video with its timestamp attached to the image.. Figure 3.1: color bar video. 3.1.3. Measuring proposed streaming system. A HTML5 player based on dash.sj (11) will be used to reproduce streaming from proposed streaming system. To measure metrics given in 3.1.1 will be necessary to modify this player.. 22.
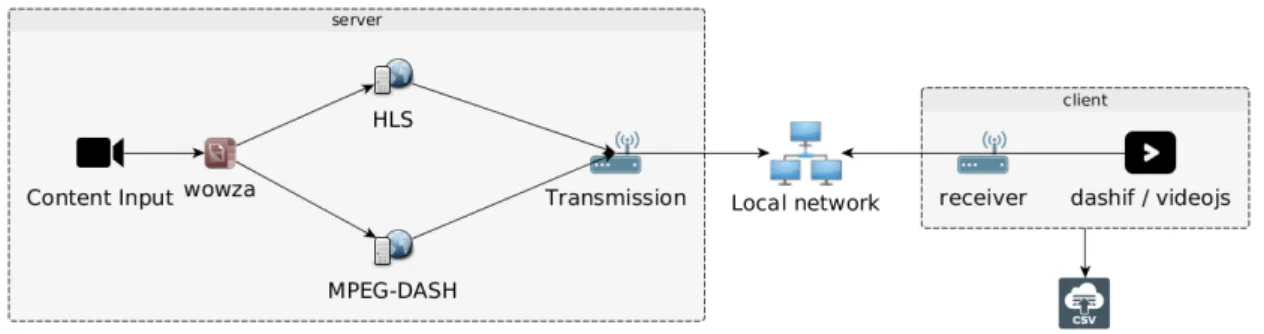
(37) 3.2 QoE measuring. Figure 3.2: survey architecture for proposed system. 3.1.4. Measuring others streaming systems. Best way to measure metrics given in 3.1.1 will be similar as previous one, we have three different types of streaming, two MPEG-DASH based and one HLS based, we will use dashif player based to measure the MPEG-DASH based streaming and videojs (46) for the HLS based streaming.. Figure 3.3: survey architecture for streaming. 3.2. QoE measuring. According to Zhao et al., QoE is being taken into account as the best factor to measure the quality of a video streaming. Keeping in mind that final objective of an Internet video streaming is the transmission and the consumption of the data in the best way for the customers, that premise is very accurate and must be an important metric in any. 23.
(38) 3. EVALUATION. research work that wants to know how good is a streaming system, that fits completely into our research work. QoE has been defined as a measure of the delight or annoyance of a customer’s experiences with a service and eventually the only way to get this measure was questioning directly to the customer how was it’s experience consuming a streaming.. 3.2.1. Purpose. It is known that a questionnaire will only give a subjective perspective of the QoE perceived by the users. It wont be the only one tool that we will use to measure the QoE but it will give us a valid view of it. Making an objective measure of the QoS of the streaming at the same time than consumer consumes the streamed content we could find a relation between those two factors. • Which is the best streaming platform of the proposed in terms of QoE • Is our streaming solution good enough in terms of QoE. 3.2.2. QoE as an objective data measure. There is a trend followed by some researches that try to link QoS objective measures to QoE measures perceived by consumer. In (38), Shen et al. have developed a method to measure QoE on an objective way that seems very promising in terms of easing the access for broadcasters and service providers to the lecture of QoE perceived by users. This research method seems to be to powerful but so much for our research purposes where a questionnaire seems to be more adequate. Nam et al. in (29) have measured some streaming factors and related those measures directly with the perceived QoE from final users, mainly the rebuffering one.. 24.
(39) 3.2 QoE measuring. That gives us the idea that QoE could be measured in an objective way, not only using questionnaires. The streaming factors measured were: • Start-up latency • Rebuffering • Bitrate changes • Video loaded fraction Those measured elements can be a good starting way to measure quality of streaming, specially the related ones with bitrate played by clients. With those streaming factor’s measures could be used to create a kind of QoS of the streaming to be related in future research work with QoE measures. In (9), Eckert et al. have developed four different algorithms to get an objective way to measure QoE and have compared their estimation results with real user experiences and their subjective experience while watching different contents and have shown that those kind of algorithms can predict in a good way the QoE perceived by users. Those algorithms have been developed taking account that the buffer size is directly related with the continuity and the stalling of the streaming. Those two characteristics are generally related with the QoE perceived by the users. Those research works agree with our point of view to measure at the same time some QoS aspects in order to link those results with QoE.. 3.2.3. Objective approach to QoE measure. Our approach to get a quantitative approach to QoE measure will be a mix from techniques used in previous section.. 25.
(40) 3. EVALUATION. We will extract quantitative data from questionnaire sent to users in order to extract their answers to get a measure of QoE. On the other hand, we will take logs from players used in order to get the quality and continuity of the played content. This way QoS measure from streaming could be established and a direct link between QoE and QoS from each session could be settled down.. 3.2.4. Questionnaire Design. This section will cover the design of the questionnaire to complete our main information goals. In a extended way we are going to define a survey, so we want to get the same kind of data from a large group of people in a standardized way.To achieve a good work in survey designing we will have to follow some directives:. • Data requirements • Sampling techniques • Sampling frame • Sample size • Response rate and non-responses 3.2.4.1. Data. According to Oates (30) in a survey two different types of data can be obtained: • Directly topic related • Indirectly topic related This questionnaire will get data only from topic related:. 26.
(41) 3.2 QoE measuring. We want to know which is user perception about the QoE of the streaming (directly topic related data).. 3.2.4.2. Sampling frame. In section 3.2.1 our objective will be to know which streaming technology or platform is the best one in terms of QoE. So this way we think that the best people to answer this question will be the professionals of this field. We are going to consider a population of our research and developer colleagues focused on streaming technologies.. 3.2.4.3. Sampling techniques. We have defined our sampling frame, so its time to define the sampling techniques to get that sampling frame. There are two kinds of samplings: • probabilistic • non-probabilistic In our case the sampling technique will be a non-probabilistic one; We are going to ask our colleagues and people we know, they fit the condition of being people related to research and development of related streaming IT but they wont be a representative frame of all population. To get this data we will use a mix of the following non-probabilistic sampling techniques: • Convenience Sampling • Snowball Sampling. 27.
(42) 3. EVALUATION. 3.2.4.4. Convenience Sampling. This technique consists on asking people that will be convenient for this research. By definition, asking working colleagues that have interest and knowledge in this research field fits this type of technique.. 3.2.4.5. Snowball Sampling. This technique consists on asking a person who has made the questionnaire to ask other person to answer the questionnaire. We will ask our colleagues to ask another people to answer this questionnaire to get the biggest sample size possible.. 3.2.4.6. Response rate and non-responses. According to Oates (30) a 10% rate of response is not uncommon. We are focusing on a sample-size of about 100 people, we will ask to 70 research colleagues (convenience sampling) and we hope at least another 30 people obtained from our Snowball sampling techniques. To avoid lower response rates we will ensure to let know to the people we are asking the importance of this research work in order to determine the best streaming technology in terms of QoE. This, united to the fact that the people we are asking are interested on these kind of technologies can assure us at least 40/50 answers.. 3.2.4.7. Sample size. The bad news about this kind of Sampling techniques is that the final sample size of answers that could be obtained shouldn’t be significant to ensure a 95% of confidence and an 3% of accuracy on our answers.. 28.
(43) 3.2 QoE measuring. According to Oates (30) to obtain a 3% certainty and for a total population of 900000 people this questionnaire should be answered for at least 895 people but that is far away from our capabilities. Our previsions for this questionnaire is that we will get a final sample size of 40/50 answers, what is statistically significant data but can’t ensure the error percentages because our target is all world population (we want to be sure that our system is better (or not) than other ones). 3.2.5. Infrastructure. To build this questionnaire will be necessary some infrastructure. Main objective will be to compare different streaming platforms and architecture, so it will be necessary to deploy that infrastructure and make it available to use to the people who answers this questionnaire. The necessary items to carry out this task will be: • Streaming servers for all available platforms • Same content for each platform (content and quality) • Clients for all available platforms • Instructions to users about how to deploy/install clients when necessary 3.2.5.1. How to do it. The best way to perform this survey will be using Internet, our sample population will be people that are common and comfortable with IT technologies and answering by Internet won’t be a problem for them. Another advantage of making questionnaires on the Internet is that it will be cheaper than other methods and asynchronous for those who respond the questionnaire.. 29.
(44) 3. EVALUATION. We are going to use Google forms (13) as platform to create our on-line questionnaire. But it won’t be enough to complete all elements of our infrastructure mentioned on 3.2.5. We will need some other tools to deploy all available streaming technologies. To deploy all streaming platforms and technologies we will opt to deploy them on Amazon web services (3).. 3.2.5.2. Streaming technologies. The streaming technologies we want to compare on terms of QoE will be: • Apple HLS streaming (4) • MPEG-DASH (16) • MPEG-DASH improved architecture (our research work) As mentioned on 3.2.5, the best way to deploy those streaming technologies will be using Amazon web service (3) in combination with Wowza Streaming Server (50) mentioned in section 3.1.2 to get QoS measures.. 3.2.6. Questions. Same questions will be asked for all streaming services to all users in order to compare their answers and answer our main question: which streaming server is the best one in terms of QoE ?. Final purpose will be linking QoS with OoE, so basing in the metrics from section we are going to build a questionnaire that involves QoS available metrics to relation them with QoE.. 30.
(45) 3.2 QoE measuring. Question will be divided by themes, each group of questions will be used to answer some high level related questions. These question group will be directly related to the subject of the survey, we will use these questions to ask about the QoE perceived from each streaming server.. 3.2.6.1. Quality. Those questions will give a measure about the quality perceived by the user.. • Has this streaming good resolution? • Have you noticed any pixelated images in any moment? 3.2.6.2. Buffer performance. Those questions will give an idea of buffer performance of each streaming platform.. • Have you noticed any cuts during playing? • Have you noticed any discontinuity? • Have you noticed any yerk during video playback? 3.2.6.3. System Performance. Those questions will offer an idea about the load and the general performance of the player on the user side.. • Was your computer slow when playing streaming? • Did you notice any abrupt transition between resolution changes? • if yes, when? – up− >down? – down− >up?. 31.
(46) 3. EVALUATION. 3.2.6.4. Scoring. As said in section 3.2.3, there is a need to get quantitative data from this questionnaires answers, so “numeric” answers must be given. To achieve this goal, best way would be scoring answers as follows:. 1. Very bad 2. Bad 3. Normal 4. Good 5. Very good. 3.2.7. Quantitative data analysis. All results obtained from these surveys, experiments and questionnaires will generate quantitative data and those data must be analyzed in order to obtain some adequate conclusions. According to (30, Chapter 17) there are different types of quantitative data: • Nominal data − > categories without numerical value • Ordinal data − > numbers are allocated to a quantitative scale • Interval data − > ordinal data measured against quantitative scale • Ratio data − > interval data with zero value in the measurement scale We will get two types measures, nominal data from questionnaires that will be coded in order to get quantitative data from their results and ordinal data from surveys from QoS.. 32.
(47) 3.3 Final evaluation. 3.2.8. Quantitative conclusions. Best way to get conclusions about questionnaires will be the elaboration of a mean of answers from questionnaires. This will give quantitative data that can be compared between the different available platforms.. 3.3. Final evaluation. According with the previous papers mentioned on 3.1 and 3.2 sections, there is a trend from researchers to consider QoE a much better way to measure the quality of a video streaming instead of QoS. That is because the need to focus streaming measures fully into client’s experience. Video streaming must also pay attention too service providers interests. Service providers want to get the best results by the less money possible. That means that they want the best QoE possible on the client side with the less QoS possible. This way they will decrease their expenses in bandwidth and equipment but getting a good QoE into client side. Research work will have to mix those two factors in order to get a response for a simple question, will our proposed system architecture will offer the best QoE possible for the “worst” QoS in a better way than other available systems from market?. 3.4. Implementing questionnaire. This section will cover the implementation of questionnaire defined in section 3.2.4. The execution of this survey can be divided in two different parts, server side and client side.. 3.4.1. Server Side. As mentioned in section 3.1.2, we have used a Wowza streaming server to implement the required adaptive streaming systems.. 33.
(48) 3. EVALUATION. First step will be the generation of the necessary video sources to build the adaptive streaming servers that are going to be studied. For these purposes a series of videos based on color bar video as told in Figure 3.1 with the following resolutions have been created using gstreamer (18) framework.. • 4K (3840x2160) • FullHD (1920x1080) • HD (1280x720) • 480p (854x480) • 240p (320x240) Using those generated videos we have set up two different streaming servers using Wowza streaming server, those streaming are based on MPEG-DASH and HLS. This way two different HTTP adaptive streaming services have been created to be evaluated by the users who will answer to our questionnaire.. 3.4.2. Client side. In the client side, web player has been selected in order avoid any operative system dependency. This way streaming can be played in any modern and current web browser. In order to run proposed web players for each streaming platforms, the most appropriate Javascript libraries must be chosen. Based in the fact that there are two different streaming platforms, two different Javascript libraries must be chosen to be used as base for web players. In section 3.1.4 was mentioned that we were going to use:. • dashjs for MPEG-DASH streaming • videojs for HLS streaming. 34.
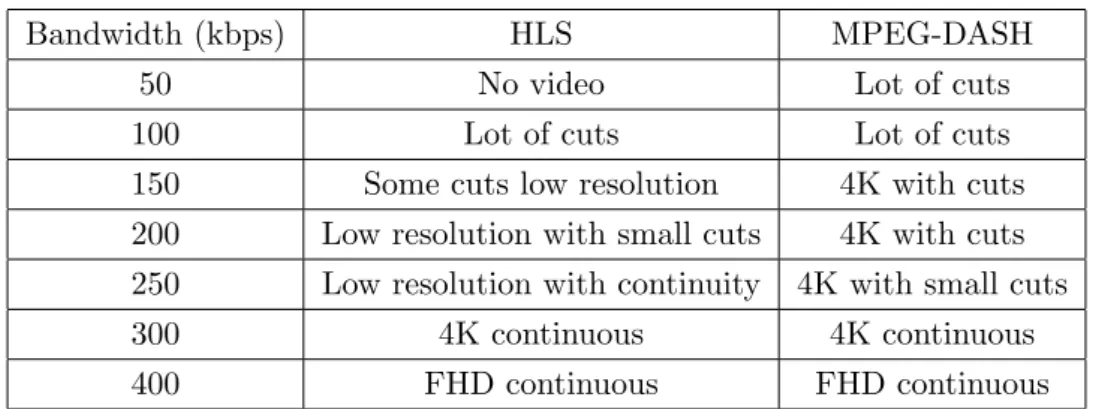
(49) 3.4 Implementing questionnaire. But after doing some testing with those libraries, different Javascript library was chosen for playing HLS streaming content. That was because videojs library wasn’t fully compatible with Wowza streaming server HLS service provided. Library finally chosen for HLS streaming was videodev (45).. 3.4.3. Bandwidth control. Some previous testing showed that mean Internet speed mentioned by Akamai report (1), that is 12Mbps, will be always enough bandwidth to play 4K resolution streaming content in both streaming platforms studied. Because of that, we decided to do our tests in a LAN network environment in order to introduce some bandwidth reduction to get some differences in the streaming qualities to be provided for the users.. 3.4.3.1. Seed data. First step will be the determination of the bandwidth margins to be studied and asked in the questionnaires. So a preliminary test with both streaming technologies that were to be studied was made. This test gave us some answers about streaming behavior in different platforms and for different bandwidths bandwidth settings into local area network in terms of usability and quality. Those data can be found in table 3.1. That previous research will lead us to choose the best qualities and bandwidth restrictions to be offered to the users who will make the survey. For our survey we have chosen bandwidth values that offer reasonable values of QoE in terms of view to no discourage users from viewing the content and evaluating which one of them is better in terms of QoE.. 35.
(50) 3. EVALUATION. Table 3.1: Bandwidth HLS / MPEG-DASH response. Bandwidth (kbps). HLS. MPEG-DASH. 50. No video. Lot of cuts. 100. Lot of cuts. Lot of cuts. 150. Some cuts low resolution. 4K with cuts. 200. Low resolution with small cuts. 4K with cuts. 250. Low resolution with continuity. 4K with small cuts. 300. 4K continuous. 4K continuous. 400. FHD continuous. FHD continuous. Table 3.2: Bandwidth to be evaluated. Bandwidth (kbps) 150 200 250 300. 3.4.4. Answers to the questionnaire. We pretended to get around 100 answers for our survey, but taking into account that we had to modify our tests to add the bandwidth issues we had to take control of the network connection that was going to be used to play the streams. That only was possible to me made using a local area network connection, so the subjects that were going to answer the questionnaire must be in that local network. That limited the quantity of people that could answer the questionnaire to 10. Despite that short quantity of answers we can elaborate a study of the QoE of the offered streaming services and our conclusions: During the execution of the survey, the missing of an important question in the survey has been noticed. That question will correspond to the general evaluation of the quality of the streaming and could be the direct answer to our research question, “which streaming has better QoE ?”. That question could have also offered a way to measure the weight of the other questioned elements from survey into the generation. 36.
(51) 3.4 Implementing questionnaire. of the QoE evaluation response. This way, the importance of the different fields measured in this survey, resolution of the streaming, continuity, etc... could be measured in order to create a general weight of each of them in the evaluation of the QoE. Our propose is to add this question to the next questionnaire in this research field. Given the low amount of answers evaluated, this research work can only be used to obtain a preliminary and indicative sight of what users think about the offered streaming services but those results cannot be extrapolated to all the population. The good point is that results offered offered a “common answer” for our surveys and that made us to know which streaming serviced of the studied had better QoE depending on the weights given to the two main problems in streaming, the continuity and the resolution from a video. Other very good data obtained from answers and previous research work is the minimal necessary bandwidth to get streaming services run smoothly for given resolutions. This knowledge will be very useful when creating player or streaming servers servers that avoid trying to play very high resolution streaming when bandwidth conditions are very bad.. 3.4.4.1. Grouping answers. We have asked for 6 questions: • Has the streaming good resolution? • Have you noticed any pixelated images in any moment? • Have you noticed any cuts during playing? • Have you noticed any discontinuity?. 37.
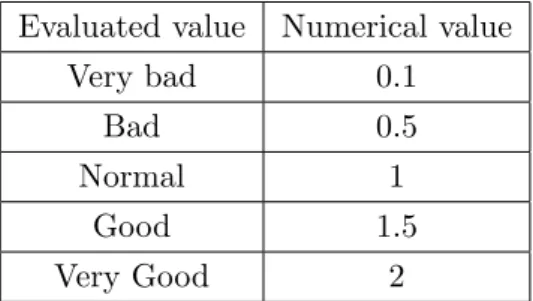
(52) 3. EVALUATION. • Was your computer slow when playing streaming? • Did you notice any abrupt transition between resolution changes? Those questions can be grouped in two main sections:. Video quality • Has the streaming good resolution? • Have you noticed any pixelated images in any moment? Video continuity • Have you noticed any cuts during playing? • Have you noticed any discontinuity? • Did you notice any abrupt transition between resolution changes? and an external question that was added to check the performance of the streaming on clients computer. • Was your computer slow when playing streaming? 3.4.4.2. Scoring the answers. As told in section 3.2.6.4 we are looking for quantitative data so we will have to weight the answers and give them a numerical value in order to compare them. We have asked for two main factors:. • Continuity • Video Quality (resolution). 38.
(53) 3.4 Implementing questionnaire. Table 3.3: Numerical value for continuity answers. Evaluated value. Numerical value. Very bad. 0.1. Bad. 0.5. Normal. 1. Good. 1.5. Very Good. 2. Under our criteria the most important value for a video streaming has to be the continuity, so we will weight responses as follows 3.3: And for the video quality we will weight the responses can be found in table 3.4:. Table 3.4: Numerical value for quality answers. Evaluated value. Numerical value. Very bad. 1. Bad. 2. Normal. 3. Good. 4. Very Good. 5. This way we have some kind of quantitative data from each answer but we need to combine those quantitative value to get a definitive numerical value.. 3.4.4.3. Getting calculation formula. As hypothesis we estimate that the continuity of the streaming will be the most important element in our scoring of QoE, so all answers that belong to that group must be multiplier. Quality related answers are the elements that are going to be multiplied so they must be added together.. 39.
(54) 3. EVALUATION. Resulting formula for this QoE calculation will be: cutsanswer*discontinuity:*abrupttransition*(goodresolution+pixelated) That mathematical formula will give a numerical value for each response obtained from questionnaires. If we take the median for all users and their responses we will get a valuable and quantitative data to compare HLS vs MPEG-DASH.. 3.4.4.4. Comparing results. As an obvious answer to the question of which streaming technology offers betters results in terms of QoE, higher is better, so best QoE result will determine which streaming technology is better for this research work purposes.. 3.4.4.5. Minimum acceptable QoE. Another term to be measured and defined is what is the minimum QoE that a video streaming must have to be considered good enough to be offered to the client. Taking the given formula we could calculate a numerical value that, under our criteria, can be considered an acceptable QoE : Most important thing under our criteria is not having cuts into transmission, so • cutsanswer • discontinuity • abrupttransition must be at least a normal value. On the other hand video video quality must be normal, so answers • goodresolution. 40.
(55) 3.4 Implementing questionnaire. • pixelated must be normal value too. Calculating with the formula given in section 3.4.4.2, acceptable QoE under the above criteria and giving it the values for “normal“ answer defined on section 3.4.4.2 : cutsanswer ∗ discontinuity : ∗abrupttransition ∗ (goodresolution + pixelated) 1 ∗ 1 ∗ 1 ∗ (3 + 3) = 6 So minimum acceptable QoE value must be 6 .. 3.4.5. QoS metric definition. In this section we will determine the QoS of a certain session in order to be compared with QoE to determine their relationship. The best way to do it will be measuring some factors from HTTP streaming sessions like: • Segment resolution • Segment size in MB • Segment download speed At the end of this research work we couldn’t determine a valid QoS metric formula that contained those parameters because the lack of time.. 41.
(56) 3. EVALUATION. 42.
(57) 4. Discussion In this chapter results obtained from questionnaires from chapter 3 will be exposed, evaluated and discussed.. 4.1. Obtained data. Answers from questionnaires are presented in the following tables. In each table are represented the resulting QoE for HLS and MPEG-DASH and for each bandwidth studied. QoE values were the result of the application of the mathematical formula cited in section 3.4.4.3 to given answers from questionnaires. Table 4.1: QoE values for 150Kbs. User 1 2 3 4 5 6 7 8 9 10 Median. HLS 0.2 0.2 0.18 0.15 0.135 0.2 0.2 0.2 0.2 0.2 0.2. MPEG-DASH 0.2 0.16 0.9 0.16 0.18 0.16 0.18 0.135 0.2 0.18 0.18. Table 4.2: QoE values for 200Kbs. User 1 2 3 4 5 6 7 8 9 10 Median. 43. HLS 5 4 12 8 6 6 12 6 7 7.5 6.5. MPEG-DASH 1.25 0.05 4 4.5 4.5 0.8 0.675 0.675 0.9 0.9 0.85.
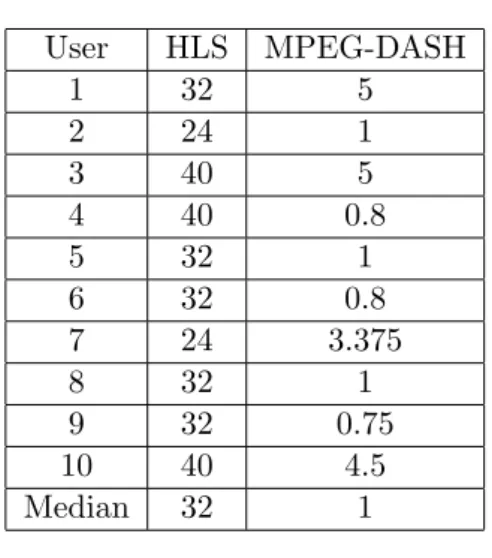
(58) 4. DISCUSSION. Table 4.3: QoE values for 250Kbs. User 1 2 3 4 5 6 7 8 9 10 Median. 4.2. HLS 32 24 40 40 32 32 24 32 32 40 32. MPEG-DASH 5 1 5 0.8 1 0.8 3.375 1 0.75 4.5 1. Table 4.4: QoE values for 300Kbs. User 1 2 3 4 5 6 7 8 9 10 Median. HLS 45 80 30.375 27 54 80 27 72 60 64 57. MPEG-DASH 54 54 45 72 80 80 40 72 80 54 63. Conclusions. Observing the results obtained from section 4.1, it can be determined that, in a general way, HLS streaming gets better results in terms of QoE than MPEG-DASH in all possible bandwidths studied except in the 300kbps bandwidth case where results are quite similar. According to these results, users think that HLS offers more quality than MPEGDASH technology for low bandwidth network environments. Another factor studied was the minimum acceptable QoE for an streaming service that was defined in section 3.4.4.5 and it took 6 as value. According to obtained data from questionnaires, it can be observed that streaming based on HLS with a bandwidth higher than 200Kbps will accomplish with that criteria and could be considered acceptable in terms of QoE. Taking into account the above paragraphs following conclusions can be reached: 1. HLS is much better than MPEG-DASH for low bandwidth environments 2. MPEG-DASH is better than HLS for high bandwidth environments but not in a significant way 3. Minimum bandwidth for acceptable QoE is 200 Kbps. 44.
(59) 4.3 Discussion. 4.3 4.3.1. Discussion Player dependency. The architecture of most HTTP adaptive streaming technologies determines that the client side will be the part where resides most of the logic and intelligence for choosing the most appropriate content depending on network environment of each streaming session. That makes the quality of the session very dependent of the used player.. In this research work we have used web based players to get operating system independence. Based on this, can be deduced that using different Javascript playing libraries could offer different results in terms of QoE. Because of that can be considered that making some research improving the state of the art could be a good idea to get a better research work.. 4.3.2. Questionnaire planing. Halfway of the execution of this research work was noticed a question that will be determining for it’s implementation;. Bandwidth limitation of the streaming samples was determining to establish a limit for content’s quality to be played. Without that limitation, no difference would have been noticed by answerers of the questionnaire.. This factor could have been foreseen with some previous tests and would have helped to design a questionnaire deployment in a distributed system that could have manage that bandwidth limitation instead of making the questionnaires in a local area network.. As a consequence of this limitation to local area network, the number of people who was asked to answer the questionnaire was much lower than the foreseen one in section 3.2.4.6.. 45.
(60) 4. DISCUSSION. 4.3.3. Number of answers. As result of the issue from section 4.3.2, only 10 people could answered to this questionnaire. It may be a low number, but they have been obtained after an exhaustive research getting user’s answers from very different network conditions and using different streaming technologies. This knowledge has enriched this work by getting a deeper knowledge of the opinion of the use under controlled situations. This obtained data could be used as a base to generate questionnaires with a wider base of answerers.. 4.3.4. Answers scoring. The given score to the answers to the questionnaire will be decisive when getting the quantitative results. If we weight that streaming continuity is much more important than video resolution of quality we are conditioning the quantitative value from the answer. This aspect could have been solved making a decisive and general question about oE. Do you think that this video has good or bad quality? This way could have drive us to determinate if our answers weighting was right or not.. 4.4. Contribution to knowledge. Main contribution of this research work to the knowledge could be focused in two areas:. 4.4.1. Minimum bandwidth settings. As contribution to the knowledge we can emphasize that we have got the minimum bandwidth necessary to play a 4K definition HTTP adaptive streaming without any interruptions. This data could be decisive when offering some kind of personalized. 46.
(61) 4.5 Future work. streaming service to clients. This way streaming resolution could be limited on server side depending on client available bandwidth. Main problem for this architectures is that the necessity of having two intelligence systems, one on server side and the another one in client side, but this architecture assures offering minimal acceptable quality to clients by limiting maximal available resolution in server to be offered. This way system could avoid bad implementations of quality selection on client side.. 4.4.2. Answers weight. Although this is a short research work, weighting and process of answers from questionnaires is mature enough to be considered valid for similar research works. Future work in this area would involve the validation of this kind of weighting by another questionnaires.. 4.5. Future work. A very important factor to get good QoS measures will be determining if a segment download from server side from streaming server is fast enough to feed a HTTP player. It wasn’t possible be established it in this research work but we think that it would be a great advance to calculate a good QoS measure that will help in a great way to complete section 3.4.5. Another factor we want to highlight is the relationship between service cuts and QoE perception, under proposed hypothesis every streaming that has a lot of cuts in service or big ones trends to be qualified by users as bad quality in higher percentage than an streaming with lower resolution but more fluent one.. 47.
(62) 4. DISCUSSION. A possible way to establish this relationship will be design of an experiment that would offer two different streaming to a client, one of them with lots of cuts but very good resolution and video quality and other one with lower resolution but no cuts. After this streaming has been played, user should answer a questionnaire giving a punctuation for this streaming.. 48.
(63) 5. Materials & methods. 49.
(64) 5. MATERIALS & METHODS. 50.
(65) References [1] Akamai. Akamai internet survey 2015. https://marketing4ecommerce.net/ la-velocidad-media-de-conexion-a-internet-en-espana/, 2015. 35 [2] Saamer Akhshabi, Sethumadhavan Narayanaswamy, Ali C. Begen, and Constantine Dovrolis. An experimental evaluation of rate-adaptive video players over HTTP. SIGNAL PROCESSING-IMAGE COMMUNICATION, 27(4, SI):271–287, APR 2012. ISSN 0923-5965. doi: {10.1016/j.image.2011.10.003}. 9 [3] Amazon. Amazon web services. https://aws.amazon.com/, 2015. 30 [4] Apple. Http live streaming. https://developer.apple.com/streaming/, 2015. 21, 30 [5] Nassima Bouzakaria, Cyril Concolato, and Jean Le Feuvre. Overhead and Performance of Low Latency Live Streaming using MPEG-DASH. In 5TH INTERNATIONAL CONFERENCE ON INFORMATION, INTELLIGENCE, SYSTEMS AND APPLICATIONS, IISA 2014, pages 92+, 345 E 47TH ST, NEW YORK, NY 10017 USA, 2014. Inst Elect & Elect Engineers; Biol & Artificial Intelligence Fdn; Univ Piraeus, IEEE. 5th International Conference on Information, Intelligence, Systems and Applications (IISA), Chania, GREECE, JUL 07-09, 2014. 14 [6] Nassima Bouzakaria, Cyril Concolato, and Jean Le Feuvre. Fast DASH Bootstrap. In 2015 IEEE 17TH INTERNATIONAL WORKSHOP ON MULTIMEDIA SIGNAL PROCESSING (MMSP), 345 E 47TH ST, NEW YORK, NY 10017 USA, 2015. IEEE. ISBN 978-1-4673-7478-1. IEEE 17th International Workshop on Multimedia Signal Processing (MMSP 2015), Xiamen, PEOPLES R CHINA, OCT 19-21, 2015. 14. 51.
Figure

+5

Documento similar
Currently the approach is to use a base humanoid in MPEG-4 and to modify it via MPEG-7 descriptions, although the target is to have a whole MPEG-7 description soon allow- ing
For the A RP suite of simulations which has by far the strongest feedback the average inflow rate drops by a factor of 10, but for this suite the inflow rates are higher towards
We conclude that the procedures behind PGS generate numerous positive impacts in the territories related to local producers (and consumers) empowerment and localised agri-food
Based on the preceding discussions, the study posits hypotheses and research questions in terms of four dependent variables of gender effects on mobile advertising
• One of the objectives of this research work, under the domain of video news reports, focuses on the selection of the most appropriate MPEG-7 visual descriptors and their
In order to choose events in each of the states we want to study both their angular correlations and the 6 He and neutron energy distribution, we defined two ranges on the 11
The fact that we receive a potentially infinite stream of items poses new challenges for novelty in- creasing systems, as redundancy, which is taken to be a con- stant in session
Due to this, the design of the proposed neural network architecture is based on learning structures and focused on non-linear problems, such as the mentioned temperature
