TítuloConstruction and demolition debris in hot mix asphalt
6
0
0
Texto completo
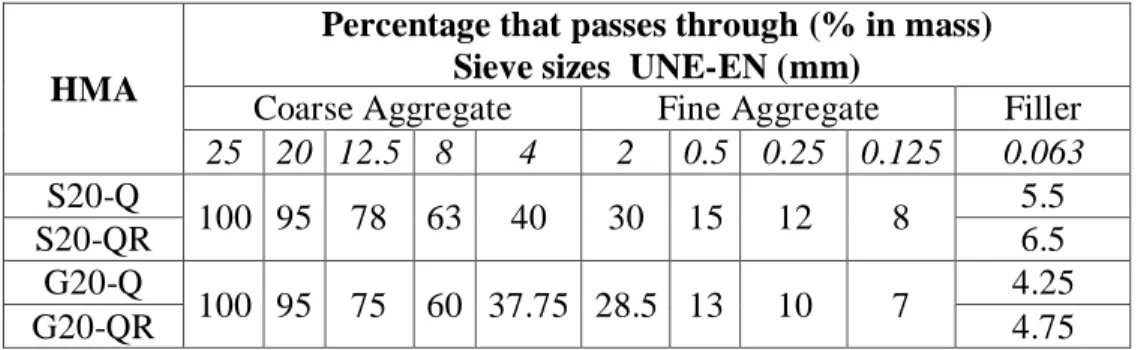
(2) HMA S20-Q S20-QR G20-Q G20-QR. Percentage that passes through (% in mass) Sieve sizes UNE-EN (mm) Coarse Aggregate Fine Aggregate Filler 25 20 12.5 8 4 2 0.5 0.25 0.125 0.063 5.5 100 95 78 63 40 30 15 12 8 6.5 4.25 100 95 75 60 37.75 28.5 13 10 7 4.75. Composition and properties of aggregates The recycled aggregates have the following composition in weight: concrete (77.4%), stone (20%), ceramic (2%) and bitumen (0.6%). Table 2 shows the main characteristics of the aggregates corresponding to the particle sizes studied. Table 2. Characteristics of HMA aggregates. Test Water absorption coefficient (%) Los Angeles Abrasion (%) Relative density. HMA S20-Q S20-QR G20-Q G20-QR 0.17 4.59 0.19 4.82 19.4 25.6 22.1 24.8 2.69 2.66 2.69 2.66. It is interesting to note that the water absorption coefficient in the mixtures containing recycled aggregate is much higher than the value obtained in mixtures using only quarried aggregates. Relative density values are similar in all cases. Hydrocarbonated binder The binder used was conventional bitumen with a penetration grade 60/70, which meets the specifications established under the Spanish General Directorate of Highways, known as PG-3. The optimum content of bitumen (Bo) for each mixture was determined by means of the Marshall test (75 blows per side). Table 3 presents the optimum percentage of bitumen in relation to total aggregate weight as well as the percentage of air voids (Va) and annual average daily heavy traffic (AADT HT) for which the mixture was designed in keeping with PG-3 (General Directorate of Highways, 2002). What stands out among these data is the large quantity of bitumen and filler used in the mixtures with recycled aggregate (S20-QR and G20-QR). In these cases, it was necessary to increase the filler content almost to the upper limit of the grading envelope, due to the high asphalt absorption and the higher level of air voids. The large number of pores found in this aggregate raises its specific surface, and therefore greater quantities of bitumen are needed to form the same layer of film around the aggregates. Hence a greater amount of filler is also required to maintain the filler-bitumen relationship..
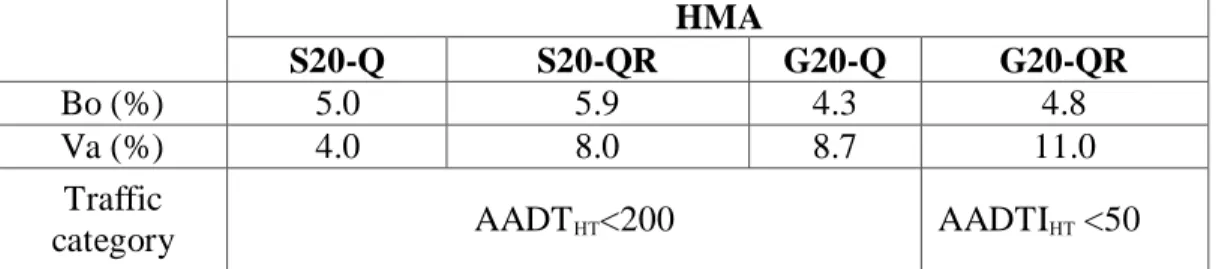
(3) Table 3. Optimum percentage of bitumen (Bo) and traffic categories of the mixes HMA Bo (%) Va (%) Traffic category. S20-Q 5.0 4.0. S20-QR 5.9 8.0 AADT HT<200. G20-Q 4.3 8.7. G20-QR 4.8 11.0 AADTIHT <50. EXPERIMENTAL PROCEDURE Bending fatigue test Fatigue test were carried out in 3-point bending (3PB) according to Spanish standard NLT-350-90 (General Directorate of Highways, 1992). The specimens were prismatic beams of 300mm x 50mm x 50mm. The set-up consisted of an Instron 8516 servo-hydraulic testing machine with a ±5kN capacity which was controlled by Wavemaker software. The strain was measured using an Instron strain-gauge extensometer with a gauge length of 50mm placed at the bottom of the beam, and attached with rubber bands around the middle of the sample, as described in Figure 1. The temperature was kept at 20ºC ± 1ºC in an environmental chamber. Experiments were performed in the controlled displacement mode by applying a sinusoidal waveform with a frequency of 10 Hz. Fatigue failure was assumed to occur when the flexural stiffness was reduced to 50% of the initial flexural stiffness or after the application of six hundred thousand loading cycles, whichever occurs first. The initial flexural stiffness is the flexural stiffness calculated by the data acquisition software at the 200th load cycle. The fatigue law in deformation Fatigue results are expressed by means of the -N approach, namely: 200 KN B where 200 is half of the initial strain amplitude, N is the number of load cycles applied until failure (to crack initiation) at a given strain amplitude, K and B are experimentally determined material coefficients that describe the fatigue behavior of the mixtures. Flexural fatigue testing was performed on ten beams for each type of HMA. The displacement amplitude values in the fatigue testing covered an overall range between 80 m and 350 m, depending on the beam used. Dynamic Modulus The dynamic modulus (DM) is a measurement of the stiffness of mix in a steady state, and is defined as the ratio between the amplitude of the sinusoidal stress (T) and the amplitude of sinusoidal strain () (Di Benedetto et al, 2001). In this work the.
(4) dynamic modulus was determined at the 200th cycle, when the fatigue test is supposed to start.. FIG. 1. Bending fatigue test RESULTS Fatigue results are shown by plotting the strain at the initial load cycle at the bottom of the mixture, versus number of load cycles to failure. Figure 2 depicts the fatigue laws obtained for each mixture. Table 4 summarizes the fatigue coefficients K and B estimated using the least-square error to find the best fit for the data. This table also includes the mean values of the dynamic moduli measured. Based on the results of the fatigue coefficients, it was found that mixtures S20-Q and S20-QR behave in a different way. The fatigue curve of mixture S20-Q has a less pronounced slope (30% less) and exhibits a better fatigue life. According to Table 4, it can be seen that there are also large difference between the two mixtures in terms of dynamic modulus. However, mixture S20-QR exhibits a higher dynamic modulus. In other words, the recycled aggregates increase the initial stiffness, but reduce the fatigue life. Mixtures G20-Q and G20-QR exhibit almost the same fatigue behavior. The difference in the slope of the fatigue curves is around 6.7%, which is considered to be relatively small, and the intersect parameters are very close. The greatest differences in fatigue lifetime are found in the high deformation range, with N<104 cycles. This trend is in keeping with the relationship than can be found for.
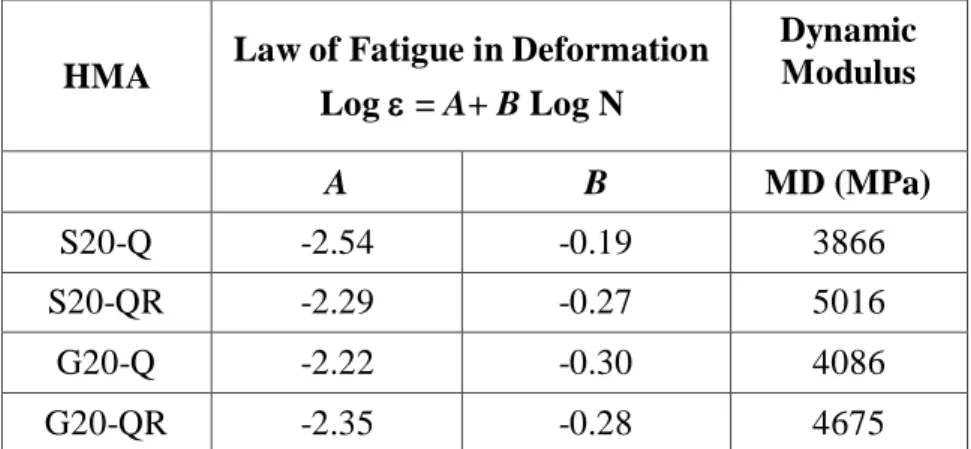
(5) stiffness. Mixture G20-QR has a greater initial modulus than the standard mixture, but the values are similar.. 200. 1,0E+03 1,0E-03. 1,0E+04. 1,0E+05. 1,0E+06. 1,0E-04 S20-Q S20-QR G20-Q G20-QR 1,0E-05. N FIG. 2. Fatigue laws for different mixtures Table 4. Coefficients of the law of fatigue and dynamic modulus. HMA. Law of Fatigue in Deformation Log = A+ B Log N. Dynamic Modulus. A. B. MD (MPa). S20-Q. -2.54. -0.19. 3866. S20-QR. -2.29. -0.27. 5016. G20-Q. -2.22. -0.30. 4086. G20-QR -2.35 -0.28 4675 As shown in Table 4, when recycled aggregate is added, stiffness values are higher even with a greater amount of bitumen. It is believed that the structure of recycled aggregates in the compacted mixtures plays a crucial role, which can lead to some important difference in stiffness behavior. The influence of recycled aggregates may be even greater than the effect produced by the higher asphalt content. It must be pointed out that more research is needed to further explore the effect of recycled aggregates on stiffness..
(6) However, it is interesting to note that the coefficients of the fatigue laws are in keeping with the values reported by other researchers in Spain, and they are within the same range of strain (García, 2000). CONCLUSIONS Coarse mixture G20-QR with 50% RA has similar fatigue behavior to that of G20Q with 100% quarried aggregate. Mixture G20-QR has a higher dynamic modulus than G20-Q. Semi-dense mixture S20-QR with 50% RA exhibits lower fatigue behavior than the S20-Q with 100% quarried aggregate. Mixture S20-QR has a higher dynamic modulus than S20-Q. Recycled aggregates increase stiffness values of HMA even with a greater amount of bitumen. This effect is more marked in semi-dense mixtures. It may be inferred that, from the standpoint of fatigue behavior, it is possible to use CDD in HMA for road building. REFERENCES AENOR. (2003). “UNE- 146131:2003. Áridos para capas granulares y capas tratadas con conglomerantes hidráulicos para su uso en capas estructurales de firmes”. Spanish Association for Standardization and Certification. Madrid. Der-Hsien Shen and Jia-chong Du. (2004). “Evaluation of Building Materials Recycling on HMA Permanent Deformation”. Construction and Building Materials, 18 (6), 391-197. Di Benedetto, H. Partl, M. Francken, L and De La roche, C. (2001). “Stiffness testing for bituminous mixtures”. Rilem TC182-PEB Performance testing and evaluation of bituminous materials. Materials and Structures, 34, 66-70 García, J. (2000). “Caracterización de módulos, fatiga y otros ensayos”. Jornadas sobre caracterización de mezclas bituminosa. p. 21, Madrid. General Directorate of Highways. (1992). “Norma NLT-350/90. Ensayo de fatiga en flexotracción dinámica de mezclas bituminosas”. Ministerio de Obras Públicas y Transportes, Madrid. General Directorate of Highways. (2002). “Pliego de Prescripciones Técnicas Generales para Obras de Carreteras y Puentes PG-3”. Ministerio de Fomento. Madrid. Pérez, I. Toledano, M. Gallego, J. and Taibo, J. (2007). “Propiedades mecánicas de mezclas bituminosas en caliente fabricadas con áridos reciclados de residuos de construcción y demolición”. Materiales de Construcción, 57 (285), 17-29..
(7)
Figure

Documento similar