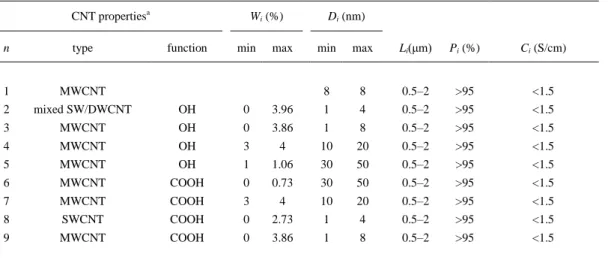
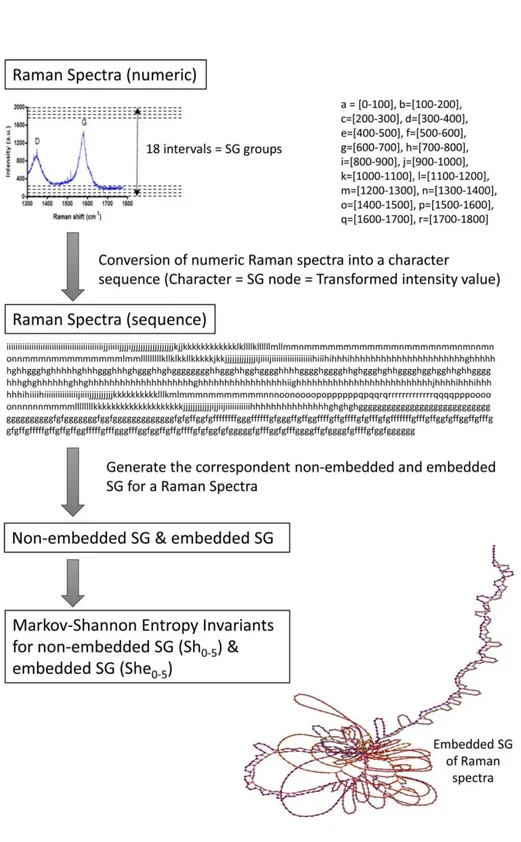
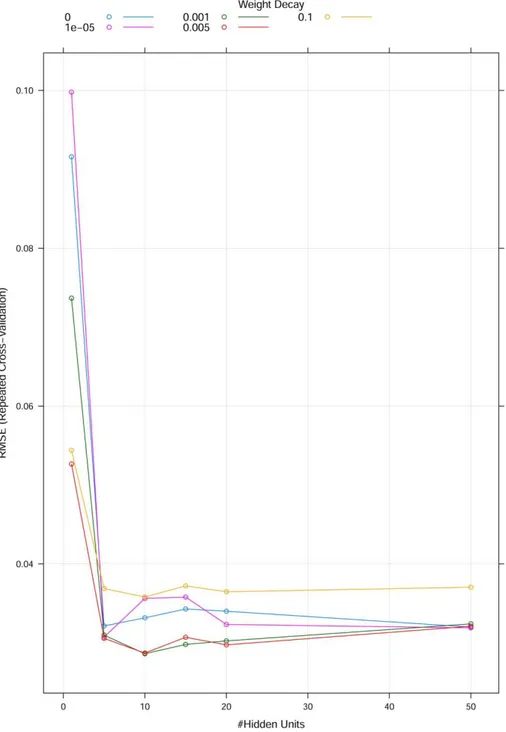
TítuloExperimental–computational study of carbon nanotube effects on mitochondrial respiration: in silico nano QSPR machine learning models based on new Raman spectra transform with Markov–Shannon entropy invariants
Texto completo
Figure


Documento similar
In this new context, this work presents a system- atic study of the profitability limits of a self-consumption PV installation under different conditions of installed peak
FIGURE 4 | Raman spectra of the samples C and D acquired under 633 and 785 nm wavelengths (corresponding to different penetration depths, thus surface and sub-surface regions) and
“Accumulation of amyloid precursor protein in the mitochondrial import channels of human Alzheimer’s disease brain is associated with mitochondrial dysfunction,” Journal
- Bias subtrac&on: the bias level is an electronic offset added to the signal from the CCD that makes sure that the Analogue-to-Digital Converter (ADC) always receives a posiAve
In this paper, the effects of economic growth and four different types of energy consumption (oil, natural gas, hydroelectric- ity, and renewable energy) on environmental quality
This Raman image is colour-coded, where the intensity of the colour is correlated with the Raman intensity of three different bands: the A 1g mode of spinel Co 3 O 4 oxide (solid
Figure 5 shows XAS spectra, obtained in the TEY mode at the region near the oxygen 1s absorp- tion edge, of samples grown with different plasma oxygen contents, taken at
Comparison of the experimental Ni K-edge XANES spectra for 1 Eq-ML of NiO on SiO 2 and MgO and the theoretical spectra calculated for both a NiO cluster (solid line) and for a


