Inspection and Maintenance of the
Vehicle Fleet in El Salvador
Luis E. Morera Lépiz*
Summary
Automotive vehicle emissions are a major source of air pollution in El Salvador, and in general in all of the cities of Central America. Gas and particulate emission levels from the fleet of vehicles in El Salvador are very high, when compared with international standards defining acceptable levels. These levels are high because the fleet of vehicles consists predominately of very old vehicles with deficient maintenance. The consequences of this
situation are varied and serious: frequent respiratory problems among the populace, high levels of fuel consumption, excessive repair costs, high indices of accidents and on-the-road breakdowns, and greenhouse gas emissions (GHG).
Income levels of most vehicle owners in developing countries such as El Salvador do not allow them to acquire other, newer vehicles. This is a serious limitation for reduction of current emission levels. However, experiences in other nations have shown that a considerable margin of reduction is within reach of these countries, if they apply Inspection and Maintenance Programs (IMP). An evaluation of the IMP in El Salvador, whose results are presented in this article, shows that for an inspection cost of US$25 or less, the net benefits are quite considerable and increase year after year. The benefits considered in the calculations are those arising from savings in diesel fuel and gasoline, as well as those coming from the sale of atmospheric carbon reduction services.
In addition to the benefits quantified, the IMP generates incalculable positive effects on the health and quality of life of the population, as well as additional savings in vehicle maintenance costs and health services. And finally, something that is worth emphasizing, this type of program provokes significant reductions in greenhouse gas emissions.
1. Introduction
One of the major agents of pollution found currently in the so-called developing countries is vehicle disrepair. The lack of vehicle maintenance, their age, and second-hand vehicle imports (perhaps already retired from the vehicle fleet of the country of origin), taken together with the poor quality of the fuel sold, all represent a serious problem for the environment, population health, and local economies.
* Luis E. Morera Lépiz:
The exceedingly high rates of emissions, the resulting respiratory problems among the populace, high fuel consumption levels, continuous expenditures on repairs, and high probabilities of both accidents and breakdowns on the road provide clear evidence of this situation.
Although it is true that it is less expensive to have a vehicle in good repair, it is also true that the low levels of income do not allow the purchase of the type of automobile, which would prevent, or at least ease, these problems. Nevertheless, not all of the problems are due to the age of the vehicles. In a large number of cases, the disrepair of the vehicles is due more to a lack of awareness than a lack of knowledge of the rules for correct engine operation and fuel usage.
Thus, the need arises for a type of public control that would not only reduce or prevent the problems noted but would also attempt to inform and raise the levels of awareness of vehicle owners on the damage to their own pocketbook, the public treasury, and the health of their fellow citizens caused by driving an automobile in disrepair. Thus, there is a need to implement an Inspection and Maintenance Program (IMP) for automotive vehicles in El Salvador.
2. Initial Considerations
Complete combustion of a hydrocarbon produces only water and carbon dioxide (CO2), nevertheless, these fuels almost never burn completely and this produces a majority of the atmospheric contaminants. In Central America, more than 50% of the gasoline-powered vehicles and 80% of the diesel-powered ones do not operate within internationally accepted standards (Toledo, 1996). Furthermore, it is acknowledged that a vehicle without emission controls in a developing country pollutes 10 times more than one that is controlled.
There is a tendency to believe that the vehicles that operate with diesel fuel pollute more than those that operate with gasoline. However, the reverse is true. Diesel engines are more energy efficient1 than gasoline engines (i.e., for engines of equivalent horsepower) the diesel produces less contaminants and does not produce significant emissions from evaporation (Toledo, 1996)). In other words, if we compare well-tuned engines of similar technologies, the black smoke from the diesel engine contaminates less than the invisible smoke from the gasoline engine. However, this does not work the same way in developing countries, since the lack of maintenance means that the diesel engines in public transportation and heavy-duty service rarely operate adequately. Thus, in practice, diesel causes more severe environmental problems.
The study cited analyzed 20,000 diesel and gasoline vehicles from Central America. It showed that a tune-up could reduce carbon monoxide (CO), hydrocarbon (HC), and soot emissions between 40% and 60%. The same study analyzed 4,000 urban buses with un-tuned diesel engines and showed that 70% could pass the emissions tests if they tuned-up their engine or repaired the injection pump, while the rest required a complete overhaul (Toledo, 1996).
According to the author, an IMP has to go through the following stages:
• Conversion to lead-free gasoline.
• Obligation to control emissions by using catalytic converters.
• Two types of operational controls: periodic and selective. The periodic controls should be carried out in shops or verification centers authorized by the government; selective controls can be carried out on the road by private enterprise with police support.
In El Salvador, the first of the three recommendations mentioned is already a reality; the second is the project to be evaluated here (although the use of catalytic converters does not appear as an obligation); and the third step constitutes part of the program implementation strategy.
3. Costs and Benefits Expected from an IMP
A program of this type offers two main benefits: a) the potential sale of atmospheric carbon reductions due to reduced fuel usage2, and b) a reduction in respiratory diseases.
Furthermore, other benefits are foreseen, which are:
1. Fewer traffic accidents. This will also reduce: a. Medical expenses, injuries, etc.
b. Time on the road. c. Repair costs.
2. Reduction in traffic congestion costs.
3. Improvement in breathing air quality and urban appearance.
4. Reduction in fuel and maintenance costs.
On the other hand, project implementation also has its costs. Among these we find:
1. The cost of enforcing the emissions control program (i.e., ensuring the credibility of vehicle inspections).
2. The cost of system coordination, inspection period, authorized inspection stations, control schedule and random checks ex post.
3. The cost of designing an incentive system so that the vehicle-owning public collaborates with the project.
4. The investment in time and money for vehicle inspection on the part of the vehicle owner.
5. The Vehicle Fleet in El Salvador in Recent Decades
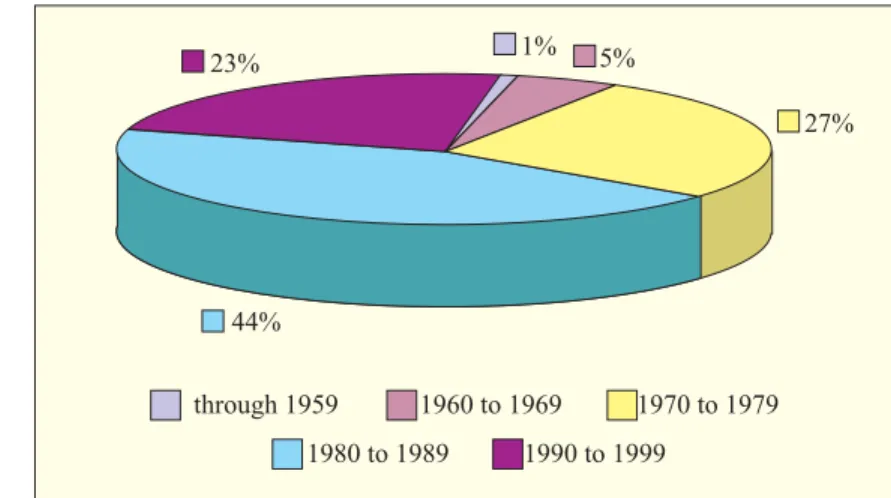
The largest percentage (44%) of the automobiles circulating in El Salvador through 1999 was produced during the 80’s. An additional 27% was produced in the 70’s, while another 6% was produced before 1970. In contrast, only 23% was produced during the 90’s. These data speak clearly of the age of the country’s vehicle fleet. (See Figure 1.)
These data allow us to establish a pair of indicators:
1. The number of vehicles over 10 years old in the vehicle fleet in a specific year.
2. The number of vehicles produced in a specific year in the vehicle fleet that same year (in other words, the number of “new” automobiles).
Figure 2 presents the curves corresponding to data series for both indicators for the period 1958-1999. As
can be seen, the curve for Indicator 1 (number of vehicles over 10 years old) is concave downwards, with a “J” form. This curve has three clear segments: 1) descending through 1972, the year with the lowest percentage of vehicles over 10 years old with regard to the vehicle fleet in that year: 12.1%; 2) from 1973 through 1986, the percentage increases, on the average one percentage point per year; 3) growth rate stabilizes
at 3.8 percentage points per year.
In the curve for Indicator 2 (the number of “new” cars), two segments are visible: one that is predominantly upwards and which reaches its peak in 1965 (with a value of 22.8%); and the other is predominantly downward. It remains clear that the proportion of “new” cars has been decreasing significantly, which is in agreement with the increase in older vehicles shown in the other curve.3
With information on production years for Salvadoran vehicles, it was possible to estimate an indicator that
23% 1% 5%
27%
44%
through 1959 1960 to 1969 1970 to 1979
1980 to 1989 1990 to 1999
Figure 1. Composition of the vehicular fleet in
El Salvador according to the decade of manufacture
50 52 54 56 58 60 62 64 66 68 70 72 74 76 78 80 82 84 86 88 90 92 94 96 98
80% 70% 60% 50% 40% 30% 20% 10% 0% 25% 20% 15% 10% 5% 0% % 1 0 o r more years old of the total % “new” cars of the total
vehicles over 10 years old as part of this year’s fleet
this year’s vehicles as part of this year’s fleet
Figure 2. Two indicators of the age of the vehicular
fleet in El Salvador, 1958-1999
constitutes an approximation of the size of the vehicle fleet. We will call it Indicator 3. For this estimation, the premise was that the number of vehicles that make up the vehicular fleet in any given year is a product of the number of vehicles manufactured that year plus the vehicles manufactured in prior years. This calculation of the vehicle fleet incorporates a premise that is not always true – that vehicles arrive in El Salvador during the year of their manufacture. It is obvious that this premise is not fulfilled in the case of the second-hand vehicles, whose production year is always less than that of importation. In spite of this limitation on the calculation, the indicator can provide an approximate idea of the variations in the size of the vehicle fleet.
Additionally, an indicator was developed for the number of automobiles registered in country, based on the data for vehicular registration. We will call this Indicator 4.
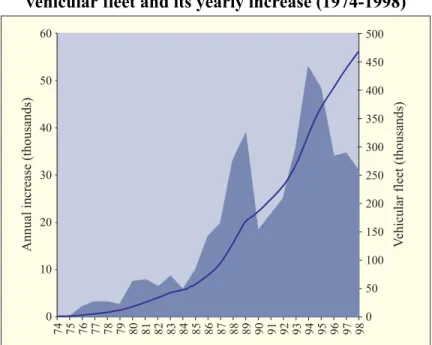
Figure 3 provides the curves that establish the values for indicators 3 and 4, for each one of the years between 1975 and 1998. The shaded area corresponds to Indicator 4 (i.e., the flow of vehicles registered each year). The line corresponds to Indicator 3, and represents the vehicle fleet calculated for each year, as was explained above, based on the year-of-manufacture data.
Analysis of the data from Indicators 1, 2, 3, and 4 (from Figures 2 and 3) provides the following results:
• Regarding age of the vehicles: 77% of the fleet is over 10 years old.
• With regard to fleet growth: aver-aged 28% growth per year, from 1974 to 1999.
On the percentage of used vehicles that enter each year: reached 71% between 1995 and 1999.
5. Increase in Contamination Due to the Vehicular Fleet
According to an executive report from the United Nations Development Programme (UNDP) on air quality in Central America, the most important source of contamination in Central American cities is the automobile fleet. All of the vehicles in the region are imported. Used vehicles predominate, amassing more than 80% of the total between 1995 and 1998. Furthermore, the vehicle fleet in the region is so old that the average age of automobiles is over 14 years. The capacity for contamination by such an aged fleet is even greater since a majority of the automobiles in Central America lack emission control devices, such as catalytic converters. It is also worth noting that diesel vehicles are growing in number, more than 30% of the total circulating fleet, most of which are for public transportation and cargo: taxis, buses, and trucks. All of these data imply that the situation in El Salvador, with regard to automotive-caused air pollution, is representative of what is happening throughout the region.
74 75 76 77 78 79 80 81 82 83 84 85 86 87 88 89 90 91 92 93 94 95 96 97 98
60
50
40
30
20
10
0
500 450 400 350 300 250 200 150 100 50 0
Annual
increase
(thousands)
V
ehicular
fleet
(thousands)
In the aforementioned study (UNDP, 1999), the atmospheric contamination data from 45 monitoring stations was analyzed, eight of which were located in San Salvador.4 Of the contaminants studied, nitrous oxide (N2O) – a particulate matter in suspension sized greater than 10 microns (PST) and particulate matter sized less than 10 microns (PM10) – exceeded quality standards for urban centers in 1997 and 1998. For example, in 1997, San Salvador had the highest PST datum for all of Central America: 639mg/m3 , in 1998 this value was 278mg/m3. In 1990, the World Health Organization (WHO) established a standard of 75mg/ m3. Meanwhile, the values in San Salvador for N
2O were 80.4mg/m3 in 1997 and 62.3mg/m3 in 1998. These were, respectively, the second highest and highest values among the Central American capitals. The standard is 40mg/m3, pursuant to the WHO norms for 1997.
There are several problems causing increased contamination from vehicular GHG emissions. These include the following:
1. A shortage of vehicle maintenance. 2. Subsidized fuel.
3. Imports of used vehicles in disrepair.
4. Deterioration and insufficient growth of the road network. 5. Traffic congestion problems.
6. Increasing vehicle per capita ratio and population density.
Fortunately, El Salvador does not suffer from considerable thermal inversion problems, which magnify the atmospheric contamination in those zones where inversions occur.5
In this context, an IMP application appears the solution for the deteriorated state of the vehicular fleet, while the problem of fuel subsidies requires urgent evaluation on the part of the responsible governmental agencies. The measures to prevent used and deteriorated vehicle imports are on the road to legislative approval. With regard to the deficient state of the highways, Table 1 provides a breakdown of the situation.
4 - The information comes from the FUSADES Laboratory monitoring network, which is under the auspices of SwissContact.
5 - The geographic location of San Salvador and the topography of the zone are favorable to air dispersion, so that phenomena of thermal inversions are unknown (Castillo, 1995), although, according to SwissContact’s records, between April and May 1998, a thermal inversion was present in San Salvador.
Table 1. El Salvador: State of the highways and number of
vehicles in circulation, 1993 and 1999
Year Total length Number of % of roads % of roads in % of roads in in km vehicles in in good repair acceptable repair disrepair
circulation
1993 9,650 267,652 18 22 60
1999 11,200 501,932 38 N/A N/A
N/A: Not available
With regard to the problems of congestion, it is important to note that while the vehicular fleet is increasing by 10% per year, the country’s road network grows by approximately 1% to 2% per year. Notwithstanding, it is important to remember that a great deal of roadwork does not translate into a longer network, but does improve circulation, among these are overpasses, street connectors, and street widening.
The increase in the ratio of the number of vehicles to the number of inhabitants is measured by the number of automobiles per one thousand inhabitants. In 1995, this indicator was 65, by 1999, it had reached 78, and there are projections that it will reach 100 by 2004.
6. Methodology for Evaluating the IMP
According to documents from ProEco-SwissContact (1997ª and 1997b), taking a vehicle to an inspection and maintenance session can easily reduce the contamination between 30% and 40% while reducing the consumption of diesel or gasoline between 5% and 10%.6
In order to evaluate the IMP program, a conservative premise was used, consistent with a 10% reduction in contamination and a 5% drop in fuel consumption. The following step in the evaluation requires factors that relate fuel-use units with contamination units. These factors were calculated by the Energy Technology Institute of the Federal University of Zurich (ETI-FUZ) and correspond to vehicles measured in an FTP757 cycle, according to limits valid for 1993.8
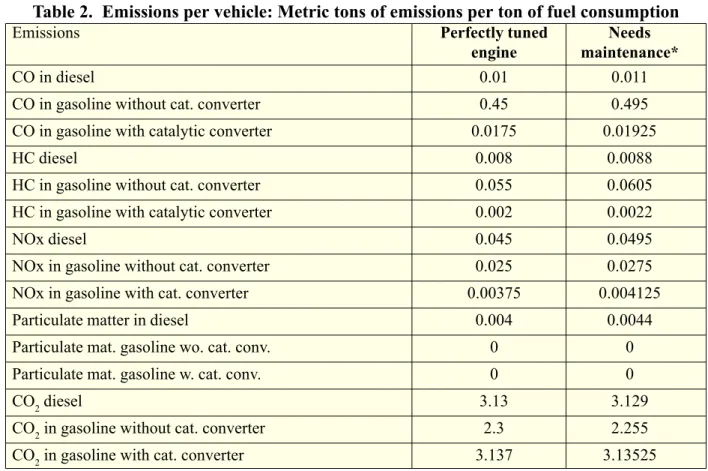
Table 2 provides the factors used to calculate contamination due to CO, HC, nitrogen oxides (NOx), particulate matter, and CO2 from fuel usage.
Table 2 shows that the emissions from the diesel vehicles in perfect shape are comparable to the gasoline-powered ones with a catalytic converter. The other important fact is the significant reduction in emissions with the use of a catalytic converter. The column where the factors increased by 10% due to the lack of maintenance shows a reduction in CO2 emissions, which is contrary to that of the rest of the contaminants.9
A very important aspect that has a notable effect on the results is the premise that the use of catalytic converters be considered over time, since the converters produce an exchange: reduced contamination, but at the same time greater CO2 emissions. The use of catalytic converters is not proposed in the Salvadoran case as a requisite of the IMP, their use will depend on the incorporation of new and used vehicles that are so equipped.
6 - According to Castro and Cordero (1998), the calculations in Costa Rica indicate that the inspection, control, and engine tune-up program generates a savings of 10% to 20% in fuel and a 30% reduction in vehicle emissions. 7 - The FTP75 (Federal Test Procedure at 75ºF) is a testing procedure that simulates in a laboratory a typical urban driving cycle for an automobile. This procedure is employed for emissions certification on new vehicles ex-plant. It was developed by the U.S. Environmental Protection Agency (EPA).
8 - The factors are obtained from vehicles in perfect condition and these change with changes in technology, however, they are considered representative of a true basis for El Salvador’s vehicular fleet.
Table 2. Emissions per vehicle: Metric tons of emissions per ton of fuel consumption
Emissions Perfectly tuned Needs
engine maintenance*
CO in diesel 0.01 0.011
CO in gasoline without cat. converter 0.45 0.495
CO in gasoline with catalytic converter 0.0175 0.01925
HC diesel 0.008 0.0088
HC in gasoline without cat. converter 0.055 0.0605
HC in gasoline with catalytic converter 0.002 0.0022
NOx diesel 0.045 0.0495
NOx in gasoline without cat. converter 0.025 0.0275
NOx in gasoline with cat. converter 0.00375 0.004125
Particulate matter in diesel 0.004 0.0044
Particulate mat. gasoline wo. cat. conv. 0 0
Particulate mat. gasoline w. cat. conv. 0 0
CO2 diesel 3.13 3.129
CO2 in gasoline without cat. converter 2.3 2.255
CO2 in gasoline with cat. converter 3.137 3.13525
The emissions figure for “Needs maintenance” was arrived at by adding 10% to the emissions of a perfectly tuned engine. Source: ETI-FUZ
7. Quantification of the Costs and Benefits of the IMP
107.1 Benefits from the IMP
One of the benefits obtained if the vehicles are well maintained is fuel savings. Table 3 provides a breakdown of this benefit.
The data on savings are greater in the case of gasoline for price reasons, since the savings in metric tons of fuel is slightly larger in the case of diesel. The benefits were calculated over a 20-year period and are presented in five-year increments.
10 - Appendix 2 provides an explanation of the methodology and premises used to quantify the benefits and costs of the IMP. An analysis is also made with regards to sensitivity of the results and on the use of the catalytic converter over time.
Table 3. Benefits in thousands of dollars from fuel savings (Per mt)
FUEL 2001 2005 2010 2015 2020
Another benefit is an eventual marketing of the carbon reductions. Table 4 provides these results.
The sum of the benefits derived from reduced fuel consumption and the eventual sale of carbon reduction services provides the total benefits attributable to the IMP. These benefits (see Table 5) increase over time and are due primordially to fuel savings.
The benefit generated by the sale of atmospheric carbon emission reduction services on the international market may take place once this market gets underway within the framework of the Clean Development Mechanism (CDM) established under the Kyoto Protocol. Although this benefit is small in comparison to the fuel savings, the revenues from the sale of carbon reductions grow over time. Furthermore, this type of initiative for emission reduction can act as a bellwether that the country is committed to world efforts to impede climate change and its severe effects. Furthermore, it also contributes to improving the credibility of the country’s other initiatives in this area.
A benefit that is not directly quantified but that could be the most relevant one in a program such as IMP is the enhanced health of the population resulting from reduced pollution.
Table 6 provides an accounting of the contaminant emission reductions that would occur if the IMP were put into practice.
Table 4. CO
2emissions avoided (In thousands of mt)
2001 2005 2010 2015 2020
Sum of CO2 and CO emissions avoided 135 197 317 510 822
Conversion to thousands of mt of carbon 42 62 99 159 257
Source: Author’s calculations based on Table 2 and Table 2.1 of Annex 2.
Table 6. Contaminant emission reductions (Thousands of mt)
Contaminant 2001 2005 2010 2015 2020
CO 23,398 28,365 33,917 35,847 27,765
HC 3,329 4,142 5,209 6,057 6,033 Nox 4,431 6,132 9,166 13,630 20,150 PM10 0.278 0.401 0.634 1.003 1.587
CO2 111,149 168,551 283,092 474,536 794,013
Source: Author’s calculations based on Table 2 and Table 2.1 of Annex 2.
Table 5. Total benefits in thousands of dollars
Benefits 2001 2005 2010 2015 2020
From fuel savings 17,439 25,337 40,415 64,471 102,849
From carbon marketing 420 615 991 1595 2568
Total benefits 17,860 25,952 41,406 66,066 105,417
By applying “dose-response” functions that express the effect of a change in the measure of contamination on a health outcome (such as the number of sick individuals, the number of office visits to doctors, the probability of falling sick, or the probability of premature death) it may be possible to estimate the additional benefits from the IMP. These would be derived from the cost reductions that a society would reap from a reduction in illnesses among the population and by the reduction of all the additional damage brought on by the diseases themselves.
Two procedures can be used to estimate the benefits to society from reduced contamination including:
a. Relate fuel consumption to an indicator of kilometers traveled and then relate this to the incidence of respiratory diseases.
b. Adopt the parameters from studies that relate pollution indicators to respiratory diseases.
It is possible to apply the first of the procedures cited by using the indicators found in Small and Kazimi (1995), which indicate health expenditures per mile for private automobiles of US$0.03 and US$0.527 for trucks.
To apply the second procedure, we can use a paper prepared by Sanchez and Morel (1995), wherein they determine elasticity of 0.4 for office visits with respiratory complaints regarding PM10 levels. With that datum as a referent, the reduction in office visits for respiratory complaints would be approximately 5.5% per year.
7.2 IMP costs
The costs involved in a program such as IMP include infrastructure installation and that of the necessary equipment for the inspections, resources used to audit the system and keep it operating, as well as the costs associated with vehicle inspections and repairs.
Table 7 deals only with the cost of taking the vehicle in for inspection
Since the premise is that the vehicular fleet will grow over time, program costs will also increase.
7.3 Net benefits from the program
Tables 5 and 7 provide information for calculating the net benefits from the IMP, which appear in Table 8. The IMP would provide net positive benefits at three of the four prices used. At a cost of US$40 per inspection, the net benefits would only appear after the first 11 years of the project had transpired. The
Table 7. IMP costs according to different scenarios for pricing inspection
(Thousands of dollars)
Inspection 2001 2005 2010 2015 2020
pricing (US$)
5 2,893 3,858 5,558 8,044 11,684
15 8,680 11,575 16,674 24,132 35,052
25 14,466 19,291 27,790 40,220 58,420
40 23,146 30,866 44,464 64,352 93,472
net benefits calculated could be conservative and inexact because the health benefits that derive from pollution reductions and the eventual benefits from reduced maintenance costs must still be considered.
8. Conclusion and Recommendations
Given the dominant characteristics of the vehicular fleet in El Salvador, particularly the age and lack of maintenance, and the problems of environmental contamination, a program such as an IMP is necessary. This type of program generates different benefits. The paper estimates only those benefits arising from reduced fuel consumption and CO2 generation. The costs are defined on the basis of different scenarios of inspection pricing. Given these benefits and costs, the program would be expedient, as long as the inspection costs stay below US$40 during the first 10 years.
Program evaluation was carried out from a social point of view, even though the author acknowledges that not all of the relevant costs and benefits were considered. Thus, it would be appropriate to continue working on an estimation of the costs and benefits excluded and assume different IMP evaluation perspectives. It might be interesting to evaluate the IMP from the point of view of the automobile owner or the firms that would offer inspection services.
It would be appropriate to make an evaluation from the point of view of the owner, because it would transmit the information necessary to show that payment for technical inspection services is not an expense but an investment with a series of associated benefits. This information would aid in promoting the project.
Again from the point of view of the owner, the benefits of the project are: the reductions in fuel consumption and maintenance – the benefits from reduced carbon emissions were not considered because they are not a private benefit. Among the costs, it is important to distinguish those for taking the car to the inspection – both money and time – and the additional one that arises if the vehicle does not pass inspection and requires some kind of tune-up. To estimate these costs, it would be necessary to gather the data on how many vehicles do not pass inspection and the costs for different types of repair work.
To obtain more specific and reliable estimates of the costs and benefits from the private perspective, it would be appropriate to carry out a panel study where a sample of vehicles is selected, which is then subdivided into two sub-samples: one would consist of vehicles that had gone through the inspection process; and the other with vehicles that had not done so. With this information it would be possible to carry out a regression analysis to obtain the relation between kilometers per gallon in the whole sample of vehicles and the fact of having gone through the inspection process and having made the recommended repairs, the age of the vehicles, make, model, type of fuel, and other relevant variables. Thus, it would be possible to evaluate the benefit in terms of better fuel performance gained from having passed the technical inspection and this benefit could be compared with the inspection costs.
Table 8. Net benefits from the IMP according to different scenarios for pricing
inspection (Thousands of dollars)
Inspection 2001 2005 2010 2015 2020
pricing (US$)
5 14,966 22,094 35,848 58,022 93,733
15 9,180 14,377 24,732 41,934 70,365
25 3,393 6,661 13,616 25,846 46,997
40 -5,287 -4,914 -3,058 1,714 11,945
Appendix 1.
Contaminants related to the vehicular fleet and their health effects
Contaminant CO (carbon monoxide) HC (hydrocarbons) Photochemical smog (oxidants) Pb (lead) Particulate matter PM10: Particulate matter with a diameter smaller than 10 microns, which floats in the air. Particulate matter PST: Particulate matter with a diameter greater than 10 microns, which floats in the air.
NOx
(Nitrogen oxides NO,
NO2, NO3)
SO2 (Sulfur dioxide)
Results from
Incomplete combustion
Incomplete combustion or evaporation. Bad odors from exhaust gases. When combined with NOx they produce ozone and form smog.
Concentrated HC and NOx in the atmosphere interact with solar radiation to produce a photochemical reaction known as oxi-dants, one of which is ozone, O3.
Additive to increase the octane rating in gasoline.
PM10 is produced by an oxygen deficiency in combustion.
PST includes dust from areas without plant cover, unpaved roads, and industrial sources and services that burn high-sulfur fuels and substances that are not soluble in n-pentane. It also comes from vehicles burning leaded gasoline. Secondary products of combustion. The higher the combustion tempera-ture the greater the forma-tion of Nox.
From the sulfur content in diesel fuel.
Health effects
Very dangerous in poorly ventilated areas, colorless, odorless, and non-irritating. Reduces the absorption of oxygen by the red blood cells, affects perception and thought processes, reduces reflexes and can cause unconsciousness. Affects fetal growth in pregnant women. Together with other contaminants, it promotes respiratory and circulatory problems.
Itchy eyes, fatigue, and a tendency to cough. Can have carcinogenic or teratogenic effects. HC from vehicle engines can cause pulmonary diseases.
Obscures visibility, irritates the eyes and the respiratory system, causes cancer.
Affects the circulatory, reproductive, kidney, and nervous systems of the body. Reduces learning abilities in children and may cause hyperactivity. May cause neurological damage.
Health effects: bronchitis affects the respiration and increases susceptibility to asthma and the common cold. Damages are increased when they combine in the atmosphere with sulfur dioxide. May cause respiratory diseases (affecting children and the elderly more) and lung cancer.
The lead present in PST causes neurological problems, which may lead to a reduction in IQ, among other damages.
PM10 and PST particulate matter are considered the most serious problem in air quality through-out Central America.
They irritate the eyes, nose, throat, cause coughing, headaches, and damage the lungs.
Appendix 2.
The Analytical Method Used
This appendix describes the analysis utilized, clarifies the premises used, and presents a sensitivity analysis of the net benefits from the program. Finally, there are some considerations on the use of catalytic converters.
In order to evaluate the benefits of the IMP we need projections of what the emissions would be without an emissions control program and their effects on carbon generation, the use of fuels, and the incidence of respiratory diseases. This is known as the no-project situation or scenario.
The no-project scenario is compared to the project scenario, which would reflect the lowest carbon generation, lowered fuel usage, and fewer respiratory diseases. The difference between both scenarios is given in physical units, metric tons (mt) of carbon and fuel saved, or the number of respiratory diseases avoided. For these to be accounted for as benefits we must monetize these units; thus, we would use the prices per mt of carbon, per mt of fuel, and the prices of the doctor’s visits for respiratory complaints. This article only considers the benefits from the savings in reduced atmospheric carbon emissions and for reduced fuel usage. The benefits accruing from a reduced incidence of diseases are not monetized but there is a physical reduction in contaminating agents.
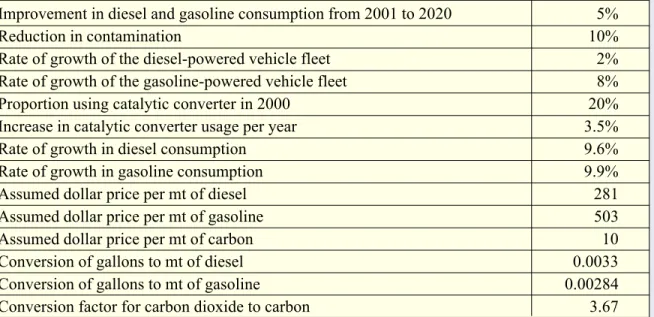
The premises11 used to carry out the project evaluation are presented in Table 2.1.
The first two premises constitute the point of departure for program evaluation; the next two are taken from the historical growth of the vehicular fleet.
11 - With regard to the premises, three aspects stand out: a) an attempt was made to use conservative assumptions, b) there is a loss of precision with the use of unchanging assumptions over time, when – according to projections on the growth of the vehicle fleet – the problems of congestions “ceteris paribus” would modify the rate of growth in fuel consumption, and c) technology is not taken into consideration, which may be fuel sparing. This last effect would modify the rate of growth in fuel consumption, as well as the changes in fuel efficiency, increasing the kilometer per gallon ratio as well as an eventual fuel substitution.
Table 2.1. Premises used for program evaluation
Improvement in diesel and gasoline consumption from 2001 to 2020 5%
Reduction in contamination 10%
Rate of growth of the diesel-powered vehicle fleet 2% Rate of growth of the gasoline-powered vehicle fleet 8%
Proportion using catalytic converter in 2000 20%
Increase in catalytic converter usage per year 3.5%
Rate of growth in diesel consumption 9.6%
Rate of growth in gasoline consumption 9.9%
Assumed dollar price per mt of diesel 281
Assumed dollar price per mt of gasoline 503
Assumed dollar price per mt of carbon 10
Conversion of gallons to mt of diesel 0.0033
Conversion of gallons to mt of gasoline 0.00284
The premises related to the use of catalytic converters are derived from the fact that in 2000, only 20% of the gasoline-powered vehicles had catalytic converters, and this proportion was increasing by approximately 3.5% per year. With an increase in this participation and the growth in the gasoline-powered fleet, there is certainty that the number of vehicles with catalytic converters will increase over time, while the number of vehicles without a catalytic converter will follow a parabolic trajectory, increasing over time to reach a maximum, and then beginning to decline. This proportion will eventually reach zero when all automobiles have catalytic converters. According to our premises here, this would not occur until 2023.
The premises on the growth in fuel consumption are taken from the annual information from 1985 through 1999 (See Table 2.2.). The assumptions on fuel prices are US$0.9143 per gallon of diesel and US$1.429 per gallon of gasoline. These prices appear in the Table on assumptions applied as prices per ton. Finally, an eventual carbon price of US$10 per mt is used. The last three assumptions are not actually assumptions but rather pre-established conversion factors.
The sensitivity analysis:
The critical premises in this evaluation are:
1. The reduction in contamination due to improved vehicle main-tenance.
2. The use of fuels over time and savings through improved ve-hicle maintenance.
3. The use of the catalytic convert-ers over time.
Assumptions 1 and 2 are
endogenous to the implementation of the IMP – the more successful the program, the more pollution is reduced and the greater the fuel savings . Assumption 3 is exogenous and will depend on the incorporation of vehicles with catalytic converters over time. These assumptions may interact, for example, the greater the use of catalytic converters, less atmospheric contamination would be expected, and furthermore, the greater the incorporation of “new” vehicles into the fleet that meet environmental standards, there would be a simultaneous use of catalytic converters, fuel savings, and reduced pollutants.12
The scenarios arise from modifications of the first two premises, and to summarize, variations of the assumptions will take two directions: one where the variations favor project implementation and the other where the variations discourage project implementation.
The changes in the assumptions in favor of the project define the “High” scenario and the changes against the project define the “Low” scenario. These changes are compared with the results already obtained, which are called the “Basic” scenario.
Table 2.2. Fuel use growth rates during the period
from 1985 to 1999
Fuel Average annual Average annual rate growth increase
(percent) (mt)
Diesel 9.6 21,850
Hi-Test Gasoline 8.2* 7,300*
Regular Gasoline 13.1 11,970
Gasoline 9.9 19,270
(*) If only the period from 1991 to 1999 is considered, the average increase is 17,061 metric tons per year and the average annual growth is 21.7%.
Source: Ministry of the Economy.
The High scenario is reached with the following changes:
a. Pollution reduction reaches 20%.
b. Fuel savings reach 10% and the growth rate in fuel usage remains stable.
The Low scenario is developed from the following changes:
a. A pollution reduction of only 5% is achieved.
b. Fuel savings are only 2% and the growth rate in fuel usage remains stable.
It is important to note that the scenarios refer to the expected development of the project. Other actions may be implemented which improve fuel use and reduce contamination, but are not attributable to the IMP project (e.g., technological improvement in automobile design, changes in the relative prices for new and used vehicles, changes in fuel types, fuel use taxes, obligatory catalytic converter use, careful driving programs, etc). What must remain clear is that even though other actions may be taking place, which affect fuel consumption savings and contaminant emissions, what is expected is that the results provided by the scenarios are solely attributable to the IMP and not to the interference of other types of programs.
Results of the scenarios
Given the form in which the scenarios are defined, there are no cost variations, only program benefits. Thus in the High scenario, there is an increase in the benefits insofar as the fuel savings are greater, along with CO2 savings and there is also an increase in contaminants avoided. The opposite occurs in the Low scenario.
Tables 2.3. and 2.4. summarize the net program benefits according to the pre-established scenarios. The data are presented only for inspection prices of US$5 and US$15.
Table 2.3. Net benefits US$ if inspection costs are US$5
Years Scenarios
Low Basic High
2001 4,251 14,966 32,826
2005 6,523 22,094 48,046
2010 11,004 35,848 77,254
2015 18,382 58,022 124,088
2020 30,483 93,733 199,150
Table 2.4. Net benefits US$ if inspection costs are US$15
Years Scenarios
Low Basic High
2001 -1,536 9,180 27,039
2005 -1,194 14,377 40,329
2010 -112 24,732 66,138
2015 2,294 41,934 108,000
With regard to the Basic scenario, there is an increasing trend in net benefits,13 since the costs are greater when inspection costs are increased. The greater the cost of inspection, the smaller the net benefits. If the inspection price is US$15, the net benefits are negative during the first 10 years of the project, according to the Low scenario conditions.
The other project benefit is fewer contaminant emissions. The tables for each scenario are presented below.
The results clearly validate the lower pollution levels with the High scenario.
Since PM10 is one of the contaminants most closely associated with respiratory diseases, the figure presents the evolution of emission reductions for PM10, according to the different scenarios .
Using the elasticity obtained in Sánchez-Morel, in the “High” scenario we can conclude that doctor’s visits for respiratory problems will decline by 10% per year, in the “Low” scenario, this figure would be only 2.7%.
13 - The explanation for this trend is that the growth rate in weighted fuel use is greater than the growth in the vehicle fleet, which may be due to the greater number of automobile trips, longer average trips, and by an increase in highway congestion.
Table 2.5. High scenario: Contaminants avoided
(Thousands of mt)
Contaminant 2001 2005 2010 2015 2020
CO 46,796 56,730 67,834 71,694 55,530 HC 6,657 8,283 10,417 12,113 12,066 NOx 8,863 12,264 18,331 27,261 40,299 PM10 0.556 0.802 1,269 2,006 3,173
CO2 222,299 337,102 566,183 949,071 1,588,026
Table 2.6. Low scenario: Contaminants avoided
(Thousands of mt)
Contaminant 2001 2005 2010 2015 2020
CO 10,919 13,237 15,828 16,729 12,957 HC 1,553 1,933 2,431 2,826 2,815 NOx 2,068 2,862 4,277 6,361 9,403 PM10 0.130 0.187 0.296 0.468 0.740 CO2 42,900 65,529 110,975 187,424 315,754
Figure 2.1. Scenarios of PM10 emissions
avoided (thousands of metric tons)
3,500
3,000
2,500
2,000
1,500
1,000
500
0
2001 2005 2010 2015 2020
The calculations shown in this appendix allowed us to calculate the dollar benefits that would be derived from putting an IMP into practice, due to the fuel savings and carbon emission reductions. The calculations were made for the years 2001, 2005, 2010, 2015, and 2020. First, total benefits were estimated, then IMP costs were calculated, supposing different amounts for inspection costs, and then the net benefits that resulted from subtracting costs from total benefits arrived at previously.
Observations on the use of the catalytic converter over time
As the use of the catalytic converter increases, CO2 emissions grow, but those of the other contaminants fall. Thus, changes in the growth of catalytic converter use would alter the results obtained.
The following summarizes the direction in which the outcomes would be affected, referring to two situations: the first implies an increase in the growth rate of catalytic converter usage (other assumptions remaining constant) and the second foresees a one to one increase in the growth rate of catalytic converter use and the rate of fuel-use improvement.
First situation
If catalytic converter use increases while the rest of the assumptions in the “Basic” scenario remain constant, the amount of CO2 produced increases, but the difference between the amount of emissions without the project and with the project increases; notwithstanding, benefits are increased, if these carbon savings are potentially marketable. By increasing the participation of catalytic converter equipped gasoline-powered vehicles, even though CO2 emissions increase, the difference between the CO2 emissions in the situation without the project and the situation with the project, increases over time, thus improving carbon savings. Obviously, the amount of the possible savings ends when all of the vehicles have catalytic converters.14 The opposite situation occurs when the emissions of CO decline, similar to the savings in CO due to project implementation. This is the general situation for the rest of the contaminants.
The foregoing situation can be generalized as follows: all of the assumptions of the “Basic” scenario are unchanged, but we increase the use of catalytic converters. Indeed, these do not constitute a part of the IMP project. The emissions of all of the contaminants except CO2 decline, so that the difference between the amount of the emissions without the project and with the project would also decline. Thus, we also increase project benefits in the realm of health, by having less contamination, and the potential benefit from carbon reduction sales would also be increased.
Second situation
If we increase the use of catalytic converters and at the same time we increase the efficiency in fuel use as a result of the IMP (for example, increases of one percentage point in each growth rate) the amount of CO2 emissions tends to decline when the project is carried out. This would further increase the CO2 emissions avoided thus increasing project benefits as well.
References
BCastillo, Isaac (1995). Energía y Medio Ambiente El Caso de El Salvador. Mimeógrafo. Document prepared for the Comisión Ejecutiva Hidroeléctrica del Río Lempa (CEL).
Castro, René and Sarah Cordero (1998). Evaluación del Impacto Ambiental y Sostenibilidad del Desarrollo. 1ª edición, San José: EUNED.
Energy Technology Institute of the Federal University of Zurich (ETI-FUZ). Laboratorio de Motores de Combustión Interna y Tecnología de Combustión. http:/ /www.lvv.ethz.ch.
Hernandez de Larios, Silvia (1998). Transporte urbano y contaminación del aire en la región metropolitana de San Salvador. Working Document of Project: “Prevención y Mitigación de la Contaminación Indus-trial y Municipal en el Área del Gran San Salvador” financed by USAID.
Ministry of Environment and Natural Resources (1999-2000). Licitación publica nacional e internacional Contratación de servicios de instalación, administración y operación de plantas de revisión técnica vehicular, la cual incluye la revisión de emisiones contaminantes de gases, partículas y ruidos. MARN-09/99 y MARN 03/ 99.
Orellana, Eliseo (1998). Perfil epidemiológico y medio ambiente en la Región Metropolitana de San Salvador. Working Document of Project: “Prevención y Mitigación de la Contaminación Industrial y Municipal en el Área del Gran San Salvador” financed by USAID.
ProEco-SwissContact (1997). Control de Emisiones de Gases en Motores a Gasolina.
ProEco-SwissContact (1997). Control de Emisiones de Gases en Motores a Diesel.
Shell (1992). El automovilismo y el medio ambiente. Shell Briefing Service, Number 2.
Small, Kenneth and Camila Kazimi (1995). On the Cost of Air Pollution from Motor Vehicles. In Journal Of Transport Economics and Policy. Volume 29 (Nº 1). January 1995.
Sánchez, José Miguel and J. Morel (1995). Una estimación de los beneficios en salud de reducir la contaminación en Santiago. Economía del Medio Ambiente en América Latina. Juan Ignacio Varas Edi-tor. Ediciones Universidad Católica de Chile.
Sancho, Francisco and E. Vega (1998). Base Metodológica para Incorporar Costos Ambientales en Tarifas de Servicios Públicos. Document of the Minis-try of Environment and Energy (MINAE) of Costa Rica, realized in April 1998.
Toledo, José (1996). Control de la contaminación del aire. Guatemala: Pro Eco.