PROGRAMA DE DOCTORADO EN TECNOLOGÍAS DE LA INFORMACIÓN Y
LAS TELECOMUNICACIONES
TESIS DOCTORAL:
Signal processing techniques for agro-industrial machinery
monitoring
Presentada por Rubén Ruiz González para optar al grado de
Doctor por la Universidad de Valladolid
Dirigida por:
Jaime Gómez Gil
Abstract
Signal processing techniques have lately been becoming more and more important in many agro-industrial applications. This signal processing-oriented approach is enabling new perspectives for many areas in the agro-industrial environment, such as real-time machinery monitoring, among others.
The main goal of this thesis is to design, implement, and assess specific signal processing techniques enabling the monitoring of agro-industrial equipment in three senses: predictive maintenance, vehicle tracking, and measurement equipment. The proposed techniques contribute by expanding and extending, and even pioneering, current state-of-the-art techniques. The methodology followed along this thesis in order to reach the intended goals can be divided into five stages: review of the state of the art, hypothesis formulation, development and evaluation, result analysis, and results publication. The review of the state of the art was conducted in order to learn about other already existing techniques. After that, a research hypothesis was formulated to be used as the inception point of the research. Then, in the development and evaluation stage, an experimental setup was designed to develop and assess the proposed signal processing techniques. In the result analysis stage, the obtained results were compared against the literature. From this comparison, the validity of the research hypothesis could be checked. Finally, whenever redefinition of the research hypothesis was mandatory, the methodology went back to the hypothesis formulation stage. If the hypothesis was deemed to be valid, the obtained results were published.
The aforementioned methodology was applied to three different agro-industrial problems: the predictive maintenance of an agricultural harvester, the kinematic tracking of a vehicle, and the monitoring of the flow rate through each individual nozzle in agricultural sprayers. A predictive maintenance approach, based on signal processing of the acquired mechanical vibration signals from an accelerometer placed on the chassis of an agricultural harvester, was proposed to estimate the mechanical status of several components of the machinery before it irretrievably cracks (first article of the compendium). A kinematic tracking approach, based on gathering several motion-related data and applying data fusion techniques, was proposed to enable a more accurate mechanical status estimation of a vehicle (second article of the compendium). An acoustic-based flow rate measurement approach, based on signal processing of the acquired acoustic signal gathered by a nearby microphone, was proposed to estimate, in real time, the actual flow rate coming out of each nozzle in agricultural sprayers (third article of the compendium).
ii
Three main features of the proposed methods highlight over the rest. The first one is that all proposed methods satisfy the intended goals with high enough accuracy. The second feature is that all proposed methods lead to affordable, inexpensive systems. The last feature is the optimization of the methods, leading to less computational needs as compared to other existing approaches. This feature enables these methods to be used in real-time applications.
The results obtained in this thesis are proof of the capability of the proposed signal processing techniques to enable monitoring of agro-industrial machinery. There are two main general conclusions that can be drawn from these results.The first one is that signal processing techniques can extract useful information related to agro-industrial problems. The second conclusion is that all proposed solutions tend to be more cost-effective, more accurate, and easier to deploy as compared to existing solutions. Three main particular conclusions, one for each of the three tackled agro-industrial problems, highlight over the rest: (i) signal processing techniques can successfully be applied for monitoring machinery components without removing and isolating them, even while in normal operating conditions; (ii) real-time monitoring of flow rate from individual nozzles in agricultural sprayers can be achieved by processing the acoustic signal in their surroundings; and (iii) kinematic monitoring of agro-industrial vehicles can be improved by using signal processing techniques for data fusion of GNSS and on-vehicle sensors data.
Keywords
Resumen
En los últimos tiempos, las técnicas de procesado de señal han ido ganando importancia dentro de numerosas aplicaciones industriales. Estos enfoques orientados al procesado de señal están abriendo nuevas perspectivas en muchas áreas del ámbito agro-industrial, destacando entre ellas la monitorización de maquinaria.
El principal objetivo de esta tesis es el diseño, implementación y evaluación de esquemas de procesado de señal específicos que permitan la monitorización de equipamiento agro-industrial en tres sentidos: mantenimiento predictivo, seguimiento de vehículos y equipos de medida. Las técnicas propuestas en esta tesis contribuyen al estado del arte, expandiendo o extendiendo técnicas existentes, e incluso proponiendo esquemas completamente novedosos.
La metodología seguida a lo largo de esta tesis, con objeto de alcanzar los objetivos marcados, se puede dividir en cinco etapas: revisión del estado del arte, formulación de hipótesis, desarrollo y evaluación, análisis de resultados y publicación de resultados. La revisión del estado del arte fue llevada a cabo para aprender sobre otras técnicas similares ya existentes. Seguidamente, se formuló la hipótesis de investigación, que fue empleada como punto de partida de esta tesis. Con ello, en la etapa de desarrollo y evaluación, se diseñó un escenario experimental en el cuál desarrollar y evaluar las técnicas de procesado de señal propuestas. En la etapa de análisis de resultados, los resultados obtenidos fueron comparados con técnicas similares disponibles en diversas fuentes bibliográficas. Esta comparación hizo posible validar la hipótesis. Cuando los resultados así lo sugerían, la hipótesis de partida era modificada y todas las etapas anteriores se repetían nuevamente. Si la hipótesis, original o modificada, era validada, los resultados eran publicados en revistas y congresos científicos.
iv
Tres escenarios experimentales han sido utilizados para cada uno de los tres problemas agro-industriales en los que se centra esta tesis. Estos escenarios fueron cuidadosamente diseñados para poder evaluar adecuadamente los métodos desarrollados.
Tres características principales de los métodos propuestos destacan sobre el resto. La primera es que todos los métodos satisfacen los objetivos con una precisión suficiente. La segunda característica es que todos los métodos propuestos conducen a sistemas que son asequibles y baratos. La última característica es la optimización de los métodos, que conduce a menores necesidades computacionales en comparación con otros enfoques existentes. Esta última propiedad hace que estos métodos puedan emplearse en aplicaciones con requisitos de tiempo real.
Los resultados obtenidos en esta tesis ofrecen muestras de la capacidad de monitorizar maquinaria agro-industrial ofrecida por los métodos de procesado de señal. Hay dos conclusiones principales que se puede extraer de estos resultados. La primera es que las técnicas de procesado de señal pueden obtener información útil relativa a los problemas agro-industriales abordados. La segunda conclusión es que las soluciones propuestas tienden a proporcionar mayor precisión, mejor relación efectividad-coste y son más fáciles de desplegar, en comparación con otras alternativas existentes. Tres conclusiones particulares principales, una para cada uno delos tres problemas agro-industriales abordados, destacan sobre el resto: (i) las técnicas de procesado de señal puede aplicarse de manera exitosa para la monitorización de componentes de maquinaria sin necesidad de retirarlas y aislarlas, incluso mientras la maquinaria está funcionando en condiciones normales; (ii) el flujo de cada boquilla de un pulverizador agrícola se puede monitorizar en tiempo real empleando procesamiento de la señal acústica adquirida en los alrededores de la boquilla; y (iii) se puede mejorar la monitorización cinemática de vehículos agro-industriales empleando técnicas de procesado de señal para fusionar datos procedentes de los sensores del vehículo con datos de posicionamiento GNSS.
Palabras clave:
Acknowledgements
This thesis is the outcome of several (some of my closest ones may say too many) years researching at Department of Signal Theory and Communications and Telematics Engineering in the University of Valladolid. It may sound cliché, but without the help, support and effort of many many people I would have never been able to make it through this process. To everyone, it goes my gratitude and recognition.
Let’s start with the obvious: without my parents I would not even exist at all. You have suffered more than anyone throughout all those years, specially my absences while being abroad. I will never get to show you how grateful I am to you. Everything I have reached is because of you. Thanks for always being such a good model for me. I love you with all of my heart!
A similar recognition is deserved by my brother and sister. We have shared so many memories together, which have shaped me into who I am nowadays, that is impossible not to credit yourselves for this accomplishment. I love you, guys!
Third, but not less important, to my better half. I could not be any more grateful than I am to research. Not just professionally, but personally. I would have never expected to meet the love of my life during a scholarship abroad. Thanks for your love, support, understanding, encouragement, believing in me, and always making me strive for better, Maiara!
A remarkable acknowledgement goes to my advisors Jaime, Francisco Javier and Luis Manuel. Thanks for your confidence and support throughout this process. Without your help and orientation I would have got lost along those years. A special mention goes to Jaime. We have shared a lot of time together and you have become not just an amazing mentor but a good friend to me. Don’t ever change your humble way of being and your closeness with your students. It has been an honor to have you both as professor and an advisor during these years and it will be my pleasure to be your friend forever.
To my grandparents, for having raised such amazing parents and for the moments I could manage to share with you. Thanks for always believing in me and encouraging me. May God rest your souls in peace.
To all my lab partners. Thanks for your help during this whole process and for standing my non-stop talking from time to time.
To my friends, for supporting me, even when you didn’t understand why I was dedicating my time on research, and for distracting me from my worries. I’m honored to have such a few but amazing friends.
vi
I want also to express my gratitude for the opportunity to enjoy four research stays in two international research groups. First, I have to thank the Biosystems and Agriculture Department of the University of Kentucky (USA) and Tim Stombaugh for the opportunity to do two stays to work with his research group. It was very profitable because of the chance to work with a multidisciplinary group, to use their facilities to perform experiments, to meet amazing people, and to improve my English. Second, I have to thank the Departamento de Engenharia Agrícola of the Universidade Federal de Viçosa (Brazil) for their support, allowing me to collaborate with them, meet awesome people, and learn Portuguese too. Thank you to all of you: Tim, Francisco, and Flora, as well as all the rest of the amazing people I met during my stays.
To all my students. Lecturing while doing my PhD has given me an enormous personal satisfaction. Thanks for having helped me, allowing me to change my thoughts for a while during the lessons and encouraging me to never stop learning.
I also need to express my gratitude to my university (University of Valladolid), together with Banco Santander, for the grant that has allowed me to undertake this research as well as some of my scholarships abroad.
I cannot forget about thanking Javier, who directly contributed with useful help for my entire thesis with productive and valuable feedback.
My most sincere acknowledgement also goes to the two reviewers of the thesis, who have hugely contributed to enhance the final version of this thesis.
By last, I would not want to forget about anyone who should be credited in this section: colleagues from the department who have shared my worries and frustrations and have encouraged me into succeeding, people from all over the world that I have met during all those years, etc. Some of you have become good friends, but surely none will ever be forgotten.
Contents
Abstract ... i
Resumen ... iii
Acknowledgements ... v
Contents ... vii
List of Figures ... ix
List of acronyms ... xi
I Introduction to the compendium ... 1
1. Contextualization ... 3
2. Algorithms involved ... 5
2.1. Supervised learning in machine learning ... 5
2.2. Data fusion ... 11
3. Motivation and hypothesis formulation ... 13
4. Objectives ... 15
5. Methodology ... 17
6. Articles in the compendium and their relationship ... 19
7. Results ... 23
7.1. Predictive maintenance monitoring ... 23
7.2. Vehicle tracking monitoring ... 24
7.3. Flow rate monitoring ... 25
8. Conclusions ... 27
9. Future work ... 31
10. Merits and diffusion of the results ... 33
10.1. Publications ... 33
10.2. Projects ... 35
10.3. Research stays ... 35
10.4. Teaching ... 36
10.5. Other merits ... 37
II Articles in the compendium ... 39
viii
Article 2: Vehicle tracking monitoring... 67
Article 3: Flow rate monitoring ... 81
III Articles out of the compendium ... 95
Article 4: Vehicle tracking monitoring... 97
Article 5: Predictive maintenance monitoring ... 99
List of Figures
Figure 1. Representation of a Support-Vector Machine classifier corresponding to (a) a linearly separable pattern, where the hyperplane totally separates green circles from red squares, and (b) a non-linearly separable pattern, where no hyperplane separates all the green circles from the red squares. ... 8
Figure 2. Representation of a Support-Vector Machine classifier with a nonlinear kernel. Function is the nonlinear transformation mapping vectors from (a) the input space to (b) the feature space. ... 9
Figure 3. Architecture of a Support-Vector Machine classifier. Inner product kernels, , denote the -dimensional kernel inner product of the input vector with each of the
Support Vectors. ... 10
Figure 4. Stage diagram of the Kalman filtering loop. ... 11
Figure 5. Block diagram of the methodological stages of this thesis and their relationships. ... 17
Figure 6. Relationship between three articles composing this thesis. ... 20
Figure 7. Data acquisition setup for predictive maintenance monitoring. An accelerometer was placed on the structure of the machine, connected by means of a cable to an acquisition system, and a laptop was used to register and visualize the acquired data. ... 24
Figure 8. Data acquisition setup for vehicle tracking monitoring. An accurate GPS receiver, shown in foreground, was placed on top of the car to use as reference for comparison of the results coming from the data fusion approach. ... 25
List of acronyms
ANN Artificial Neural Network
CFD Computational Fluid Dynamics
EKF Extended Kalman Filter
GNSS Global Navigation Satellite System
IMU Inertial Measurement Unit
IoT Internet of Things
KF Kalman Filter
LS Least Squares
OBD On-Board Diagnostics
PdM Predictive Maintenance
RBF Radial Basis Functions
I Introduction to the compendium
1. Contextualization
1.
Contextualization
More and more areas are benefiting from signal processing techniques since its inception steps. From medicine (Unser & Aldroubi, 1996) to economics (White, 1988), including many other more related areas, almost all imaginable areas can make substantial profit from using signal processing techniques.
Signal processing techniques have been becoming increasingly important in the agro-industrial field in the recent years (Jardine, Lin, & Banjevic, 2006; Liakos, Busato, Moshou, Pearson, & Bochtis, 2018; Staszewski, 2002). The introduction of this kind of techniques in the agro-industrial environment is enabling new perspectives for many areas (Smith & Shankar, 2018), such as machinery monitoring, drones and IoT for crop monitoring, remote sensing, precision spraying, robotics, machine learning, among others.
In this context, this thesis aims at investigating and proposing new signal processing-based approaches for machinery monitoring in the agricultural and industrial fields. In particular, this thesis focuses on three subareas of one of such areas, namely machinery monitoring: predictive maintenance, vehicle tracking, and measurement instrument. Agro-industrial equipment demands for ways to monitor its behavior, so as to enable the machinery operator to adjust in real time while working (Zhang, Wang, & Wang, 2002).
Agro-industrial machinery has many components that require an accurate monitoring so as to perform well when conducting their work. Some prototypical examples of magnitudes that need for accurate estimations while operating are kinematic properties, namely, position, speed, and so on. However, there exist other important magnitudes that are relevant to achieve the goals of precision agriculture, such as sprayed chemicals, rotating components status, among others.
Agro-industrial machinery is prone to suffer from wear due to its use, being advisable a proper early supervision in order to avoid large expenditures in maintenance. Thus, machinery predictive maintenance is compulsory whenever an efficient handling is desired. Inspections performed by qualified operators have traditionally been the most common way to undertake those maintenance tasks. Nevertheless, lately, new automatic procedures have appeared thanks to signal processing techniques (Han & Yang, 2006). Those approaches, though, need for component isolation before analyzing its condition. A new method, enabling automatic predictive maintenance of all components simultaneously while operating, seems to be in much need.
4
Agro-industrial machinery exhibits other equipment demanding for measuring devices. Those measuring devices are employed to control other magnitudes that are paramount for proper operation in precision agriculture. The sprayed quantity of chemicals is a variable of great importance when spreading pesticides, fungicides or herbicides on a crop (Tellaeche, BurgosArtizzu, Pajares, Ribeiro, & Fernández-Quintanilla, 2008). A mistaken quantity may lead to damaging the crops or reducing the yield. The flow rate measurement devices currently used are expensive, making completely unaffordable to employ one for each nozzle in an agricultural sprayer with over sixteen nozzles. Thus, an acoustics-based device, requiring an inexpensive microphone, could be used instead, realizing that the nearby acoustic signal depends on the flow rate coming out of the nozzle.
2. Algorithms involved
2.
Algorithms involved
Several well-known algorithms are involved in the proposed signal processing techniques from this thesis. This section deals with a brief summary of them to serve as a basic introduction for the interested reader.
2.1.
Supervised learning in machine learning
Machine learning, as a sub-field of artificial intelligence, deals with intelligent systems that can modify their behavior in accordance with the input data. Those intelligent systems must have the capability of deducing the function that best fits the input data, in order to learn from the data. Supervised learning is a branch of machine learning. Supervised learning builds an input to output mapping based on sample known input-output pairs. It is opposed to unsupervised learning, where learning happens without being given any known input-output mapping. Supervised learning algorithms employ training data in order to generate an inferred function or mapping. This generated function is to be used for future mapping of new data. Learning algorithms are required to generalize well to possible data discrepancies in the test set.
2.1.1.
Regression
Regression is a branch of supervised learning, even though classical approaches appeared before machine learning techniques even existed. It aims at estimating the relationships between a dependent variable and one or more independent variables. Regression helps understand how the dependent variable depends on the independent variables.
Regression involves the following variables and parameters:
The unknown parameters, denoted as .
The independent variables, denoted as .
The dependent variable, denoted as .
Regression relates to a function ( ) of and , i.e. . This function, , is typically chosen to fit well the underlying relationship between data, but generic adaptable polynomial functions are also commonly used when no prior knowledge about this relationship is at hand.
There exist several methods to accomplish regression, as can be seen in the literature (Sheather, 2009). As far as this thesis is involved, nonlinear regression with data linearization was employed. More specifically, a square root-like function was fitted by means of data linearization plus least squares (LS) technique.
√
6
It can be rearranged so that LS fitting can be performed between and :
(2)
2.1.2.
Classification
Classification, as a branch of supervised learning, is defined as the process of identifying the class to which a previously unseen observation belongs, based on previous knowledge given by a training dataset that contains instances the category membership of which is certain. Any algorithm which performs classification tasks ‒i.e. the mapping of input data to an assigned class‒ is called a classifier.
Classifiers must be trained, based on previous knowledge, in order to function properly. The training process makes use of a sample of N observations, the corresponding classes of which are certain. This sample of N observations is typically divided into two subsamples: the training and the test datasets. Firstly, the training dataset is used in the process of computing a classifier that is well-adapted to these data. Then the test dataset is used to assess the generalization capability of the previously computed classifier.
Both the misclassification rate and the success rate in the test dataset are commonly used as quality measurements to assess classifier performance. The misclassification rate is defined as the proportion of observations which are wrongly assigned to an incorrect class. It is expressed as follows:
(3)
Alternatively, the success rate (also called the hit rate) is defined as the proportion of observations that are properly assigned to the corresponding class and is calculated as follows:
(4)
2. Algorithms involved
calculated as the average of the success rate obtained for each of the k different test datasets. When k=N, k-fold cross-validation is also known as leave-one-out cross-validation.
Many different classifiers have been proposed in the literature (Jain, Duin, & Mao, 2000; Kotsiantis, 2007). Some of the main ones include k-nearest neighbor classifier, Bayes classifier, logistic regression, Fisher’s linear discriminant, decision tree, Artificial Neural Networks (ANN), and Support-Vector Machine (SVM). SVM classifier is described in greater detail in subsection 2.1.3.
2.1.3.
Support Vector Machines
(SVM)
Support-Vector Machine (SVM) is a statistical supervised machine learning technique, used both for classification and for regression purposes. Originally proposed by Vapnik and Cortes (Cortes & Vapnik, 1995; Vapnik, 1998), in 1995, although its principles and derivation differ from those of Artificial Neural Networks (ANN), some authors sometimes consider SVMs as a special kind of ANN (Haykin, 1998). However, many authors refuse to do so, due to essential differences between SVM and ANN techniques (Ren, 2012). While SVM mechanisms are mainly based on a rigorous geometrical and statistical approach, ANNs try to emulate the behavior of the human brain and its neural system.
The original SVM proposal was aimed at both the binary classification problem, considering only two possible classification classes, and the multiclass classification problem, which considers more than two classification classes.
Binary linear SVM classification performs the calculation of the optimal hyperplane decision boundary, separating one class from the other, on the basis of a training dataset. Optimality can be understood, depending on whether perfect classification of the training dataset is feasible and desired, in two separate ways:
If perfect separability of training dataset classes can be achieved, a Hard Margin optimality can be used. In this case, the hyperplane decision boundary is chosen to maximize the distance from the hyperplane to the nearest training data point.
If perfect classification is not desired or if it is impossible, a Soft Margin optimality is used. In this case, the hyperplane selection is a customizable tradeoff between minimizing the misclassification rate and maximizing the distance to the nearest properly classified training point.
8
SVM multiclass classification usually tackles the classification and computation of the decision boundary, by reducing the problem to a set of binary classification problems. The main such approaches are pairwise and one-versus-all classification methods (Hsu & Lin, 2002). Compact multiclass reformulations of the binary classification problem have also been proposed (Hsu & Lin, 2002).
(a) (b)
Figure 1. Representation of a Support-Vector Machine classifier corresponding to (a) a linearly separable pattern, where the hyperplane totally separates green circles from red squares, and (b) a non-linearly separable pattern, where no hyperplane separates all the green circles from the red squares.
To be mathematically rigorous, the most general SVM linear binary classification problem can be stated as follows:
“Given a training dataset, { } , the goal is to compute the optimal weight vector , bias , and slack variables , such that satisfy the following constraints:
(5)
and such that the following cost function is minimized:
∑
(6)
where, denotes the i-th input vector, { } denotes the class corresponding to the i-th input vector, { } represents the slack variables, and the constant C is a
user-specified parameter that determines the tradeoff between misclassification and maximum inter-class margin.”
2. Algorithms involved
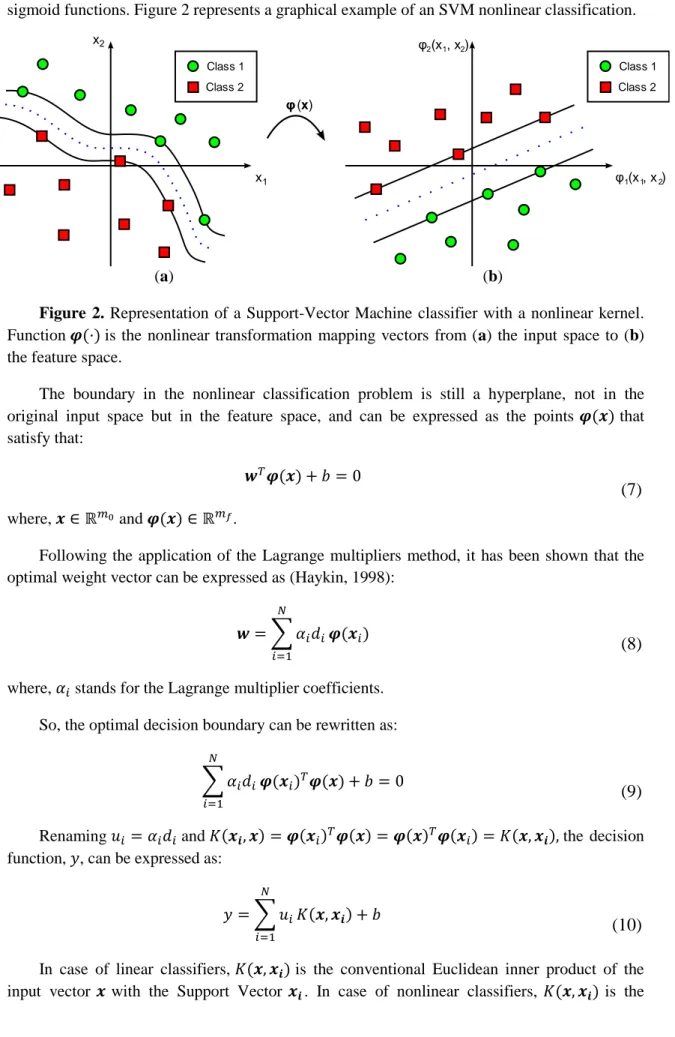
misclassification probability in the transformed feature space. The most typical transformation functions, as in the case of ANNs, are radial basis functions, higher-order polynomials, and sigmoid functions. Figure 2 represents a graphical example of an SVM nonlinear classification.
(a) (b)
Figure 2. Representation of a Support-Vector Machine classifier with a nonlinear kernel. Function is the nonlinear transformation mapping vectors from (a) the input space to (b) the feature space.
The boundary in the nonlinear classification problem is still a hyperplane, not in the original input space but in the feature space, and can be expressed as the points that satisfy that:
(7)
where, and .Following the application of the Lagrange multipliers method, it has been shown that the optimal weight vector can be expressed as (Haykin, 1998):
∑
(8)
where, stands for the Lagrange multiplier coefficients. So, the optimal decision boundary can be rewritten as:
∑
(9)
Renaming and the decision function, , can be expressed as:
∑
(10)
In case of linear classifiers, is the conventional Euclidean inner product of the input vector with the Support Vector . In case of nonlinear classifiers, is the
x
x
2
1 φ x( )
φ2(x1, x2)
φ1(x1, x2) Class 2
Class 1
10
conventional Euclidean inner product of the nonlinear transformation of the input vector with the nonlinear transformation of the Support Vector .
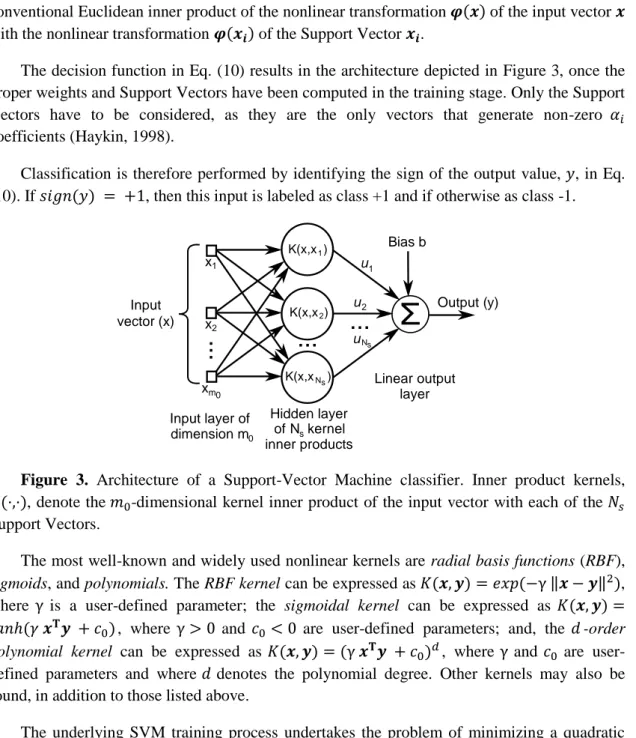
The decision function in Eq. (10) results in the architecture depicted in Figure 3, once the proper weights and Support Vectors have been computed in the training stage. Only the Support Vectors have to be considered, as they are the only vectors that generate non-zero coefficients (Haykin, 1998).
Classification is therefore performed by identifying the sign of the output value, , in Eq. (10). If , then this input is labeled as class +1 and if otherwise as class -1.
Figure 3. Architecture of a Support-Vector Machine classifier. Inner product kernels,
, denote the -dimensional kernel inner product of the input vector with each of the Support Vectors.
The most well-known and widely used nonlinear kernels are radial basis functions (RBF), sigmoids, and polynomials. The RBF kernel can be expressed as ‖ ‖ , where is a user-defined parameter; the sigmoidal kernel can be expressed as
, where and are user-defined parameters; and, the -order polynomial kernel can be expressed as , where and are user-defined parameters and where denotes the polynomial degree. Other kernels may also be found, in addition to those listed above.
The underlying SVM training process undertakes the problem of minimizing a quadratic functional subject to linear constraints. This problem, known as Quadratic Programming, has a closed solution. Although the solution can be analytically computed by applying the Lagrange multipliers method, other computational methods are typically used, especially when the dimensionality of the problem becomes high. Some of these methods include, among others, Interior Point methods (Ferris & Munson, 2006), the Sequential Minimal Optimization (SMO) algorithm (B. Schölkopf, C. J. C. Burges & A. J. Smola, Platt, 1998; Platt, Abril 1998), Incremental methods (Shilton, Palaniswami, Ralph, & Tsoi, 2005), and the Kernel-Adatron (KA) algorithm (Campbell & Cristianini, 1998). More information about the SVM training process has been gathered by Campbell and Ying (R. J. Brachman & T. Dietterich, Campbell & Ying, 2011).
Those readers eager to discover the rigorous mathematical statement and solution of the problem underlying Support Vector Machines are encouraged to read the comprehensive
Input vector (x) x1 x2 xm0
...
K(x,xNs) K(x,x2)
K(x,x1)
...
Bias b
Output ( )y
Linear output layer u1 u u 2
...
Hidden layer of kernelN inner productss Input layer ofdimension m0
2. Algorithms involved
introduction to SVM provided by Haykin (Haykin, 1998) or the in-depth work by Steinwart and Christmann (Steinwart & Christmann, 2008).
2.2.
Data fusion
2.2.1.
Kalman Filter (KF)
The Kalman filter (Kalman, 1960) is an efficient, recursive, mathematical algorithm that processes, at each step, inaccurate observation input data and generates a statistically optimal estimate of the subjacent real system state, by employing a prediction model and an observation model.
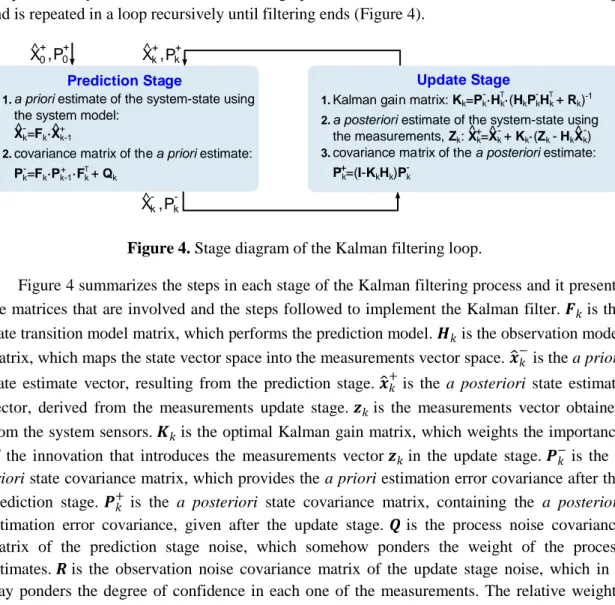
The basic functioning of the filter is conceptualized into two stages. The first stage is called the prediction stage, as it produces an a priori system state estimate from the previous state, by using a system evolution prediction model. The second stage, known as the update stage, takes into account measurements in the system to produce an a posteriori state estimate, by correcting the previous a priori estimate. This two-stage process starts with an initial estimated state, ̂ , and is repeated in a loop recursively until filtering ends (Figure 4).
Figure 4. Stage diagram of the Kalman filtering loop.
Figure 4 summarizes the steps in each stage of the Kalman filtering process and it presents the matrices that are involved and the steps followed to implement the Kalman filter. is the state transition model matrix, which performs the prediction model. is the observation model matrix, which maps the state vector space into the measurements vector space.
̂
is the a priori state estimate vector, resulting from the prediction stage.̂
is the a posteriori state estimate vector, derived from the measurements update stage. is the measurements vector obtained from the system sensors. is the optimal Kalman gain matrix, which weights the importance of the innovation that introduces the measurements vector in the update stage. is the a priori state covariance matrix, which provides the a priori estimation error covariance after the prediction stage. is the a posteriori state covariance matrix, containing the a posteriori estimation error covariance, given after the update stage. is the process noise covariance matrix of the prediction stage noise, which somehow ponders the weight of the process estimates. is the observation noise covariance matrix of the update stage noise, which in a way ponders the degree of confidence in each one of the measurements. The relative weights become greater as the covariance matrix elements become smaller, meaning that the quantities involved are increasingly reliable.a priori estimate of the system-state using the system model:
Xk=Fk·Xk-1
covariance matrix of the a priori estimate:
Pk=Fk·Pk-1·Fk + Qk ^- ^+ T - + 1. 2. Update Stage Prediction Stage
Kalman gain matrix: Kk=Pk·Hk·(HkPkHk + Rk)-1 a posteriori estimate of the system-state using the measurements, Zk: Xk=Xk + Kk·(Zk - HkXk)
covariance matrix of the a posteriori estimate:
Pk=( -I KkHk)Pk
+
1. 2.
-- T T
- ^ -^ ^ + -3. Xk ^
,Pk+ + Xk ^ ,Pk -X0 ^
12
2.2.2.
Extended Kalman Filter (EKF)
The extended Kalman filter (EKF) is a nonlinear version of the Kalman filter (KF), that is to say, linear relationships between quantities can become nonlinear. The following changes have to be applied to Figure 4 to generalized KF into EKF.
and , state transition and observation matrices, respectively, are replaced by and , nonlinear state transition and observation functions.
The a priori estimate (prediction stage) is computed now as:
̂ ̂
(11)
matrix is computed as the Jacobian matrix derived from .
| ̂
(12)
matrix is computed as the Jacobian matrix derived from .
| ̂
(13)
The a posteriori estimate (update stage) is computed now as:
̂ ̂ ( ̂ )
3. Motivation and hypothesis formulation
3.
Motivation and hypothesis formulation
The inception point of this thesis was the observation of the need for simpler mechanisms to enable less complex but still highly accurate machinery monitoring. Based on the state-of-the-art literature, signal processing techniques have traditionally fit very well to this aim and have shown promising results in the past few years.
From this observation, the following general research hypothesis was established: ―signal processing techniques applied to raw acquired signals coming from different sensors can let us gather useful information from agro-industrial machinery, thus enabling its accurate monitoring‖. Therefore, this information, that is somehow hidden otherwise, can be used for monitoring agro-industrial machinery.
This hypothesis is based on previous studies from the literature (Jardine, et al., 2006; Liakos, et al., 2018; Staszewski, 2002) and widely supported by the academic community.
The general research hypothesis can be divided into three sub-hypothesis, related to the three tackled agro-industrial problems and intimately related to the specific objectives intended to be reached in this thesis:
―Signal processing techniques enable effective predictive maintenance monitoring of agricultural machinery components based on the vibration signal acquired with an accelerometer‖.
―Signal processing techniques enable effective positioning data fusion for monitoring vehicles based on relative and absolute positioning sources‖.
4. Objectives
4.
Objectives
Developing, implementing, and assessing signal processing-based techniques for monitoring agricultural and industrial machinery based on raw data coming from different kinds of sensors is the main objective of this thesis. In addition, five particular sub-objectives have been posed for this thesis:
To design, implement, and evaluate signal processing techniques that enable the prediction of the status of the rotating components of machinery without removing and isolating them, using as an input the vibration signal acquired by an accelerometer.
Previous work had tackled monitoring and predictive maintenance of small components isolated (gears, engine, bearings, etc.). These components had to be extracted from the machine in order to analyze its operation. The objective of this thesis is to consider the whole machinery without needing to remove them from the machine they form part. Therefore, monitoring simplifies greatly.
To design, implement, and evaluate signal processing techniques that enable the prediction of the status of the rotating components of machinery while in normal operating conditions, using as an input the vibration signal acquired by an accelerometer.
Another objective of this thesis is to consider machinery working in normal operation too, in addition to machinery working at controlled conditions. This way, real-time monitoring can be performed without requiring performing any particular monitoring setup.
To design, implement, and evaluate signal processing techniques that enable monitoring flow rate from individual nozzles in agricultural sprayers, using as an input the acoustic signal acquired by a nearby microphone.
No previous work had been done before in this area. Other somewhat similar acoustic approaches had been used for pipes, taps, and faucets. The goal of this thesis is to focus on each individual nozzle to reach a flow rate measurement device that merely requires a microphone and signal processing.
To design, implement, and evaluate signal processing techniques that enable monitoring kinematic quantities for agro-industrial vehicles tracking, using data coming from several on-board sensors.
16
To design, implement, and evaluate signal processing techniques with good performance in terms of processing time and computational load in order to work in real time.
The developed methods in this thesis intend to reduce the amount of variables needed and try to avoid including complex processing algorithms.
To design machinery monitoring methods that are low-cost, in order to ease the widespread adoption by local farmers.
5. Methodology
5.
Methodology
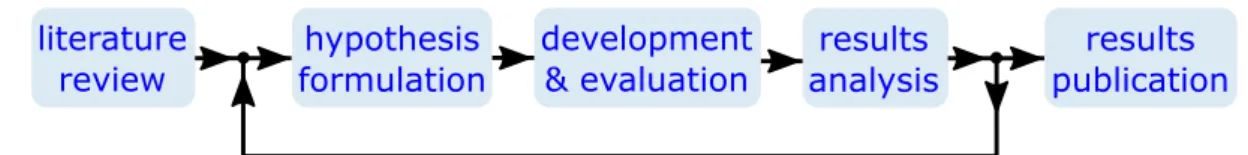
The following methodological steps were followed in this thesis in order to achieve the objectives explained in the previous section. The methodology was designed to match the objectives presented in the previous section. The proposed methodology is composed of five stages: literature review, hypothesis formulation, development and evaluation, result analysis, and results publication. The relationships among these stages are represented in Figure 5.
Figure 5. Block diagram of the methodological stages of this thesis and their relationships. The first stage of the methodology, namely literature review, involved the study of the state of the art. This stage was mandatory so as to gain the necessary knowledge to tackle the research in this thesis. This stage of the methodology encompasses both documentation about signal processing techniques as well as other published articles and previous work on the subject. The documentation about signal processing techniques focused on supervised learning, data fusion techniques, and the rest of employed signal processing techniques (filtering, data acquisition, mechanical vibration, etc.). For its part, documentation about previous studies related to the topic of this thesis included several sources, from literature review to discussions with knowledgeable experts.
The second stage of the methodology undertook the formulation of the research hypothesis. The research hypothesis formulation was done after the first stage using the acquired knowledge and after having identified the research question for this thesis. This hypothesis was refined several times and, after its final version was reached, allowed for the definition of the objectives in this thesis.
The third stage of the methodology consisted of the development and evaluation of the signal processing techniques proposed for accomplishing the intended goals. First, the particular signal processing models were designed for each problem, focusing on defining an adaptive approach that could be refined after it assessment when needed until successful results were achieved. Furthermore, in this stage, the experimental setups were defined and data acquisition was performed. The experimental setups, which were designed so as to enable proper data acquisition to guarantee meaningful data for the later stages, consisted on placing the sensors in appropriate locations for later data acquisition. It involved removing or controlling noise sources as well as a pre-analysis of the data to check its correctness. The data acquisition was undertaken after having properly deployed the experimental setup. The acquired data was subsequently used for analyzing the adequacy of the proposed models as well as for their validation.
18
research hypothesis formulated in stage number two. Whenever the results showed that the research hypothesis could be validated, publication of the obtained results followed (last stage of the methodology). In contrast, when the results showed that the research hypothesis should be reformulated, the methodology went back to the second stage in order to try to offer a new valid hypothesis.
6. Articles in the compendium and their relationship
6.
Articles in the compendium and their relationship
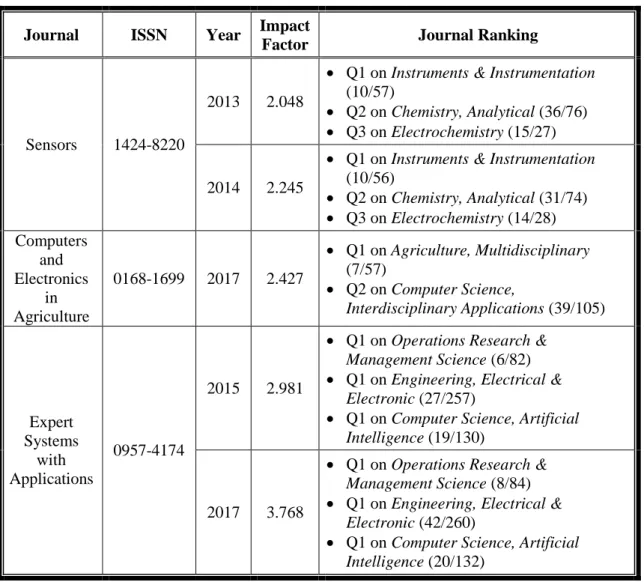
This thesis comprises three articles for compendium of publications; all of them published in JCR indexed journals belonging to first quartile (Q1) in their respective categories. Each of these articles will be respectively named hereinafter as:
Article 1. Predictive maintenance monitoring
Ruiz-Gonzalez, R.; Gomez-Gil, J.; Gomez-Gil, F.; Martínez-Martínez, V. (2014). An SVM-Based Classifier for Estimating the State of Various Rotating Components in Agro-Industrial Machinery with a Vibration Signal Acquired from a Single Point on the Machine Chassis. Sensors 14 (11): 20713-20735. Impact factor: 2.245 (Q1)
Article 2. Vehicle tracking monitoring
Melendez-Pastor, C.; Ruiz-Gonzalez, R.; Gomez-Gil, J. (2017). A data fusion system of GNSS data and on-vehicle sensors data for improving car positioning precision in urban environments. Expert Systems with Applications 80: 28-38. Impact factor: 3.768 (Q1)
Article 3. Flow rate monitoring
20
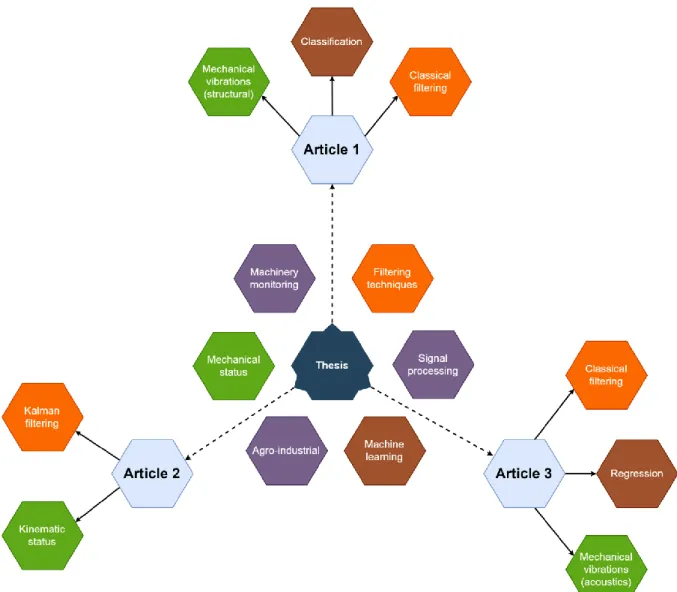
Figure 6. Relationship between three articles composing this thesis.
Figure 6 summarizes the relationship between the articles comprising this thesis. A further explanation is provided in the subsequent paragraphs.
All three articles comprising this thesis deal with three different agro-industrial monitoring problems by employing signal processing techniques. This section intends to further clarify the relationships among all of them as a unique topic.
All of the articles included for compendium undertake relevant problems within the agricultural and industrial areas. Since existing solutions are not fully satisfactory in terms of cost or accuracy, alternative approaches are posed in this thesis. The methods proposed in all three articles contribute by incorporating new knowledge into previous literature.
Moreover, all the approaches in this thesis rely on signal processing techniques to achieve the intended objectives. Both the first and third article use a common methodology to achieve the intended goals, based on similar filtering and classification schemes, while the second article employs a different approach, based on data fusion techniques.
6. Articles in the compendium and their relationship
of the agricultural harvester. The second article focuses on monitoring a general vehicle (which could be used for tractors, harvesters, cultivators, seeders, sprayers, etc.), by improving the estimation of its kinematic properties. The third article focuses on agricultural sprayers, by proposing a novel estimation method for flow rate on individual nozzles.
Moreover, the first and second articles propose two methods to monitor the mechanical and kinematic status of machinery, respectively. There exists an obvious relationship between the kinematics of the machinery and the rotation speed of certain components of the machinery. Therefore, estimation of both statuses is highly related and merging together the information from both methods could further improve the accuracies of both of them.
The first and third articles have a lot of similarities, as can be easily appreciated. They both work with mechanical vibrations, whether propagated along the chassis of the machinery or in the air. Moreover, the developed methods both deal with agricultural machinery components. In addition, the proposed preprocessing approach is quite analogous, mainly differing in the latest stages of the processing.
7. Results
7.
Results
The main results of this thesis are three signal processing methods presented in the three articles comprising the compendium of publications. Each of these methods undertakes a different agro-industrial problem.
In this thesis, the three agricultural and industrial problems considered for proposing solutions employing signal processing methods were: predictive maintenance of an agricultural machine, kinematic tracking of an agro-industrial vehicle, and flow rate estimation of an agricultural sprayer. The following paragraphs briefly detail each of these problems.
7.1.
Predictive maintenance monitoring
- Problem to be solved: Machinery rotating components generate mechanical vibration signals that propagate along the machinery structure. Therefore, the status of machinery components is expected to be estimable by acquiring from a single point of the machinery chassis. The status of several rotating components of an agricultural harvester machine was to be estimated by applying signal processing techniques to the vibration signal acquired by an accelerometer.
- Proposed solution: A signal processing approach, consisting of feature extraction and selection plus classification, was employed to predict the status of the rotating components. This method can be applied while in normal operating conditions, thus avoiding the disadvantages of other alternative techniques. This solution can accurately estimate the status of three rotating components of the machinery in real time.
24
Figure 7. Data acquisition setup for predictive maintenance monitoring. An accelerometer was placed on the structure of the machine, connected by means of a cable to an acquisition system, and a laptop was used to register and visualize the acquired data.
7.2.
Vehicle tracking monitoring
- Problem to be solved: Vehicle tracking suffers from inaccuracies when operating in environments with poor GNSS coverage. Therefore, incorporating other sources of positioning can considerably improve the accuracies achieved. Several techniques, incorporating relative positioning data, have been widely used in the literature when trying to improve accuracy in keeping track of vehicle’s kinematic information. This thesis dealt with data fusion of GNSS data with other sources of relative positioning data. In particular, this thesis copes with employing relative positioning data coming from on-vehicle sensors accessible via OBD-II standard communication.
- Proposed solution: A data fusion model, employing the extended Kalman filter (EKF), was proposed. Absolute positioning data, coming from GNSS receiver, was fused with relative positioning data, obtained via OBD-II from the on-vehicle sensors. Ackermann steering model was used for simplifying the underlying vehicle kinematics too.
7. Results
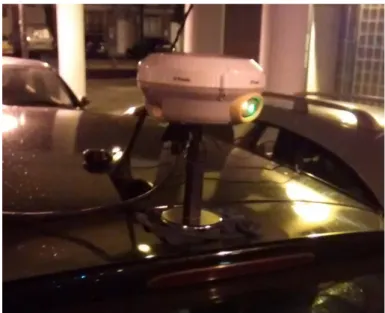
Figure 8 depicts the experimental setup employed to acquire the data acquisition related to this problem. Further details can be found in the original article (Melendez-Pastor, Ruiz-Gonzalez, & Gomez-Gil, 2017).
Figure 8. Data acquisition setup for vehicle tracking monitoring. An accurate GPS receiver, shown in foreground, was placed on top of the car to use as reference for comparison of the results coming from the data fusion approach.
7.3.
Flow rate monitoring
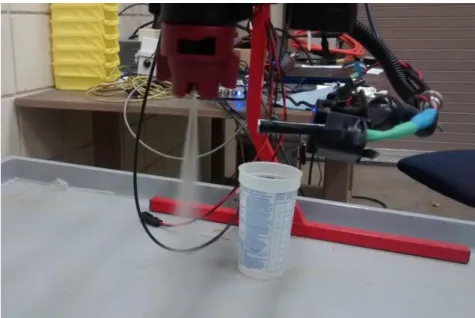
- Problem to be solved: Employing traditional flow rate measurement devices for each nozzle is quite expensive in an agricultural sprayer, and per-nozzle accurate measurements are mandatory when aiming at precision agriculture spraying. Based on the observation that the nearby acoustic signal varies as flow rate coming out of the nozzle does, an acoustics-based signal processing method seems to be useful to tackle this problem.
- Proposed solution: An acoustics-based signal processing method was developed in order to estimate flow rate through the nozzles. The method employed several stages including frequency domain analysis, in-band power calculation, normalization, and nonlinear regression.
- Original contributions: The proposed system was the first-ever method in the literature capable of accurately measuring flow rate in real-time in an agricultural sprayer by means of processing the acoustic signal acquired nearby. In addition, the proposed system is low-cost when compared to traditional flow rate measurement devices. Moreover, most suitable frequency bands were analyzed in the frequency domain as well as the influence of distance and quality of microphone device.
26
8. Conclusions
8.
Conclusions
The results derived from this thesis, summarized in the previous section and available as an annex in the following chapter, suggest the next conclusions. Two general conclusions are posed together with four particular conclusions, which are associated with the sub-objectives of this thesis.
The first general conclusion is that it is feasible to develop and implement signal processing-based techniques for monitoring agricultural and industrial machinery. This conclusion is supported by the results from all three articles composing this thesis by compendium. The work conducted in all three articles composing this thesis show that signal processing techniques enable feasible solutions for the undertaken problems in the agricultural and the industrial fields. It is expected that other particular problems, within the area of monitoring agricultural and industrial machinery, can also benefit from similar signal processing techniques.
The second general conclusion is that all proposed solutions tend to be more cost-effective, more accurate, and easier to deploy as compared to existing solutions. When compared to the literature, the proposals made in this thesis have a lower cost, achieve accuracies otherwise unreachable, and do not require complex procedures to deploy the associated system. The results from all three articles give evidence supporting this conclusion. All three methods proposed in this thesis employ low-cost sensors for its operation, as opposed to alternative systems, and only require cheap commodity computing platforms to work in real time. Further details are given in all three articles.
The third general conclusion is that all proposed solutions can operate in real time. Due to the processing optimization leading to low computational power requirements, all three methods proposed in this thesis could be deployed for real-time operation. Therefore, this enables effective machinery monitoring while it is being used instead of those alternative methods that just perform monitoring a posteriori. The advantage of that lies in the ability to detect improper statuses beforehand, just right after they happen. The results from all three articles give evidence supporting this conclusion.
The first particular conclusion is that signal processing techniques can be employed for monitoring machinery components, using as an input the vibration signal acquired by an accelerometer, without removing and isolating them, even while in normal operating conditions. The results from the first article of this compendium (predictive maintenance), provides proof of this. This conclusion can be further subdivided into the following conclusions:
28
Analyzing the individual cross-validation accuracy obtained for each rotating component, the suitability of the SVM classifier for estimating each separate machinery status is evident. On the one hand, the rotating component status with the best cross-validation accuracy was the engine speed, with a cross-validation accuracy of 100% in all cases. On the other hand, the worst cross-validation accuracy was obtained for threshing cylinder balance status, for which the cross-validation accuracy was between 63.41% and 87.49%. These values are perfectly valid for deploying a predictive maintenance system, since it can detect unbalances in certain components, thus alerting the operator of the machinery to perform some corrective maintenance on this component.
The vibration signal can be acquired with a uniaxial accelerometer, the orientation of which does not significantly affect the classification accuracy. The comparison of the results of cross-validation accuracy along the three accelerometer axes supports this conclusion. The higher differences observable for the threshing cylinder balance status shows differences of around 20%. However, almost no differences in accuracy were appreciated for the rest of the states, which were lower than 10% in all cases. Although vibrations are usually generated in a specific direction, the results obtained here suggest that the machine structure spreads them along all of the axes, making the use of an arbitrary axis for their detection possible.
The accelerometer sensor does not need to be placed very close to the rotating components, which makes the acquisition stage simple and non-intrusive. Previous work in the scientific literature has only analyzed isolated mechanical components, using one accelerometer for each isolated component.
The proposed approach, using feature extraction plus feature selection, only requires a maximum of seven features as input for the SVM classifier. This way, the subsequent classifier is simpler and more efficient than other existing alternatives requiring a much larger set of features.
No significant improvements are noted between the use of either nonlinear or linear kernels, when using an SVM classifier. For the undertaken problem, no significant improvements appeared when introducing more complex nonlinear kernels.
Real-time monitoring of the machinery can be performed thanks to the ability of the proposed system to operate in normal working conditions, i.e. while the harvester is working harvesting in the field.
The proposed method provides a low-cost way of estimating the status of the machinery, just requiring an accelerometer and low-cost computing platform in order to achieve high accuracies. The low cost of this method contrasts with existing alternative methods that require expensive transportation of the machinery to inspection facilities.
The second particular conclusion is that real-time monitoring of flow rate from individual nozzles in agricultural sprayers can be achieved by processing the acoustic signal in their surroundings. The results from the third article of this compendium (flow rate monitoring) are proof of this.
8. Conclusions
acoustic signal contains information related to the flow rate through the nozzle tip, and many processing techniques can be proposed for this end.
The proposed method can be used to estimate the flow rate of individual nozzles in a low-cost way with a high accuracy in a laboratory environment. The flow rate estimation accuracies obtained with the proposed acoustic method are close enough to some of the traditionally used flowmeters, whose relative RMSE errors can reach 4%.
The flow rate estimation becomes more difficult, i.e. the errors increase, for either very low or very high flow rates, when operating outside the flow range recommended by the nozzle manufacturer. One possible explanation for this behavior is the fact that the spray deposition pattern and output droplet size distribution of the nozzles changes appreciably outside of the manufacturer recommended range, which will consequently change the acoustic signature. The increased difficulty in estimation could also be due to the acoustic signals being more similar in these extreme cases. This effect is even more noticeable for low flow rates due to the inherently lower intensity of the nozzle-generated signal. This lower intensity leads to the acoustic noise floor being relatively stronger with respect to the signal of interest, thus making the estimation more difficult.
The proposed method can work in real time. When executed in post-processing in MATLAB®, it requires less than five seconds to process the 61-second-long recordings for 10 flow rates, where the reported times were obtained in a Dell Latitude E6400 laptop. This execution time, less than 0.01 seconds for each single epoch, shows the feasibility of performing all the necessary tasks between the acquisitions of two consecutive epochs, which is 0.5 seconds. It is worth remarking that no explicit code optimization was done and the computational efficiency of the method could be further improved for real-time operation.
Consistent results, with neither significant improvements nor detriments, can be obtained when using a high-end or a low-end microphone. The results prove that the high-end microphone does not outperform the low-end microphone. Furthermore, the measurements provided by both are coherent, since moderate (0.40–0.59), strong (0.60–0.79) or very strong (0.80–1.0) positive correlations were found. Additionally, the reported p-values from the Welch’s t-test showed no statistically significant differences between both microphones for two out of the three tested nozzles. The fact that the proposed method is highly independent of microphone quality makes it economically feasible to replicate flow sensors across a large boom with many nozzles.
The frequency band between 1450 Hz and 1950 Hz provided the best accuracies. Several bandwidths were tested, and a bandwidth of 500 Hz was found to be the best because it gave acceptable accuracies and was narrow enough to avoid excessive wideband interferences. Looking over the frequencies from 0 Hz to 50 kHz, the band from 1450 Hz to 1950 Hz contained more information than any other related to the flow rate.
30
The proposed method presents a low-cost design, requiring for its deployment only a low-end microphone and a microcontroller-based computing platform.
There is an oscillatory behavior in the estimated flow rates, which highlights the possibility of the integral errors in flow rate compensating over time. Thus, an even lower error can be achieved in terms of the cumulative volume applied to the whole plot of land that is being sprayed.
Each nozzle tip requires its own calibration since no singular curve could be fitted accurately for all nozzle tips.
These studies were conducted in a relatively controlled laboratory environment; thus, the reproducibility of these accuracies in real agricultural settings has yet to be verified.
The third particular conclusion is that kinematic monitoring of agro-industrial vehicles can be improved by using signal processing techniques for data fusion of GNSS and on-vehicle sensors data. The results from the second article of this compendium (vehicle tracking monitoring) support this conclusion with evidence.
On-vehicle sensors data can be employed through the proposed data fusion system for improving the car positioning precision provided by a standalone low-cost GNSS receiver. Positioning errors can be reduced by half in terms of the RMSE and the 95th-percentile of the distance error distribution, and up to one fourth in terms of the maximum distance error.
The best precision improvements are expected to be achieved in urban or forest areas, where tall buildings or trees hinder the effectiveness of GNSS systems. It is expected that the proposed system could be of great value in the event of short-term GNSS signal outages, which are prevalent in cities with tall buildings and skyscrapers or in forests-like environments. Wherever the GNSS receiver provides high accuracies, the proposed system becomes less effective. Thus, all scenarios where GNSS accuracies worsen can take more profit from the proposed system.
The proposed system requires less variables than other existing alternatives, thus being more efficient. Previously proposed approaches, also employing EKF, required several stages and intermediate variables, which yielded to much more complex systems, both in computational terms and as far as tuning of covariance matrices is involved.
The proposed system can be easily adapted to incorporate new variables and sensors, since the EKF allows for simple addition of new sensed variables into the model. Merely deriving the mathematical relationship between sensed variables and state variables is enough for system update as well as covariance matrices tuning too.
9. Future work
9.
Future work
In this thesis several solutions were satisfactorily proposed for three particular agro-industrial problems. All along the research performed in this thesis, several lines of future work appeared.
The following future work lines, among others, have been identified.
Related to the predictive maintenance monitoring: A currently live project is working on replacing feature extraction stage by a frequency selection approach, so as to identify most suitable frequencies and trying to relate them to rotating speed with the help of an expert person. Another future line could be working on continuous estimation of the speed of the rotating components by processing the vibration signal, enabling real-time monitoring of the speed of certain rotating components. In addition, diagnostics and prognostics, in the sense of estimating the level of damage and predicting its future evolution, could be tackled too.
Related to the vehicle tracking monitoring: The employed data fusion approach did not consider dynamic tuning of the covariance matrices. Since sensor accuracy varies, especially for GNSS receivers as coverage improves or worsens, a modified method, which relies more or less on each sensor based on their accuracy at each time instant, could outperform the proposed approach.
Related to the flow rate monitoring: Since the experiments in this thesis were conducted on a well-controlled laboratory environment, where acoustic interferences and noises were avoided, testability on a real environment would be necessary. It is expected that, as a result, a new refined approach becomes necessary after that testing in the real field. An exhaustive study about optimal microphone location could be another possible line of future research. Another line of research could further delve into acoustics generation in agricultural sprayer nozzles, probably using Computational Fluid Dynamics (CFD) for simulations.
In addition to those particular lines of future work, a more general line of research could focus on how to properly incorporate all the systems proposed in this thesis into a whole system, which could lead to complete systems of great usefulness in precision agriculture tasks. For example, by employing accurate kinematic data together with accurate flow rate measurements, a very accurate control of chemicals spraying could be achieved.