Modelling the interoperability and the use of
control equipment in an electrical substation
Gregorio Romero, Jesús Félez, Ma Luisa Martínez and Joaquín Maroto
Universidad Politécnica de Madrid
Spain
1. Introduction
Simulators can be defined as information systems which reliably reproduce specific phenomena and they are mainly used in training, although their field of application has grown to include manufacturing and medicine among others.
In electrical engineering, simulation is an indispensable tool when working with complex systems due to the fact that it enables engineers to understand how systems work without actually needing to see them. They can learn how they work in different circumstances and optimize their design with considerably less cost in terms of time and money than if they had to carry out tests on a physical system. By using computer simulation, not only can an electrical system be designed, but it can also be optimized and its behaviour examined in depth more quickly and cheaply than by using prototypes, tests or analytical studies. Therefore, by being able to see the responses produced as the different parameters are varied, a much deeper understanding of the system under study is reached.
In order to properly simúlate a virtual world, technologies such as realistic graphics and dynamic simulation with real-time calculations must be used. Peripherals must be used for the system to interact with the user and the immersion comes as a result of stimuli to sight, hearing and touch. A critical factor is the possibility to solve the equations in real-time; that is, there should be no delay compared to the normal environment's response. There is an important amount of effort being directed towards these objectives.
This paragraphs deals with the development of an operation simulator for training and the fundamental objective is to develop a simulator for electrical substations. It will present the methodology to model, simúlate and optimize the interoperability and the use of control equipment in electrical an substation to train operators by means of a virtual reality environment.
to be modelled in a way that is both intuitive and cióse to reality. Firstly, this part of the chapter develops the simulation models of different elements that characterise an electrical substation in isolation, such as sources, loads, switches and transformer. Later they are put together to model the full system and finally the system thus developed is compared with the one developed in a specific electrical simulation program working with different manoeuvres to validate it. Section 4 built the previous modules into a larger and more complex computer system composed of the actual substation control system, the Geographical Information System, which defines the topology of the network, and the functional system which simulates the electrical behaviour of the substation. One of the advantages of doing this is that the final application can automatically update in the virtual environment any changes to the substation's design and it allows access from this environment to information on every component. In Section 5, the visuals, the Communications manager and the behaviour modules of the substation are implemented by using distributed interactive simulation in a hardware configuration and it has the same interface as that used in the control system of the real substation. In this way, the system developed can be integrated into a replica of the complete power supply network control system emulating a real substation, it being able to fully interact with the global system, and allow totally real situations to be simulated. Section 6 gives conclusions of this chapter.
2. Objectives
An electrical substation (fig. 1) is a subsidiary station of an electricity generation, transmission and distribution system where voltage is transformed from high to low or the reverse using transformers. Electric power may flow through several substations between generating plant and consumer, and may be changed in voltage in several steps.
Figure 1. Real electrical substation
In order to properly simúlate a virtual worid, technologies such as realistic graphics and dynamic simulation with real-time calculations must be used (Vince, 1995). Peripherals must be used for the system to interact with the user and the immersion comes as a result of stimuli to sight, hearing and touch (Miller et al., 1998). It is possible, therefore, to produce immersion in the system by providing visual, tactile and acoustic feedback to the user. One of the most common applications of virtual reality lies in simulator development.
Simulators can be defined as information systems which reliably reproduce specific phenomena (Houghton, 1989), (Farrington et al., 1994). The first simulators were mainly used in training (Bayarri et al., 1996), although their field of application grew to include manufacturing (Singh et al., 1996) and medicine (Schroer et al., 1996) among others.
An additional issue, also related to computing performance, is dynamic simulation. The idea is to reproduce the actual physical behaviour by applying the equations governing the simulated system (Weghorst, 1998). A critical factor is the possibility to solve the equations in real-time, that is, there should be no delay compared to the normal environment's response. There is an important amount of effort being directed to these objectives (García de Jalón & Bayo, 1993).
The fundamental objective is to develop a simulator for operations at electrical substations.
2.1 Features
Such as appear in the previous lines, the fundamental objective is to develop an operation simulator for training at electrical substations. Aimed at giving the simulator the highest possible degree of realism, it must be equipped with the following features:
• To be able to closely represent an electrical substation. This implies designing 3D geometrical models of all the elements which make up the substation.
• To be interactive. Communication between the Information System and the users must adopt as real a form as possible. Interactivity is obtained by the system responding through the peripherals to user-initiated events.
• To be immersive. For the user to feel he or she is inside the virtual environment, visual and acoustic feedback must be provided through the hardware (helmet with tracking system and sound), with the objects of the environment presented in 3D stereoscopic display.
• The system must replicate, as closely as possible, the actual functioning of the installation. To obtain it, the functioning logic of the installation must be coded into the system, so that objects react to user input with the appropriate movement and behavior. Furthermore, all objects must strictly adhere to the physical laws governing their behavior; in this case, the laws of movement affecting simultaneously 3D objects and the physical principies of electricity which, logically, define the behaviour of an electrical substation.
• To be integrated into a network, so that it becomes a multi-user system where múltiple users can simultaneously input into the same virtual environment, following defined behavioural rules.
3. Modelling of installations
3.1 Three-dimensional geometrical models
Simultaneously to the development of the software application, the 3D geometrical models needed by the VR application can be constructed (fig. 2). These models are based on existing drawings, on paper or in digital format, and on actual pictures. The geometric models needs to be optimized to a high level of realism by optimizing the mesh size, using LOD (Level Of Detail) objects, and applying textures.
t.
(a) (b)
Figure 2. Electric 3D models. (a) Thriphasic disconnector. (b) Monophase pantograph.
The models can be constructed using commercial 3D software, so that the system imports popular or standard commercial formats such as AutoCAD, 3Dstudio, Proengineer, Multigen,
IGES, DXF, or VRML. This will make maintenance by the technical department of the
company where the application will be installed much easier.
Figure 3. 3D Geometry and textures of the full electrical substation's model.
so that identical geometrical models (Le., high voltage towers) need not be duplicated. This means a reduction in the resources necessary to store the substation, in download time from the network, and in processing power to render the substation in real time. Excessive detail in the geometrical modelling means an increase in the time needed to render it, so that it can become impossible to offer real time experiencing. The rendering must be optimized by applying textures to the 3D model. This greatly simplifies the rendering without loosing realism (fig. 3).
3.2 Laws of electrical behavior
When it comes to analyzing a three-phase electrical circuit, which is what we are dealing with, it may be assumed that the three phases are balanced and therefore behave similarly. For this reason, when simulating an electrical substation, it is possible to work with the single-line circuit of one of the phases where the line and the different elements to be taken into account can be more easily analyzed.
Figure 4 shows a typical single-line substation circuit diagram where two active input positions can be seen (lines ' L l ' and 'L2') and two output positions (lines 'L3' and 'L4'). Additionally, there is one input and two output positions in reserve.
This diagram shows how the two input positions are connected to a common busbar and the two output positions terminate in another busbar, also common to both of them. This leads to the different input or output branches being placed in parallel and the power transformer being situated between both parts.
y
©
*v &/* r T
i 0 ¡r
¡TV
J ÍL.r
r T
Figure 4. Sinele-line electrical diagram of a substation
©
r
An alternative methodology to can simúlate an electrical substation is the Bond Graph technique. The Bond Graph technique enables systems belonging to the different áreas of physics to be modelled in a way that is both intuitive and cióse to reality (Karnopp et al., 1990). It is a perfect technique for representing elements belonging to the área dealt with in this paper and it's possible apply it in any program that permit the simulation of models based in this technique (Romero et al., 2008); in addition, no extraordinary knowledge of this technique and electric field are required to understand the process. There is a series of elements that are needed for this type of facility to opérate, which are described below.
3.2.1. Switches
In an electrical system actions need to be carried out to vary its layout or topology. Certain manoeuvres are simply necessary to connect or disconnect loads, others to interrupt the passage of current in the event of failure and others to earth some part of the system (Poyraz et a l , 1999).
An automatic switch can establish, support, and interrupt currents under normal circuit conditions, as well as establish, support for a determined period of time and interrupt currents under abnormal specified circuit conditions, such as a short-circuit. In a Bond-Graph, a resistance port placed in series (fig. 5) can be modelled with the rest of the circuit to which the valúes have to be introduced as a conditioned parameter. If the switch is closed, the resistance valué will be zero, while if it is open the valué is very high, preventing the passage of flow or current.
R( R 1 : S )
i
Figure 5. Modelling a switch by using the Bond-Graph technique.
3.2.2 Loads
Regarding load modelling, it must be borne in mind that in an electrical node, the current is divided by the cables connected to it, the voltage at all points of the contact being equal. This behaviour is obtained in a Bond Graph with type '0' nodes, where the (current) is equal to the sum of the output flows and the effort of the bonds it joins is the same, while with type ' 1 ' nodes the input current is equal to the output current less what is lost in the element, such as happens with elements in series.
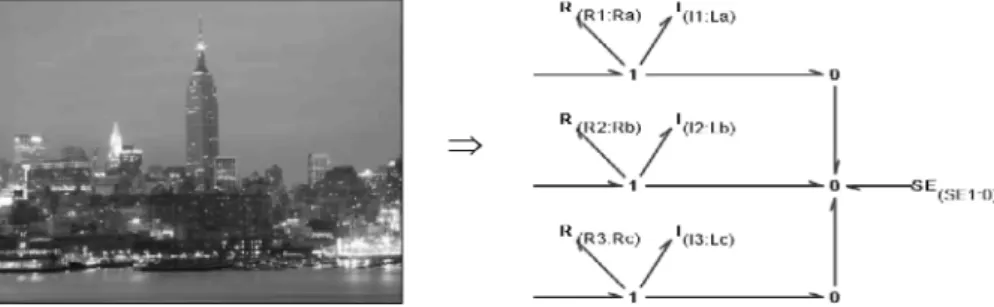
In three-phase systems (Bose, 2005), the loads can be connected either in a triangle or a star, and this in turn, to earth or insulated. In an insulated three-phase star load the resistance and inductance of each phase will be joined by a type ' 1 ' node, since the Bond Graph elements are in series, and subsequently the bonds of each of the three phases will be joined by a type '0' node, of common potential representing the neutral of the star. If the neutral is rigidly earthed, the bonds joining it will need to be set to zero potential. This can be achieved with a zero level effort source joined to the '0' node representing the neutral, as shown in figure 6.
R1:Ra) ¿ (ll:La)
7
(R2:ftb) y (i? ih>\
/
R 3 R t ) j (l3:Lc)
7
Figure 6. Model of a three-phase load in a star with rigid neutral to earth in Bond Graph.
3.2.3 Sources
As with the loads, the effort sources (voltage) represented by the Bond Graph technique are ideal sources and genérate a potential difference across the termináis that is constant and independent of the load. Unlike ideal sources the potential difference produced by real sources is dependant on the load to which they are connected. A real voltage source may be considered an ideal voltage source, 'U', in series with a resistance 'R', denominated internal resistance. In order to obtain real sources in a Bond-Graph, a resistance port needs to be added to act as an internal resistance using a node ' 1 ' , so that it will be in series.
(SE i;Ua) ?(R1 R»)
TT%LSák
(SE_0 Ub) . (R2:Rb)
(SI _ c lie) . ( R 3 : R c )
By joining the single-phase effort forces in an appropriate star or triangular layout, three-phase systems can be attained. In the case under study, three-three-phase, star voltage sources can be obtained by connecting the different effort sources in type ' 1 ' nodes, and subsequently, all of them in a type '0' node and a zero valué effort forcé that simulates the earth (fig. 7).
3.2.4 Transformer
The transformer comprises two primary and secondary coils and enables the electric power to be transformed, with specific magnitudes of voltage and intensity, into other usually different voltages. The electromagnetic part of a transformer comprises a magnetic nucleus and windings. The windings around the nucleus form the primary and secondary coils, with ' N I ' and 'N2' number of turns respectively. When an alternating current is applied to the primary, an alternating current flows through it, which, in turn, produces an alternating flow in the nucleus whose direction is determined by Ampere's law applied to this coil. Due to the periodical variation of this flow induced electromagnetic forces are created in the coils and this leads to a voltage in the termináis of the secondary coil whose ratio to the primary is V -transformation ratio -, and which valué is the relation between ' N I ' and 'N2'. As commented in previous paragraphs, this suggests using the transformer element in a Bond Graph to model an electrical transformer where the output flow is equal to the input flow multiplied by the ratio of the transformer V, and the output effort is the input effort divided by the ratio, the same as happens with intensities and voltages in an ideal transformer. However, real transformers have losses and therefore, the resistance of the coils and the dispersión flows need to be taken into account. This must be done with the ' R l ' and 'R2' resistances, for the primary and secondary coils, and with the 'XI' and 'X2' reactance. An approximate equivalent circuit (fig. 8) is usually worked with, which is obtained by grouping the impedances in series; in this way, the resistances and reactances of the short-circuit ('Xcc' and 'Rcc') can be obtained easily.
»,(",) -
T r rW . "~'
!"
:'-
;'
('
1:LCC)— ' — - ^M I I( T F 1 : r ) Figure 8. Modelling a real simplified single-phase transformer in Bond Graph.
In this work, a three-phase transformer will be formed by using a single magnetic nucleus incorporating all the windings required. It will comprise three equal columns on which the turns are rolled that make up the primary and secondary coils of each phase. Each column is considered as a single-phase transformer, so that the same analytical techniques as in the single-phase study can be applied.
ÍR1:Rcc) j - ( I I Lee)
<TF1:r)
ÍR2:Rce) ^ (12 Lee)
<TT2:r)
ÍR3:Rcc) v (13 Lee)
Figure 9. Model of a three-phase transformer 'Yy' by Bond Graph.
3.3 Full electrical substation's model
In order to proceed to the electrical substation simulation, it is necessary to draw a simplified three-phase diagram showing the different elements dealt with in the preceding paragraphs. The different Bond Graph models analyzed will have to be substituted in order to genérate a valid simulation model like the presented in figure 10.
(R!:Rla) 7(R4.R!sa> • '<H:Lla| 1
- ^ - 1 ~-a
(FÍV l i l h j , l l í í i fí ?stj) O * D ^ 1
-(R3:R1c> 7 (RGLRISCJ
SI"(SE3.Ulb> \ _¡,\l3.Llc) 1
(R7 R2n) " [R1&R2SS]
(R8:R2bJ "(Rll:R25t.)
O - - - 0 - - 1 •
-(SEG:U2a> A ^ (1R:L2bA
. !<•* i - . - . i í i - 1 y [<:•••.!•.
0 »1
-(SEÜ.O)
£,t(EC7:Lr2b> \ y- '<f6:L2«:A
— - - 1 - > 0
Figure 10. Model of an electrical substation in a Bond Graph.
3.4 Opening and closing maneuvers.
To be sure of the configuration of a typical substation it has been developed an example of electrical substation. In this sample, some apparent powers of 4 GVA and 5 GVA have been taken into account in the input positions respectively, and of 60 MVA and 90 MVA in the output positions; in the equations (1) to (4) the equivalent impedances and resistances has been obtained.
(220 kV)
Z = i ^ = 1 2 , 1 Q = > L =38,515 mH (withR =0,2 £2) 4 GVA
(220 kV)2
Z = i ^ = 9 , 6 8 Q = > L = 30,812 mH (with R =0,2 £2)
5 GVA (132 kV)2
Z, = i '- = 290,4 Q => L, = 402,921 mH.R, = 261,36 Q
(132 kV)
Z, = i ^ = 193,6Q => L = 268,611mff,R =174,24Q
(1)
(2)
(3)
(4)
To see how one position affects another, 4 seconds will be simulated bearing in mind that the line ' L l ' switches are open between t=0.3 sec. and t=l sec, and those of the 'L2' line between t=2.3 sec. and t=3 sec, while the remainder will be closed at all times. In order to validate this, the same exercise has been done with PSCAD © elements too.
yummvwm
E 3 Ifc L « VKW EJutó Wntav Help¡fe lv^ntn |"
'"•}J'i-.1-.,1L
-
-
-
-
-•g¡ • • • r ~ ! J : IÜ1 ™niB" l|¿, l
J n | x |
Srf^Tiri " tti 'r • FUTDCiLiní.HnF^ifi^vHl!
Figure 11. Scheme of an electrical substation drawn in PSCAD © software.
™ = —
„ - • " • •
OJO 0.10 •0.10
1
H
i
mpHHiii
lÉMIUJMIIBI
OJ 0 OiO 100 1=0 2fX> ¡ J O J-00 ¿ £ 0 * 0 0
« M
> r « u . » r E = : < t o . t a
***-*• I P
IhiNii
. « , ; , i » Ú ^ Ó »í .
=Tri s-O T SJo -jr-ap-it
« « . s i : » .
„ , " " •
ÉIIIIIIIII mi
J I H H H I U I I M
niHimii mi
IHNH
OJ» 0 3 0 1 J » 1 3 0 : j » 2 5 0 SOO i » 4 :
. . —ñ a u .
• I
III
MiRiiiipnilNi
1 » , j > s „ = a i » ¡ a —
í . "=••" ::,: :'"'
Figure 12. Electric simulation results (Intensity [A] vs time [sea]).
In this simulation the currents required for the 'L3' and 'L4' positions are 0.39 A and 0.55 A respectively when the four switches are closed. Regarding the supply from the power stations in the ' L l ' and 'L2' positions, 0.24 A and 0.32 A are supplied respectively, whose sum after applying the transformation ratio is the total current required of 0.94 A. On the other hand, when the ' L l ' position switch is opened, all the current must be supplied by the power station in position 'L2'. When it is closed again, in the transitory process it can be seen that the current in position 'L2' is the difference between that demanded by the load and that supplied by the power station in the other position.
Regarding the opening of the switch in position 'L3', it can be seen how the current demanded drops to 0.55 A.
Thus, the model developed for the simulation of an electrical substation using the Bond Graph technique may be considered as valid.
4. Implementation of the project
4.1 Additional applications
The relationship between the different modules of the simulator must be done in the Installations Datábase (BDI), which must be designed to maintain and look-up graphical and textual information on the installations and elements of the power supply and telecommunications networks.
The information stored in the BDI must be organized on different levéis (planning, study, development, operation) together with cartographic information.
The basic functionality of the BDI is as follows:
Queries: queries against graphical and textual information in the datábase. Maintenance: maintenance of the information in the datábase.
Map editing: generation of hard copy and on-screen maps.
Network analysis: queries based on the topological connections of the network.
The BDI must include the following data: a. Textual data:
• Every element must be uniquely identified through a code. • Identification and technical data of each installation. b. Graphical data:
• Cartographic datábase: Rural (communications, hydrographic information, limits, altitude, etc.) and urban (streets, sidewalks, blocks, etc.) maps.
• Detail maps: precise location of the network over a cartographic background. • Location maps: larger scale representation of the network's location over a
cartographic background.
• Schematic drawings: schematic drawings of manoeuvres at substations and transformation centres.
The information included in the BDI affords, through the topological connections of its Geografical Informations System (GIS), a full overview of the substations and transformation centres, their internal and external connections and their operational logic (fig. 13).
•
--áÉlÍI^Éf
W
f
.$\:Jj£
níái -" * "
"fl¡2
ff
.
.iK
?!
4
1 i
= - * * • i -^ r £• -i !£
. ^?
i
5" *
r
:> -:_ :> . , A1
1tt
'«"Ir
i.0
(a) (b) Figure 13. (a) Geographical datábase, (b) Schematic drawings of electrical systems
4.2 Technical basis of the application
To arrive at the functionality indicated in the section 2, several software tools will be used. The core of the application will consist of C/C++ code, which accesses the 'OpenSceneGraph' graphical libraries APIs (Yuan et al., 2007).
The realist aspect of the application allows the user to work with a physical mechanism within a virtual reality environment; that is, to interact with it through devices such as a mouse, stereoscopic glasses, HMDs or gloves.
Figure 14. Action sequence on the substation s elements.
Once the geometrical and operational data have been loaded, the virtual environment of the substation can be manipulated. Figure 14 shows the controls of one of the pantographs of the substation. When the button on the pantograph's control consolé is pressed, it moves from open (horizontal position) to closed (vertical position) or from closed to open.
(a) (b)
Figure 15. (a) Scene graph philosophy. (b) Scene graph structure of an electrical substation.
Depending on the element with which we interact, several different actions must be performed on the virtual substation. The substation is composed of static physical elements, such as transformers, control elements such as consoles, and assemblies with movement such as pantographs or switches.
• The most general action, which can be applied to every element, is navigation. This consists of interactively changing the viewpoint through the mouse. This is done through what in virtual reality terminology is know as a 'motion link' between the computer's input device and the camera's viewpoint. As the input sensor (the mouse, in this case) moves, the viewpoint of the scene changes interactively.
• Operation of mechanisms. There is also a module which performs the kinematic calculations corresponding to show the positions of the parts which make up a mechanism, such as the pantograph in figure 16.a, so that the moment the system drivers are operated (degrees of freedom) the model will produce a movement following preset kinematic constraints. In order to define the mechanism's kinematic behaviour, the system drivers (system input), as well as the kinematic joints making up the system's movement constraints, must be configured. The corresponding scene graph is shown in figure 16.a:
Figure 16. Scene graph. (a) Manoeuvring of the pantograph. (b) Manoeuvre constraints.
• The third type of action is modifying the electrical state: connected, disconnected, grounded, etc. This type of action may or may not be accompanied by a concrete physical movement, but must always be registered and taken into account. In the virtual environment it is indicated by a change in colour, for instance. In most cases, electrical manoeuvres of this type are subject to operational constraints; Le., you cannot ground a live element. These constraints are also shown in the scene graph, as in figure 16.b.
4.3 Integration of BDl and VR
- LEVEL 1 - Queries
The following types of queries are allowed:
• Queries, from the VR application, of textual data corresponding to the modeled elements. A 3D element is selected and the Datábase Query Application invoked with the identification code of the selected element. A screen is then displayed allowing standard operations of this application (navigating through the hierarchy of installations, locating the element, generating reports, etc.).
• Accessing the virtual model of a substation: a substation is displayed using the corresponding textual data contained in the BDI.
• Locating an element from the BDI: from the BDI, an element can be physically located within the substation.
- LEVEL II - Symbology / Behaviour
This level allows the user to define, based on specific textual attributes, the symbology a n d / o r dynamic behaviour of substation elements:
• Model: differentiate elements based on model or material.
• State: changing the appearance of an element, based on its state (open, closed). • Voltage: same as above, following a live/without voltage criteria.
5. Distributed Interactive Simulation
The last phase consists in implementing this system within a Distributed Interactive Simulation (DIS) environment. The objective is to develop a virtual reality system which meets the specifications of the previous phases, Le., integration in BDI, realistic behaviour laws, and which allows several users simultaneous access to the same installation from different workstations.
This application is based on an Object/Property/Event architecture, and offers the following functionality:
• Standard storage, manipulation and retrieval of objects from a shared datábase. • Creation of properties (such as the position of an object) that allow for easy storage of
user-defined data (for instance, movement coordinates when an object is moved). • Triggering of reactions to property changes. A property change is known as an event. • Property sharing, enabling multi-user simulations.
• The final objective of this phase has been the development of a client/server architecture which allows multi-user, simultaneous generation of interactive graphic simulations.
The software developed is made up of a set of interconnected applications. This solution presents greater scalability if a single application is used that simultaneously takes charge of the substation graphic display and the simulation of its logic and behaviour.
This scalability allows the implementation of a multiuser environment. Moreover, it gives independence in respect of the power of the computer where the program is being run, since processing can be distributed among different computers.
5.1 Visuals.
These are based on OpenSceneGraph and it gives great flexibility to the developed software, since it allows for a future migration towards operating systems that are different from Windows.
It must include its own programming language (macro language), which enables simple and efficient virtual environments to be generated along with their editing. This language not only allows objects to be inserted, but also contains a set of instructions that enables elements to be inserted, such as atmospheric effects, animated characters, etc.. Thanks to this functionality, the user can genérate a plain text file, which, together with the 3D geometries, allows any virtual scenario to be reproduced. It allows the loading of geometries generated by graphic design programs and has the capacity to reproduce large scale scenarios with the help of a dynamic load module.
5.2 Communications manager.
This allows the state of the actuators to be sent from the behaviour modules to the visuals, as well as the position and orientation of all the elements in the simulation. It also allows the states of the sensors to be sent from the visuals to the behaviour modules.
Its main functions are to interconnect all the applications that form part of the simulation and to manage all the communication flows. Its main feature is to allow the automatic configuration of all the Communications from a set of parameters supplied by the user of the software developed. These parameters will define both the policy and the features of these Communications. It is based on 'CORBA' (Diaz et al., 2007), which means that applications generated with different programming languages can be integrated.
The following problems have had to be resolved while developing the application:
• Access to variables. A variable cannot be both modified and read at the same moment in time by two threads that are trying to access it simultaneously. Error detection and management. The application must detect errors associated with Communications and rectify those capable of rectification.
• Thread management. The Communications manager must simultaneously manage data transmission to the display units together with their receipt by the simulators.. Since we are dealing with an application through which all the Communications pass, its code is highly optimized. Any loss of performance in the application will affect all the other applications it communicates with, transferring this low performance situation to them. Optimization has been carried out by a meticulous use of dynamic and fixed matrix lists, by minimizing the number of operations present in the algorithms, and selecting and compacting any áreas that need to be blocked in order to avoid their simultaneous use by more than one thread.
defined aimed at being implemented in simulators without the need to modify the different modules comprising the distributed architecture. Therefore, the programmer only has to develop the simulator or set of simulators making up this distributed environment.
Visual 1 Sound module
Figure 17. General architecture of the system.
Moreover, with the help of the interface, the user need only worry about simulating the behaviours, leaving aside managing Communications, detecting errors associated with such management, and developing a distributed architecture. The Communications manager takes control of all Communications by sending the necessary information to each module at an appropriate rate. To this end, each module carries out the following functions:
1. Starting up: the Communications manager assigns a single identifier to each module. 2. Synchronizing: The module clocks and the Manager become synchronized. To obtain
good synchronization a máximum error must be set in accordance with a sequence in which it send the information from each of the objects controlled every 'n milliseconds. Figure 17 shows the general architecture of the developed system.
5.3 Behavior modules;
A visual without a behaviour module allows a scenario to be reproduced at a particular instant. However, if it is wished to reflect the evolution of the environment according to time, and therefore represent the different states that the elements gradually acquire in that environment, a module entrusted to calcúlate this evolution is needed.
The programmable automation functions in such a way that the outputs depend on the instantaneous valué of the inputs. However, the evolution of logic functions of automatism require a specific calculation time. In order to ensure that the input valúes are not changed during this evaluation, synchronous processing modes are used that only take account of the inputs, and update the outputs in specific instants of time. Their functioning can be summed up as follows:
1. Start of cycle.
Storage of input valúes at a particular instant. Running the program; during the entire process, the valué of the inputs that is stored remains constant. Simultaneous updating of outputs.
2. End of cycle.
3. Repetition of the process.
The behaviour module, therefore, works as an automaton emulator in such a way that with some particular inputs some outputs are generated that are reflected in the environment. In order to genérate the variables making up the emulator's outputs, the figure of the sensor has been created inside the visuals, which takes charge of reading the valué of a particular property at the start of each automaton cycle.
The actuators have been created in the same way so that the environment can be acted on. These are elements that act on a particular property with the ability to change its valué. Both the actuators (behaviour module outputs) and the sensors (behaviour module inputs) are treated as binary-type variables, that is, their possible valúes are '0' or ' 1 ' . Described below are the sensors implemented, their main features and scope of use.
Types of sensors implemented:
• State: This controls whether a visual element is activated or not. It thus allows the user not only to know if a geometry is visible or not, but also if a light is 'on' or 'off, if a fog-type node is active, etc..
• Position: This informs if a node is in a position near the sensor. This check is made by means of ranging. Linear position: This detects if a node intersects with the imaginary segment, which, setting out from a point 'P' at the centre of a node, has the direction of a vector '(x,y,z)'. The size of the segment is a user-specified parameter. The most typical example of one would be a photoelectric cell.
• Switch: This behaves like a push-button, that is, it lets current pass only and exclusively during a cycle. At that instant its valué is true and then passes to false during the remaining instants even though the button continúes to be pressed.
• Button: While the button remains pressed, it lets the current pass taking the true valué, passing to false valué when the pressing finishes. Movement: This checks the different properties of a movement.
Types of actuators implemented:
• Node visibility control: this lets a node be activated or deactivated, thereby allowing the geometries to be visible or not. If it is a light-type, it switches it 'on' or 'off, and if a fog-type, it can make it act or not. Variation in the properties of a movement.
• Determining the state of a sound.
• Acting on a Switch element: this allows the child of a switch to be selected each time that it takes the true valué or rotate among the various children.
6. Conclusions
An application designed for training electrical substation operators by using a virtual reality application has been set out in this chapter.
The application allows full viewing of any of the substations in the power supply network, allowing navigation into the virtual world and interaction with the elements. Each of the substation components has been reproduced in the simulation model, including the behavior laws associated with it, so the complete functionality of the substation can be simulated. It may be said that the Bond Graph technique is a simple and effective mathematical modelling technique that lets the model be understood without losing the physical sense of each of its components, no matter how complex it may be. Its methodology unified for different physical domains enables the electrical part to be joined to other parts of the systems that appear in engineering, such as, mechanics or hydraulics, it being unnecessary to change the simulation environment or computer application when machines need to be joined to mechanical shafts, pumps or turbines,...
The virtual reality application has been implemented in such a way that the system developed can be integrated into a replica of the complete power supply network control system emulating a real substation, it being able to fully interact with the global system and allow totally real situations to be simulated.
There is no doubt that being able to simúlate expensive installations with virtual models which afford the same functionality is an extremely interesting possibility. This virtual reality application is a tool aimed at this interest.
In this complex issue, important technologies and methodologies, such as virtual reality, dynamic simulation, databases, GIS, computer networking, all join together to offer a real time solution.
7. Referen ees
Bayarri, S., Fernandez, M. & Pérez, M. (1996). "Virtual reality for driving simulation",
Communications of the ACM, Vol. 39, Iss. 5, pp. 72 - 76, ISSN 0001-0782, New York,
United States.
Bose, A. (2005). "Three-Phase Alternating Current Systems". The Electrical Engineering
Handbook, Elsevier Science & Technology, pp. 709-711, ISBN 0-12-170960-4.
Diaz, M, Garrido, D, & Troya, JM. (2007). "Development of distributed real-time simulators based on CORBA". Simulation Modelling Practíce and Theory, vol. 15, Iss. 6, pp. 716 -733, Elsevier B.V., ISSN 1569-190x.
Farrington, P. A., Schroer, B. }., Swain, J. J. & Feng, Y. (1994). "Simulators as a tool for rapid manufacturing simulation", Proceedíngs of the 26* Conference on Wínter Simulation, pp. 994 - 1000, ISBN 0-7803-2109-X, Orlando, Florida, United States.
García de Jalón, J. & Bayo, E. (1993). "Kinematic and Dynamic Simulation of Multíbody
Systems". Springer-Verlag, ISBN 0-387-94096-0, New York, United States.
Houghton, P. D. (1989). "SMAS: an expert system for configuring a research flight simulator", Proceedíngs of the 2nd International Conference on Industrial and Engineering
Applications of Artificial Intellígence and Expert Systems, Vol. 2 , pp. 601 - 609, ISBN
Karnopp, D.C., Margolis, D.L. & Rosenberg, R.C. (1990). "System Dynamics: a Unified
Approach". 2nd edition, Wiley Interscience, ISBN 0471621714, New York, United
States.
Miller, M. S., Clawson, D. M., Sebrechts, M. M., & Knott, B. A. (1998). "Interface design for inducing and assessing immersion in virtual reality", Proceedings of the CHI 98
Conference Summary on Human Factors in Computíng Systems, pp. 343 - 344, ISBN
1-58113-028-7, Los Angeles, California, United States.
Poyraz, M., Demir, Y., Gülten, A. & Koksal, M. (1999). "Analysis of switched systems using the Bond Graph methods". Journal of the Franklin Institute, Vol. 336, Iss. 3, pp. 379 -386, Elsevier, ISSN 0016-0032, Oxford, England.
Romero, G., Félez, }., Maroto, J. & Mera, J.M. (2008). "Simulation of an electrical substation using the Bond Graph technique". Proceedings of 10th International Conference on
Modelling and Simulation, pp. 584 - 589, ISBN 0-7695-3114-8, Cambridge, England.
Schroer, B. }., Farrington, P. A., Swain, J. J. & Utley, D. R. (1996). "A generic simulator for modeling manufacturing modules", Proceedings of the 28th Conference on Wínter
Simulation , pp. 1155 - 1160, ISBN 0-7803-3383-7, Coronado, California, United
States.
Singh, G, Feiner, S. K. & Thalmann, D. (1996). "Virtual reality: software and technology"
Communications of the ACM, Vol. 39, Iss. 5, pp. 35 - 36, ISSN 0001-0782, New York,
United States.
Vince, J. (1995). "Virtual Reality Systems". Addisson Wesley, ISBN 0-201-87687-6.
Weghorst, S. (1998). "Virtual reality applications in health care", Proceedings of the CHI 98
Conference Summary on Human Factors in Computíng Systems, pp. 375, ISBN
1-58113-028-7, Los Angeles, California, United States.
Yuan, P, Wang, SJ, Zhang, JW, & Liu, HG. (2007). "Virtual reality platform based on open sourced graphics toolkit OpenSceneGraph". Proceedings of the 10th International
Conference on Computer-Aíded Design and Computer Graphics, pp. 361-364, ISBN


![Figure 12. Electric simulation results (Intensity [A] vs time [sea]).](https://thumb-us.123doks.com/thumbv2/123dok_es/6829694.835884/11.722.114.608.103.364/figure-electric-simulation-results-intensity-vs-time.webp)


