www.biogeosciences.net/7/43/2010/
© Author(s) 2010. This work is distributed under the Creative Commons Attribution 3.0 License.
Biogeosciences
Regional and seasonal patterns of litterfall in tropical South
America
J. Chave1, D. Navarrete2,3, S. Almeida4, E. ´Alvarez3, L. E. O. C. Arag˜ao5, D. Bonal6, P. Chˆatelet7, J. E. Silva-Espejo8, J.-Y. Goret6, P. von Hildebrand2, E. Jim´enez3, S. Pati ˜no3, M. C. Pe ˜nuela3, O. L. Phillips9, P. Stevenson10, and Y. Malhi5 1Laboratoire Evolution et Diversit´e Biologique, UMR 5174 CNRS/UPS, Toulouse, France
2Fundaci´on Puerto Rastrojo, Bogot´a, Colombia
3Grupo de Estudio de Ecosistemas Terrestres Tropicales, Universidad Nacional de Colombia, Leticia, Colombia 4Museu Paraense Emilio Goeldi, 66077-530 Belem, Brazil
5Environmental Change Institute, School of Geography and the Environment, University of Oxford, South Parks Road, Oxford OX1 3QY, UK
6INRA, UMR Ecologie des Forˆets de Guyane, BP 709, 97387 Kourou Cedex, French Guiana 7CNRS-Guyane, Station d’Etude des Nouragues, UPS 2561, French Guiana
8Universidad San Antonio Abad, Cusco, Per´u
9Earth and Biosphere Institute, School of Geography, University of Leeds, Leeds LS2 9JT, UK 10Universidad de los Andes, Bogot´a, Colombia
Received: 16 December 2008 – Published in Biogeosciences Discuss.: 27 July 2009 Revised: 4 December 2009 – Accepted: 4 December 2009 – Published: 5 January 2010
Abstract. The production of aboveground soft tissue repre-sents an important share of total net primary production in tropical rain forests. Here we draw from a large number of published and unpublished datasets (n=81 sites) to assess the determinants of litterfall variation across South Ameri-can tropical forests. We show that across old-growth trop-ical rainforests, litterfall averages 8.61±1.91 Mg ha−1yr−1 (mean±standard deviation, in dry mass units). Secondary forests have a lower annual litterfall than old-growth trop-ical forests with a mean of 8.01±3.41 Mg ha−1yr−1. An-nual litterfall shows no significant variation with total anAn-nual rainfall, either globally or within forest types. It does not vary consistently with soil type, except in the poorest soils (white sand soils), where litterfall is significantly lower than in other soil types (5.42±1.91 Mg ha−1yr−1). We also study the determinants of litterfall seasonality, and find that it does not depend on annual rainfall or on soil type. However, lit-terfall seasonality is significantly positively correlated with rainfall seasonality. Finally, we assess how much carbon is stored in reproductive organs relative to photosynthetic or-gans. Mean leaf fall is 5.74±1.83 Mg ha−1yr−1 (71% of
Correspondence to: J. Chave ([email protected])
total litterfall). Mean allocation into reproductive organs is 0.69±0.40 Mg ha−1yr−1(9% of total litterfall). The invest-ment into reproductive organs divided by leaf litterfall in-creases with soil fertility, suggesting that on poor soils, the allocation to photosynthetic organs is prioritized over that to reproduction. Finally, we discuss the ecological and biogeo-chemical implications of these results.
1 Introduction
In one of the most thorough recent reappraisals of tropi-cal forest NPP quantification, Clark et al. (2001) compiled data from 39 tropical forest sites and they estimated total tropical forest NPP. Their estimates ranged between 3.1 and 21.7 Mg ha−1yr−1, of which, 1.8 to 12.0 Mg ha−1yr−1were allocated into soft tissues (leaves, reproductive organs and twigs). Tropical forest NPP was found to be poorly corre-lated with mean annual temperature and with annual rain-fall (see also Schuur, 2003; Del Grosso et al., 2008). In a previous contribution, Malhi et al. (2004) explored the re-gional variation of the fraction of carbon fixed aboveground into woody parts in tropical South America (trunks and branches, wNPP). They focused on 104 permanent sampling plots where trunk diameter had been measured several times, and estimated the annual amount of carbon fixed into wood. Their major finding was that wNPP varied dramatically at the regional scale, and that a large part of this regional variation was due to soil type. Using the data available at 10 tropical forest sites in Amazonia, Arag˜ao et al. (2009) showed that total NPP ranged between 18.6 and 34.0 Mg ha−1yr−1, with a mean of 25.6 Mg ha−1yr−1, much greater than recent re-gional tropical forest estimates (e.g. Luyssaert et al., 2007; Del Grosso et al., 2008).
Clark et al. (2001) also suggested that NPP was not strongly correlated with total litterfall, as had been previ-ously suggested by Bray and Gorham’s (1964) global model. They however acknowledged that their estimates were based on an indirect estimation of several key components of NPP. For Amazonian forests, Arag˜ao et al. (2009) provide a most useful perspective on this question. Their analysis strongly supports Bray and Gorham’s (1964) model: total NPP is con-sistently close to 3.1 times total litterfall. If their finding is general, this is a strong motivation for summarizing our cur-rent knowledge on the regional and temporal variation of to-tal litterfall in the Amazon.
In the present contribution, we focus on the amount of carbon fixed into organs with short residence time, such as leaves, reproductive organs (flowers, fruits), and small branches. Like in most previous analyses, we assume that the ecosystem is at equilibrium, that is, the flux of carbon into this pool of carbon equals the flux of carbon outside of this flux. Then, the amount of NPP allocated annually to leaves, reproductive organs, and small branches should be equal to the annual litterfall. Leaf production and other com-ponents of litterfall should depend upon a large suite of envi-ronmental and geographical factors. In tropical South Amer-ica, the determinants of this spatial variation remain poorly studied, and it is impossible to get even a superficial sense of the changes in litterfall production across environments and across regions. The goal of the present manuscript is to re-view the recent literature and explore whether available data are sufficient to draw general rules for the spatial variation of litterfall across South America.
We here bring together a large number of published and unpublished litterfall datasets, including a wide range of environmental conditions, such as terra firme rainforests, flooded rainforests, dry forests, and montane forests. We also partition litterfall into its main three components (leaves, fruits and flowers, and twigs, see Proctor, 1983). We use this dataset to assess what determines the spatial and temporal variability in litterfall. Specifically, we address the follow-ing questions: (1) Is annual litterfall determined by edaphic or climatic factors? (2) Is the seasonality of litterfall deter-mined by edaphic or climatic factors?, and (3) Does plant investment into photosynthetic organs and reproductive or-gans depend on environmental factors? Finally, we discuss the implications of our findings.
2 Methods
2.1 Dataset
We combed the literature for publications reporting figures on litterfall in tropical South America. In our analysis, we in-cluded the studies in central Panama, but not those of the rest of Central America. We also included a number of unpub-lished data. For each study, we reported the different parts of litterfall, including leaves, branches (usually less than 2 cm in diameter), flowers, fruits, and others, if available (Proc-tor, 1983). Litterfall was collected in litter-traps set up ca. 1–2 m above the ground to avoid disturbance by large mam-mals. We recorded the duration of the experiment, number of traps, and size of the traps. All litterfall figures (annual and monthly) were converted into Mg ha−1yr−1of dry biomass. We did not correct these figures for a possible loss to her-bivory between censuses (Leigh, 1999; Clark et al., 2001), because this would have entailed making additional uncon-trolled assumptions. Our litterfall estimates did not incorpo-rate coarse woody debris, which may account for a sizeable fraction of carbon loss from the live vegetation (Chambers et al., 2001; Nepstad et al., 2002). In most cases, these esti-mates did not incorporate palm leaves which tend to be too large to be trapped by litter-traps, and the fruits and leaves produced by understory plants. This may result in a signifi-cant under-estimation of litterfall. For instance, in a wet rain forest of Costa Rica, over 10% of the total leaf area was be-low 2 m above ground (Clark et al., 2008).
T able 1. Description of the stud y sites. F o r each site, the full site name, country , con v entional site code and geographical coordina tes (long.-lat., in de g rees) are repor ted. En vironmental v ariables include a general descriptor of forest type (LO W : short-statured tropical forest, MON: montane tropical forest, SE C: secondary tropical forest, OG: old-gro wth tropical forest, FLO: partially floo ded tropical forests), dominant soil group (W orld Reference Base Soil T axonomy System), the C:N ratio in lea v es, annual rainf all (in mm/yr), and the rainf all seasonality inde x SR (in %). The ne xt column report annual litterf all (Mg ha − 1yr − 1) , the litterf all seasonality inde x SL, annual leaf fall (in Mg ha − 1yr − 1) , allocation into reproducti v e or g ans (fruits and flo wers, in Mg ha − 1yr − 1) , and the ratio of reproducti v e litterf all and leaf fall (inde x RL in %). The sampling strate gy includes the duration of litterf all sampling (in yr), the dates at which litterf all w as monitored, the size of litterf all traps (in m 2) , and the av ailability of monthly data (Y for yes, N for no). Finally , the reference from which these data were extracted is reported. The C:N ratio w as obtained from Fyllas et al. (2009) for the follo wing sites: A GP1, A GP2, T AM5 , T AM6, and T AP1. Site name C ountry Site code long. lat. F orest type Dominant soil group C:N Rainf all SR T otal litter -fall SL Leaf litter -fall Reprod litter -fall RL
Monitoring dura- tion
Interv al # traps T rap size monthly data Reference Amacayacu E C olombia A GP1 − 70.3 − 3.72 OG Plinthosol 21.8 2888 0.13 7.90 0.02 6.45 0.39 0.060 2.0 2004– 2006 25 0.5 Y This study Amacayacu U Co lombia A GP2 − 70.3 − 3.72 OG Plinthosol 23.8 2888 0.13 7.23 0.05 5.78 0.63 0.109 2.0 2004– 2006 25 0.5 Y This study Apia ´u, Roraima Brazil APR − 61.3 2.57 OG Acrisol 29.88 1902 0.47 9.17 0.08 5.57 0.28 0 .050 1.0 1988– 1989 6 1 Y Barbosa and Fearnside (1996) poachers1 P anam ´a BCI1 − 79.8 9.28 OG Acrisol 2617 0.34 11.29 7.53 0.76 0 .101 5.0 1988– 1992 15 0.25 N Leigh (1999) poachers2 P anam ´a BCI2 − 79.8 9.28 OG Acrisol 2617 0.34 12.13 7.69 1.63 0 .212 5.0 1988– 1992 15 0.25 N Leigh (1999) poachers3 P anam ´a BCI3 − 79.8 9.28 OG Acrisol 2617 0.34 12.02 7.14 1.02 0 .143 5.0 1988– 1992 15 0.25 N Leigh (1999) poachers4 P anam ´a BCI4 − 79.8 9.28 OG Acrisol 2617 0.34 11.16 6.87 1.02 0 .148 4.0 1988– 1991 15 0.25 N Leigh (1999) BDFFP Reserv e Brazil BDF1 − 60 − 2.5 OG Ferralsol 32.19 2470 0.32 8.82 6.63 0.60 0.090 3.0 1999– 2002 140 0.25 N V asconcelos and Luizao (2004) BDFFP Reserv e Brazil BDF2 − 60 − 2.5 SEC Ferralsol 32.03 2470 0.32 9.5 7.05 0.63 0.089 3.0 1999– 2002 140 0.25 N V asconcelos and Luizao (2004) Dimona frag-ment BDFFP Brazil BDF3 − 60 − 2.5 OG Ferralsol 25.57 2470 0.32 7.21 0.15 3.0 1990– 1994 18 1 Y Sizer et al. (2000) Capitao P aco, P ar ´a Brazil CAP1 − 47.2 − 1.73 OG Ferralsol 31.46 2471 0.49 8.04 0.11 1.0 1979– 1980 16 1 Y Dantas and Phillipson (1989) Capitao P aco, P ar ´a Brazil CAP2 − 47.2 − 1.73 SEC Ferralsol 29.80 2471 0.49 5.04 0.16 1.0 1979– 1980 16 1 Y Dantas and Phillipson (1989) Cardoso Island Br azil CAR1 − 48 − 25.1 OG 2225 0.27 6.31 4.42 0.8 0.181 1.0 1990– 1991 30 0.25 Y Moraes et al.(1999) Cardoso Island resting a Brazil CAR2 − 48 − 25.1 LO W Arenosol 2225 0.27 3.92 2.92 0.25 0.086 1.0 1990– 1991 30 0.25 Y Moraes et al. (1999) Caxiuan ˜a to wer Brazil CAX1 − 51.5 − 1.72 OG Ferralsol 2489 0.42 7.79 0.23 5.65 0.94 0.166 2.0 2005– 2006 25 0.25 Y This study Caxiuan ˜a terra preta Brazil CAX2 − 51.5 − 1.72 OG Anthrosol 2489 0.42 9.17 0.31 6.85 1.20 0.175 2.0 2005– 2006 25 0.25 Y This study
Chiribiquete, Tepuy
Colombia CHI1 − 72.4 0.07 LO W Leptosol 1996 0.13 4.17 0.28 3.29 0.30 0. 091 3.0 1999– 2002 24 0.5 Y This study Chiribiquete, TF Alta Colombia CHI2 − 72.4 0.07 OG Cambisol 1996 0.16 6.67 0.23 4.70 0.84 0. 179 3.0 1999– 2002 24 0.5 Y This study Chiribiquete, TF Baja Colombia CHI3 − 72.4 0.07 OG Acrisol 1996 0.16 8.45 0.14 6.11 0.82 0. 134 3.0 1999– 2002 24 0.5 Y This study Chiribiquete, Rebalse Colombia CHI4 − 72.4 0.07 FLO Gle ysol 1996 0.16 8.39 0.08 5.83 0.94 0. 161 2.0 2004– 2006 25 0.5 Y This study
Cordillera Central 2550
m a.s.l. Colombia COC1 − 75 5 MON Cambisol 38.63 2763 0.04 7.03 0.01 4.61 0.66 0.1 43 1.0 1986– 1987 10 0.25 Y V eneklaas (1991)
Cordillera Central 3370
T
able
1.
Continued. Sitename
Cou ntry Site code long. lat. F orest type Dominant soil group C:N Rainf all SR T otal litter -fall SL Leaf litter -fall Reprod litter -fall RL
Monitoring dura- tion
Interv al # traps T rap size monthly data Reference Nouragues Petit Plateau French Guiana NOR1 − 52.7 4.08 OG Ferralsol/leptosol association 25.4 3476 0.29 8.23 0.24 5.94 0.67 0.113 7.0 2001– 2008 15 0.5 Y T his study Nouragues Grand Plateau French Guiana NOR2 − 52.7 4.08 OG Ferralsol 21.6 3476 0.29 10.05 0.23 6.75 0.82 0.1 21 7.0 2001– 2008 25 0.5 Y T his study No v a Xa-v antina cer -radao Brazil NXA1 − 52.3 − 14.7 LO W Ferralsol 1501 0.55 1.046 0.27 0.49 0.17 0 .347 1.0 2002– 2003 10 1 Y Silv a et al. (2007) No v a Xa-v antina cerrado Brazil NXA2 − 52.3 − 14.7 LO W Ferralsol 1501 0.55 0.62 0.41 0.27 0.24 0 .889 1.0 2002– 2003 20 1 Y Silv a et al. (2007) P aracou Fren ch Guiana P AR − 52.54 5.16 OG Acrisol 3041 0.34 8.30 0.11 4.20 0.55 0.1 31 5.0 2003– 2008 40 0.45 Y This study Podocarpus National P ark Ecuador PNP1 − 79.1 − 3.97 MON Cambisol 1084 0.10 13.26 8.62 1.0 2001– 2002 12 0.16 N R ¨oderstein et al. (2005) Podocarpus National P ark Ecuador PNP2 − 79.1 − 3.97 MON Cambisol 1084 0.10 6.66 4.33 1.0 2001– 2002 12 0.16 N R ¨oderstein et al. (2005) Podocarpus National P ark Ecuador PNP3 − 79.1 − 3.97 MON Cambisol 1084 0.10 4.05 2.63 1.0 2001– 2002 12 0.16 N R ¨oderstein et al. (2005) P
anama Transect
P anam ´a PR T1 − 80 8 OG Acrisol 46.88 1620 0.36 12.47 9.47 0.94 0.0 99 1.0 2001– 2002 10 0.25 N Santiago et al. (2005) P
anama Transect
P anam ´a PR T2 − 80 8 OG Acrisol 33.58 1620 0.39 10.03 6.33 1.40 0.2 21 1.0 2001– 2002 10 0.25 N Santiago et al. (2005) P
anama Transect
P anam ´a PR T3 − 79.5 8 OG Histosol 39.82 1756 0.36 10.51 6.45 1.79 0.2 78 1.0 2001– 2002 10 0.25 N Santiago et al. (2005) P
anama Transect
To evaluate the seasonality of litterfall, we created a database including the monthly litterfall data as reported in the published reports or in unpublished datasets. In a number of cases, these figures were reported in the form of figures. We scanned the figures, and retrieved the original data by digitizing the figure manually using the software DigitizeIt, version 1.5.8 (http://www.digitizeit.de/).
2.2 Environmental variables
Environmental variables included in the present analysis are soil type (see also Malhi et al., 2004), and rainfall data. Soil type, when available, was deduced from the publica-tions, and mostly based on the World Reference Base Soil Taxonomy (WRB, 2006). More details on the distribution, area, and chemical properties of these soils type in Ama-zonia are available in Quesada (2009, see also Quesada et al., 2009). We classified the sites into four main soil cate-gories, roughly increasing in soil fertility (concentration of phosphorus and of exchangeable cations in the soil, Quesada et al., 2009): A) highly permeable infertile soils (arenosols and podzols); B) relatively infertile ancient soils (ferrasols); C) relatively fertile acidic soils (acrisols, plinthosols and al-isols) and D) fertile young or wet soils (cambisols, leptosols, histosols, gleysols or fluvisols). The one site with human-derived soil (archeo-anthrosol, CAX2 site: terra preta) was excluded from this classification.
When possible, we also reported the concentration of ni-trogen in litterfall (N, P). The carbon to nini-trogen ratio (C:N ratio) measure the depletion of nitrogen in plants. This value is correlated with the resource availability of the soil on which the plants grow (McGroddy et al., 2004; ˚Agren, 2008; Quesada, 2009). If only data on N concentrations were avail-able in live leaves (see e.g. Fyllas et al., 2009), we made use of these figures instead to compute the C:N ratio. We did not have enough values of phosphorus concentration in the litter to measure the N:P ratio, and estimating the litter P concen-tration from green leaf P concenconcen-tration is difficult, because P is massively retranslocated before leaf abscission (Chuyong et al., 2000). H¨attenschwiler et al. (2008) show that there is no correlation between green leaf N:P and litter N:P.
Rainfall was derived from a climatic dataset that covers the period 1960–1998, obtained by interpolating among local meteorological stations, and correcting apparently erroneous data (New et al., 1999). This dataset reproduces well the observed gradients in rainfall over the Amazon. For a few sites with steep climatic gradients near the Andes or close to the oceans, local meteorological data were preferred.
We also classified the data by forest type. The major-ity (n=51) was old-growth tropical rain forest (OG), but we also included a number of secondary (i.e. recently dis-turbed) rain forests (SEC, n=7), periodically or perma-nently flooded rainforest (FLO,n=10), montane rainforests (MON,n=5), and low vegetation (LOW,n=7). This last category is a composite of different vegetation types,
includ-ing low vegetation growinclud-ing on Colombian tepuis (Chiribi-quete National Park), woodland savannas in Brazil and Colombia (cerrado), coastal oceanic vegetation in Brazil (restinga), and stunted forest in Venezuela (caatinga). 2.3 Statistical analyses
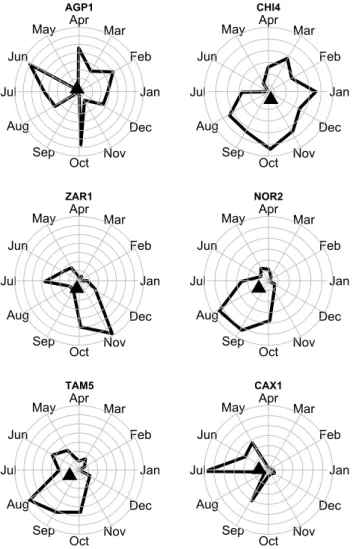
We computed an index of seasonality as follows. We con-verted the month into a number from 0 (1 January) to 330 (1 December). This represents the number of days elapsed since the beginning of the year but also an angle in degrees. We used this convention to represent the data using a polar plot (Fig. 1), where the litterfall of monthiare plotted using a vector starting from (0,0), with a length equal to the litterfall at monthi(in Mg ha−1yr−1)and the angle equal to 30*i(in degrees). The mean vector is obtained from the average of the projections along the x and the y axes. A similar analysis was performed to study the patterns of phenology across two seasonal rainforests (Zimmerman et al., 2007). The mathe-matical definition of the mean vector,m= mx,my
, from the 12 monthly litterfall vectorsLiis:
mx=
1 12
11
X
i=0
Licos(30×i), my=
1 12
11
X
i=0
Lisin(30×i) (1)
Here, Li =Li
is the absolute value of litterfall (in
Mg ha−1yr−1)for monthi. Using these definition, annual litterfall isL=P11
i=0Li/12. We finally define the seasonal-ity index as follows
SL=kmk
L (2)
This index measures whether litterfall is evenly distributed throughout the year, in which case SL≈0. Alternatively, if litter falls only during one month, then SL≈1. Figure 1 rep-resents polar plots with monthly litterfall data and the loca-tion of the mean vector, m= mx,my
for six of our study sites.
We also computed the seasonality in rainfall, based on monthly rainfall data, and called this parameter SR. Specifi-cally, we defined SR as
SR=kmrk
R (3)
Wheremr= mrx,mry, denotes the monthly rainfall vector
defined like in Eq. (1) by
mrx=
11
X
i=0
Ricos(30×i), mry=
11
X
i=0
Risin(30×i) (4)
Here, Ri is the monthly rainfall for month i measured in mm/mo. Then, annual rainfall is R=P11
i=0Ri, a variable that appears in Eq. (3).
AGP1
Jan Feb Mar Apr May Jun
Jul
Aug Sep
Oct Nov
Dec
CHI4
Jan Feb Mar Apr May Jun
Jul
Aug Sep
Oct Nov
Dec
ZAR1
Jan Feb Mar Apr May Jun
Jul
Aug Sep
Oct Nov
Dec
NOR2
Jan Feb Mar Apr May Jun
Jul
Aug Sep
Oct Nov
Dec
TAM5
Jan Feb Mar Apr May Jun
Jul
Aug Sep
Oct Nov
Dec
CAX1
Jan Feb Mar Apr May Jun
Jul
Aug Sep
Oct Nov
Dec
Fig. 1. Seasonality patterns for total litterfall at six sites (for site
names, see Table 1). Thick lines delineate the envelope of monthly litterfall. The sites are ranked by increasing seasonality from left to right and top to bottom. Seasonality was measured using the equations reported in the Methods.
Hence a RL of 1 corresponds to an equal allocation into leaves and into reproductive organs. This excludes all non-photosynthetic organs which make up non-reproductive lit-terfall (twigs and trash) and provides a firm baseline for com-parison across sites.
3 Results
3.1 Determinants of annual litterfall
In old-growth tropical rainforests, which cover the vast majority of the area under study, litterfall av-eraged 8.61±1.91 Mg ha−1yr−1 (n=52, range: 5.19– 12.47 Mg/ha/yr). We assessed Proctor’s (1983) claim that one year of litterfall collection was enough to capture this variable. Of the 24 sites for which we had 2 years of data
LOW MON SEC OG FLO
2 4 6 8 10 12 14
Forest type
Litterfall (Mg ha y
r )
-1
-1
Fig. 2. Total annual litterfall in different forest types. LOW:
short-statured tropical forests (see Methods for a description), MON: montane tropical forests, SEC: secondary tropical forests, OG: old-growth tropical forests, FLO: partially flooded tropical forests. For each forest type, the thick horizontal lines represents the mean, the box represents the standard deviations (possibly asymmetrical), and the dotted line represents the 95% confidence intervals. Two out-liers were detected, both above 12 Mg ha−1yr−1(dots).
or more, mean interannual variability was found to be equal to 9.3% of the mean (range: 2%–20%). Hence, one year of litterfall collection captures the long trend of litterfall within 10%.
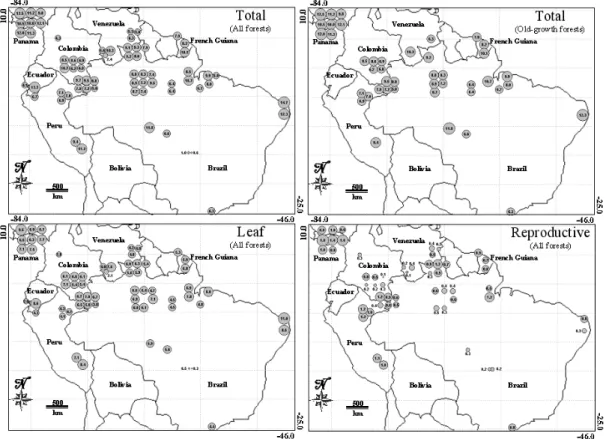
Annual litterfall was higher in flooded forests than in old-growth tropical forests (Fig. 2), with a mean of 8.89±1.42 Mg ha−1yr−1 (n = 10, range: 6.6– 11.21 Mg ha−1yr−1). Secondary forests had lower annual litterfall than old-growth tropical forests with a mean of 8.01±3.41 Mg ha−1yr−1 (n=10, range: 5.01– 14.74 Mg ha−1yr−1). The outlying secondary forest (14.74 Mg ha−1yr−1) was at the edge of the Mata de Piedade site, Atlantic rain forest of Brazil. Montane forests and low forests had lower mean annual litterfall (7.06±3.72 Mg ha−1yr−1 and 3.01±1.67 Mg ha−1yr−1, respectively). Figure 3 shows the regional variation of litterfall across all the dataset (panel a) and restricted to old-growth forests (panel b).
Fig. 3. Regional variation in litterfall. Variation in total litterfall across the sites (a), only in old-growth forests (b), variation in leaf fall (c)
and variation in allocation into reproductive organs (d). All figures are in Mg ha−1yr−1.
● ●
● ●
● ● ● ●
●
● ●
● ● ●
●
● ●
● ● ●
●
● ●
● ● ●
● ●
● ●
● ●
● ● ●
● ● ●
●
●
● ●
●
●
● ●
● ● ● ●
● ●
1000 1500 2000 2500 3000 3500
2 4 6 8 10 12 14
Rainfall (mm yr )
Litterfall (Mg ha y
r )
-1
-1
-1
Fig. 4. Total annual litterfall versus annual rainfall for four lowland
forest types. The four forest types are: old-growth tropical forests (black dots), flooded tropical forests (blue squares), secondary trop-ical forests (green triangles), and short-statured troptrop-ical forests (red diamonds). The dashed lines represent the least-square regression of total annual litterfall versus annual rainfall at the four forest sites. None of these regressions were significant.
A B C D
2 4 6 8 10 12
Soil type
Litterfall (Mg ha y
r )
-1
-1
20
30
40
50
60
2
4
6
8
10
12
14
C:N
Litterfall (Mg ha y
r )
-1
-1
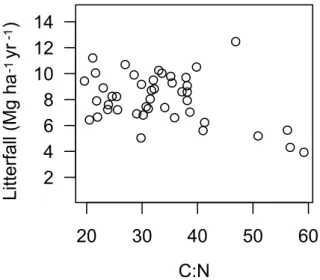
Fig. 6. Total annual litterfall versus C:N ratio. The correlation is
not significant (Kendall rank test: p-value=0.16).
We limited our analysis of annual litterfall versus soil type to old-growth moist lowland rainforests (Fig. 5). The poor soils are found in group A (including white sand soils), and litterfall was significantly lower than in other soil types (5.27±1.86 Mg ha−1yr−1,n=6). Ferralsols (group B) also supported a forest producing less litterfall annually (7.13±2.53 Mg ha−1yr−1,n=26).
A similar analysis was performed by using the Redfield ratio C:N rather than soil types as independent variables ( ˚Agren, 2008). Nitrogen-deprived plants have a large C:N ratio. Litterfall was found to decline albeit not significantly with C:N across the entire dataset (Fig. 6, Kendall rank test p=0.16,n=44).
3.2 Determinants of litterfall seasonality
Across all plots, the litterfall seasonality index SL, computed from 47 datasets, was of 0.166, indicating a mild seasonality of litterfall.
Litterfall seasonality was highest in small-statured forest sites (LOW), and lowest in montane and flooded forest sites (respectively MON and FLO, see Fig. 7). Litterfall seasonal-ity did not depend on annual rainfall either across all datasets, or across old-growth forest sites only (in both cases,p >0.4, results not shown). Litterfall seasonality did not depend on soil type either.
Next we explored whether litterfall seasonality SL was re-lated with the rainfall seasonality index SR (see the Methods section). We found a significantly positive relationship be-tween litterfall seasonality and rainfall seasonality across all plots (p=0.02,n=47, Fig. 8). This result also held when the analysis was restricted to old-growth forests (p=0.05, n=27).
●
● ●
●
1LOW 2MON 3SEC 4OG 5FLO
0.0 0.1 0.2 0.3 0.4
Forest type
Litterfall seasonality
Fig. 7. Litterfall seasonality index SL (see Methods) in different
forest types. The notations are the same as in Fig. 2.
0.1 0.2 0.3 0.4 0.5
0.0 0.1 0.2 0.3 0.4
Rainfall seasonality
Litterfall seasonality
●
●
●
● ●
● ● ●
●
●
● ● ●
● ●
●
●
● ●
●
●
●
●
● ●
● ●
●
● ●
Fig. 8. Litterfall seasonality index SL versus rainfall seasonality
index SR. The dashed line represents a regression across all points (r2=0.10,p=0.02). Color codes show forest types as in Fig. 4.
3.3 Carbon allocation in fast turnover plant organs
Next we computed the RL ratio for our sites (investment into reproductive organs divided by leaf litterfall). Across sites, this ratio ranged between 0.008 and 0.89 and was 0.135±0.119 on average (note that a ratio of 1 corresponds to an equal allocation into leaves and into reproductive organs). We did not find significant differences in the RL among forest types, except secondary forests where RL was significantly smaller (0.07±0.018).
The RL ratio varied across soil types. It was small-est on group-A soils (RL=0.081±0.036, n=5), in acidic group-C soils (RL=0.11±0.06, n=22), in group-B ferral-sols (RL=0.17±0.21n=16), and finally in richer group-D soils (0.18±0.07,n=11). Given that frugivore activity also correlates positively with nutrients, the actual RL ratios prob-ably increase more steeply than this with soil nutrients. This suggests that plants growing on rich soils invest proportion-ally more into reproduction than into photosynthesis. 4 Discussion
Assuming that litterfall biomass contains 47% of carbon (cross-site mean taken from Fyllas et al., 2009), the total an-nual litterfall corresponds to a mean of 8.0 Mg ha−1yr−1in old-growth tropical forests. This is in line with previous es-timates of Amazon-wide allocation of carbon into the fast turnover carbon pool (Clark et al., 2001). If the overall fig-ure of NPP around 25.6 Mg ha−1yr−1 is valid for Amazo-nian forests (Arag˜ao et al., 2009), then, about a third of total NPP is invested into leaves, twigs and reproductive organs. The largest fraction of soft tissue allocation is invested into photosynthesis (ca. 71%). Another 9% is invested into re-production. Following Clark et al. (2001), we reemphasize that the estimates of litterfall reported here do not include large branches. Other methods may be used to assess how much carbon is released by branch falls, and this flux ranges between 0.8 and 3.6 Mg ha−1yr−1 (Chambers et al., 2001; Nepstad et al., 2002).
Most of the NPP eventually contributing to fine litterfall is allocated to leaves. Because leaf fall was estimated around 5.6 Mg ha−1yr−1 in the field, the stocks of photosyntheti-cally active material available in the ecosystem may be esti-mated through two independent methods. First, the stock of leaves at any one time fB is related to fNPP through the mean lifetime of leaves, denoted byτ:τ=f B/fNPP. This param-eterτ can be estimated directly for selected species, and it varies between 6 months for secondary moist tropical forests (n=20, Coley, 1988), and 25 months for old-growth tropi-cal forests on poor soils (n=23, Reich et al., 2004). Taking an average value ofτ=1 yr, the stock of leaf biomass is es-timated at 2.8 MgC ha−1, or 280 gC m−2. Alternatively, as-suming that the leaf area index of Amazonian forests is close to 5.4 m2/m2(Malhi et al., 2009; Pati˜no et al., unpublished data; it may reach up to 7 m2/m2, see Clark et al., 2008), and that mean leaf-mass area (LMA) is around 47 gC m−2 (cross-site mean taken from Fyllas et al., 2009), then leaf biomass
should be 254 gC m−2. These two estimates tightly bracket the leaf biomass stocks in tropical rain forests. They also provide a consistency check for some of the lesser known variables in Amazonian rainforests (mean leaf lifetime and leaf area index).
Secondary forests showed a peculiar signal compared with old-growth forests. Although the total annual litterfall was comparable between secondary forests and old-growth forests, the former were less seasonal, and they invested less in reproduction than in photosynthesis. Since secondary tropical forests are likely to cover an ever larger area than today, and will remain in secondary status for a long time (Chazdon, 2003; Feldpausch et al., 2005, 2007), it is critical to account for this in global carbon cycle models.
There was a positive correlation between total litterfall and soil richness. This pattern may be underestimated in our analysis because herbivory is more active in the most fer-tile forests (Gentry and Emmons, 1987). Litterfall is already highest in forests growing on fertile soils (Fig. 5), and the amount of missed litterfall is difficult to quantify. Also, in many Amazonian forests, palms are an important fraction of the flora, and these palms also contribute to number of bias to litterfall as estimated by litter traps. Large palms tend to trap litter in their crown hence reducing the amount of litter falling to the ground (Alvarez-S´anchez and Guevara, 1999). Furthermore, many palm species have big leaves that tend to be discarded in litter trap measurements, since they are considered as coarse debris. These effects add up in western Amazonian forests, and it would therefore be im-portant to develop different methods for litter collection in these forests. Then the positive relationship between litter-fall and soil richness (see Fig. 5) may be linear rather than curvilinear.
Finally, our results shed light on carbon allocation strate-gies of tropical trees. We have shown that in poor soils, and especially in phosphorus-deprived environments, forests as a whole tend to invest less into the construction of repro-ductive organs relative to photosynthesis. This suggests that allocation into leaves (hence photosynthesis) is the priority for plants, but when resources are well supplied the excess in resources is made available for reproduction. Also, the plants of poor-soil communities seem to converge toward a low growth rate, low mortality rate and infrequent repro-duction, a classic example of habitat filtering (Weiher and Keddy, 1999). The pattern we uncovered should however be considered critically. Tropical forest reproduction is often characterized by infrequent events of mast-flowering, hence the RL ratio should show a high interannual variability. For instance, at the Nouragues site, one of the dominant tree fam-ilies, the Chrysobalanaceae has a mast-fruiting strategy, and these species have only fruited once between 2001 and 2008 (Norden et al., 2007). Hence, it would be essential to rely on long-term monitoring programs to accurately measure RL. Finally, fruit production is clearly underestimated in palm-rich forests of western Amazon. More refined tests of this hypothesis should be based on more thorough and appropri-ate measurements of resources available to plants.
Acknowledgements. Some of the unpublished datasets were
funded through the European Union funded PAN-AMAZONIA programme, a UK Natural Environment Research Council (NERC) grant (NER/A/S/2003/00608/2) to Y. Malhi, and continuous funding by the French CNRS (in part through the Amazonie program). We thank Angela Rozas D´avila, Judith Huam´an Ovalle, Marlene Mamani Sol´orzano, Silverio Tera-Akami, Alfredo An-doke, Jos´e Agust´ın L´opez, Germ´an Mej´ıa, Eugenio S´anchez, Arcesio Pijachi and Hern´an Machoa for their help in the field, and Carlos A. Quesada and Jon Lloyd for their help with the soil classification at our sites, and for useful comments on this manuscript.
Edited by: J. Lloyd
References
˚
Agren, G. I.: Stoichiometry and nutrition of plant growth in natural communities, Ann. Rev. Ecol. Evol. Syst., 39, 153–170, 2008. Alvarez-S´anchez, J. and Guevara, S.: Litter interception on
As-trocaryum mexicanum Lieb. (Palmae) in a tropical rain forest,
Biotropica, 31, 89–92, 1999
Arag˜ao, L. E. O. C., Malhi, Y., Metcalfe, D. B., Silva-Espejo, J. E., Jim´enez, E., Navarrete, D., Almeida, S., Costa, A. C. L., Salinas, N., Phillips, O. L., Anderson, L. O., Alvarez, E., Baker, T. R., Goncalvez, P. H., Huam´an-Ovalle, J., Mamani-Sol´orzano, M., Meir, P., Monteagudo, A., Pati˜no, S., Pe˜/uela, M. C., Prieto, A., Quesada, C. A., Rozas-D´avila, A., Rudas, A., Silva Jr., J. A., and V´asquez, R.: Above- and below-ground net primary productivity across ten Amazonian forests on contrasting soils, Biogeosciences, 6, 2759–2778, 2009, http://www.biogeosciences.net/6/2759/2009/.
Barbosa, R. A. and Fearnside, P. M.: Carbon and nutrient flows in an Amazonian forest: Fine litter production and composition at Apiau, Roraima, Brazil. Trop. Ecol., 37, 115–125, 1998. Barlow, J., Gardner, T. A., Ferreira, L. V., and Peres, C. A.:
Lit-ter fall and decomposition in primary, secondary and plantation forests in the Brazilian Amazon, Forest Ecol. Manage., 247, 91– 97, 2007.
Brando, P. M., Nepstad, D. C., Davidson, E. A., Trumbore, S. E., Ray, D., and Camargo, P.: Drought effects on litterfall, wood production and belowground carbon cycling in an Amazonian forest: result of a throughfall reduction experiment, Philos. T. Roy. Soc. B, 363, 1839–1848, 2008.
Bray, J. R. and Gorham, E.: Litter production in forests of the world, Adv. Ecol. Res., 2, 101–157, 1964.
Chambers, J. Q., dos Santos, J., Ribeiro, R. J., and Higuchi, N.: Tree damage, allometric relationships, and above-ground net primary production in central Amazon forest, Forest Ecol. Manage., 152, 73–84, 2001.
Chazdon, R. L.: Tropical forest recovery: legacies of human impact and natural disturbances, Persp. Plant Ecol. Evol. Syst., 6, 51–71, 2003.
Chuyong, G. B., Newbery, D. M., and Songwe, N. C.: Litter nutri-ents and retranslocation in a central African rain forest dominated by ectomycorrhizal trees, New Phytol., 148, 493–510, 2000. Clark, D. A., Brown, S., Kicklighter, D. W., Chambers, J. Q.,
Thom-linson, J. R., Ni, J., and Holland, E. A.: Net primary production in tropical forests: an evaluation and synthesis of existing field data, Ecol. Appl., 11, 371–384, 2001.
Clark, D. B., Olivas, P. C., Oberbauer, S. F., Clark, D. A., and Ryan, M. G.: First direct landscape-scale measurement of tropical rain forest Leaf Area Index, a key driver of global primary productiv-ity, Ecol. Lett., 11, 163–172, 2008.
Coley, P. D.: Effects of plant growth rate and leaf lifetime of the amount and type of anti-herbivore defense, Oecologia, 74, 531– 536, 1988.
Cuevas, E. and Medina, E.: Nutrient dynamics within Amazonian forest ecosystems. I. Nutrient flux in fine litterfall and efficiency in nutrient utilization, Oecologia, 68, 4466–4472, 1986. Del Grosso, S., Parton, W., Stohlgren, T., Zheng, D. L., Bachelet,
D., Prince, S., Hibbard, K., and Olson, R.: Global potential net primary production predicted from vegetation class, precipita-tion, and temperature, Ecology, 89, 2117–2126, 2008.
Dezzeo, N. and Chacon, N.: Litterfall and nutrient input in undis-turbed and adjacent fire disundis-turbed forests of the Gran Sabana, Southern Venezuela, Interciencia, 31, 894–899, 2006.
Dantas, M. and Phillipson, J.: Litterfall and litter nutrient content in primary and secondary Amazonian “terra firme” rain forest, J. Trop. Ecol., 5, 27–36, 1989.
Esser, G., Lieth, H. F. H., Scurlock, J. M. O., and Olson, R. J.: Worldwide estimates and bibliography of net primary productiv-ity derived from pre-1982 publications. ORNL/TM-13485. Oak Ridge National Laboratory, Oak Ridge, Tennessee, USA, 1997. Feldpausch, T. R., Riha, S., Fernandes, E. C. M., and Wandelli,
E. V.: Development of forest structure and leaf area in secondary forests regenerating on abandoned pastures in Central Amazonia, Earth Interactions, 9, 1–22, 2005.
967–979, 2007.
Fittkau, E. J. and Klinge, H.: On biomass and trophic structure of the Central Amazonian rain forest ecosystem, Biotropica, 5, 2– 14, 1973.
Fyllas, N. M., Pati˜no, S., Baker, T. R., Bielefeld Nardoto, G., Mar-tinelli, L. A., Quesada, C. A., Paiva, R., Schwarz, M., Horna, V., Mercado, L. M., Santos, A., Arroyo, L., Jim´enez, E. M., Luiz˜ao, F. J., Neill, D. A., Silva, N., Prieto, A., Rudas, A., Silviera, M., Vieira, I. C. G., Lopez-Gonzalez, G., Malhi, Y., Phillips, O. L., and Lloyd, J.: Basin-wide variations in foliar properties of Ama-zonian forest: phylogeny, soils and climate, Biogeosciences, 6, 2677–2708, 2009, http://www.biogeosciences.net/6/2677/2009/. Gentry, A. H. and Emmons, L. H.: Geographical variation in fertil-ity, phenology, and composition of the understory of Neotropical forests, Biotropica, 19, 216–227, 1987
Grace, J.: Understanding and managing the global carbon cycle, J. Ecol., 92, 189–202, 2004.
H¨attenschwiler, S., Aeschlimann, B., Coˆuteaux, M.-M., Roy, J., and Bonal, D.: High variation in foliage and leaf litter chem-istry among 45 tree species of a neotropical rainforest commu-nity, New Phytol., 179, 165–175, 2008.
Keller, M., Alencar, A., Asner, G. P., Braswell, B., Bustamente, M., Davidson, E., Feldpausch, T., Fernandes, E., Goulden, M., Kabat, P., Kruijt, B., Luiz˜ao, F., Miller, S., Markewitz, D., No-bre, A. D., NoNo-bre, C. A., Priante Filho, N., da Rocha, H., Silva Dias, P., von Randow, C., and Vourlitis, G. L.: Ecological re-search in the Large-Scale Biosphere-Atmosphere experiment in Amazonia: early results, Ecol. Appl., 14, S3–S16, 2004. Klinge, H. and Rodrigues, W. A.: Litter production in an area of
Amazonian terra firme forest, Amazoniana, 1, 287–310, 1968. Leigh Jr., E. G.: Tropical Forest Ecology. A View from Barro
Col-orado Island, Oxford University Press, Oxford, 245 pp., 1999. Lips, J. M. and Duivenvoorden, J. F.: Fine litter input to terrestrial
humus forms in Colombian Amazonia, Oecologia, 108, 138– 150, 1996.
Luiz˜ao, R. C. C., Luiz˜ao, F. J., Paiva, R. Q., Monteiro, T. F., Sousa, L. S., and Kruijt, B.: variation of carbon and nitrogen cycling processes along a topographic gradient in a central Amazonian forest, Glob. Change Biol., 10, 592–600, 2004.
Luiz˜ao, F. J.: Litter production and mineral element input to the forest floor in a Central Amazonian forest, GeoJournal, 19, 407– 417, 1989.
Luyssaert, S., Inglima, I., Jung, M., Richardson, A. D., M. Reich-stein M., et al.: CO2balance of boreal, temperate, and tropical forests derived from a global database, Glob. Change Biol., 13, 2509–2537, 2007.
Malhi, Y., Phillips, O. L., Baker, T. R., et al.: An international network to understand the biomass and dynamics of Amazonian forests (RAINFOR), J. Veg. Sci., 13, 439–450, 2002.
Malhi, Y., Baker, T. R., Phillips, O. L., et al. The above-ground coarse wood productivity of 104 Neotropical forest plots, Glob. Change. Biol., 10, 563–591, 2004.
Malhi, Y., Arag˜ao, L. E. O. C., Metcalfe, D. B., Paiva, R., Quesada, C. A., Almeida, S., Anderson, L., Brando, P., Chambers, J. Q., da Costa, A. C. L., Hutyra, L. R., Oliveira, P., Pati˜no, S., Pyle, L. H., Robertson, A. L., and Teixeira, L. M.: Comprehensive assessment of carbon productivity, allocation and storage in three Amazonian forests, Glob. Change. Biol., 15, 1255–1274, 2009. Martius, C., H¨ofer, H., Garcia, M. V. B., R¨ombke, J., and
Hana-garth, W.: Litter fall, litter stocks and decomposition rates in rainforest and agroforestry sites in central Amazonia, Nutr. Cycl. Agroecosyst., 68, 137–154, 2004.
McGroddy M. E., Daufresne, T., and Hedin, L. O.: Scaling of C:N:P stoichiometry in forests worldwide: Implications of terrestrial Redfield-type ratios, Ecology, 85, 2390–2401, 2004.
Mor˜aes, R. M., Carvalho, W. B., and Struffaldy de Vuono, Y.: Lit-terfall and litter nutrient content in two Brazilian tropical forests, Rev. Bras. Bot., 22, 9–16, 1999.
Morin, X. and Chuine, I.: Sensitivity analysis of the tree distribu-tion model PHENOFIT to climatic input characteristics: impli-cations for climate impact assessment, Glob. Change Biol., 9, 1493–1503, 2005.
Myneni, R. B., Yanga, W., Nemani, R. R., Huete, A. R., Dickinsone, R. E., Knyazikhina, Y., Didan, K., Fu, R., Negron Juarez, R. I., Saatchi, S. S., Hashimoto, H., Ichii K., Shabanov, N. V., Tana, B., Ratana, P., Privette, J. L., Morisette, J. T., Vermote, E. F., Roy, D. P., Wolfe, R. E., Friedl, M. A., Running, S. W., Votava, P., El-Saleous, N., Devadiga, S., Su, Y., and Salomonson, V. V.: Large seasonal swings in leaf area of Amazon rainforests, P. Natl. Acad. Sci., 104, 4820–4823, 2007.
Nebel, G., Dragsted, J., and Vega, A. S.: Litter fall, biomass and net primary production in flood plain forests in the Peruvian Ama-zon, Forest Ecol. Manage., 150, 93–102, 2001.
Nepstad, D. C., Moutinho, P., Dias-Filho, M. B., Davidson, E., Cardinot, G., Markewitz, D., Figueiredo, R., Vianna, N., Cham-bers, J., Ray, D., Guerreiros, J. B., Lefebvre, P., Sternberg, L., Moreira, M., Barros, L., Ishida, F. Y., Tohlver, I., Belk, E., Kalif, K., and Schwalbe, K.: The effects of partial throughfall exclusion on canopy processes, aboveground production, and biogeochem-istry of an Amazon forest, J. Geophys. Res. Atmos., 107, 8085, doi:10.1029/2001JD000360, 2002.
New, M., Hulme, M., and Jones, P.: Representing twentieth century space-time climate variability. Part I. Development of a 1961– 1990 mean monthly terrestrial climatology, J. Climate, 12, 829– 856, 1999.
Norden, N., Chave, J., Belbenoˆıt, P., Caub`ere, A., Chˆatelet, P., For-get, P.-M., and Th´ebaud, C.: Mast fruiting is a frequent strat-egy in woody species of Eastern South America, PLoS ONE, 2, e1079, doi:10.1371/journal.pone.0001079, 2007.
Priess, J. A., Then, Ch., and F¨olster, H.: Litter and fine-root pro-duction in three types of tropical premontane rain forest in SE Venezuela, Plant Ecol., 143, 171–187, 1999.
Proctor, J.: Tropical forest litterfall. I. Problems of litter compar-ison, in: Tropical rain forest: ecology and management, edited by: Sutton, S. L., Whitmore, T. C., and Chadwick, A. C., Black-well, Oxford, UK, 267–273, 1983.
Puig, H., Ri´era, B., and Lescure, J.-P.: Phytomasse et productivit´e, Bois Forˆets Trop., 220, 25–32, 1983.
Quesada, C. A.: Soil Vegetation Interactions Across Amazonia, Un-published PhD dissertation, University of Leeds, 2009.
to their genesis, Biogeosciences Discuss., 6, 3923–3992, 2009, http://www.biogeosciences-discuss.net/6/3923/2009/.
Reich, P. B., Uhl, C., Walters, M. B., Prugh, L., and Ellsworth, D. S.: Leaf demography and phenology in Amazonian rain forest: a census of 40000 leaves of 23 tree species, Ecol. Monogr., 74, 3–23, 2004.
R¨oderstein, M., Hertel, D., and Leuschner, C.: Above- and below-ground litter production in three tropical montane forests in Southern Ecuador, J. Trop. Ecol., 21, 483–492, 2005.
Sakai, S.: Phenological diversity in tropical forests, Pop. Ecol., 43, 77–86, 2001.
Santiago, L. S., Schuur, E. A. G., and Silvera, K.: Nutrient cycling and plant-soil feedbacks along a precipitation gradient in Low-land Panama, J. Trop. Ecol., 21, 461–470, 2005.
Schessl, M., Luiz da Silva, W., and Gottsberger, G.: Effects of frag-mentation on forest structure and litter dynamics in Atlantic rain-forest in Pernambuco, Brazil. Flora, 203, 215–228, 2008. Schuur, E. A. G.: Productivity and global climate revisited: the
sensitivity of tropical forest growth to precipitation, Ecology, 84, 1165–1170, 2003.
Scott, D. A., Proctor, J., and Thompson, J.: Studies on a lowland evergreen rain forest on Maraca island, Roraima, Brazil. II. Litter and nutrient cycling, J. Ecol., 80, 705–717, 1992.
Selva, E. C., Couto, E. G., Johnson, M. S., and Lehmann, J.: Litter-fall production and fluvial export in headwater catchments of the southern Amazon, J. Trop. Ecol., 23, 329–335, 2007.
Silva, C. J., Sanches, L., Bleich, M. E., Lobo, F. A., and Nogueira, J. S.: Produc¸˜ao de serrapilheira no cerrado e floresta de transic¸˜ao Amazˆonia-Cerrado do Centro-Oeste Brasileiro, Acta Amazon-ica, 37, 543–548, 2007.
Sizer, N. C., Tanner, E. V. J., and Kossmann Ferraz, I. D.: Edge ef-fects on litterfall mass and nutrient concentrations in forest frag-ments in central Amazonia, J. Trop. Ecol., 16, 853–863, 2000. Smith, K., Gholz, H. L., and Oliveira, F. A.: Litterfall and
nitrogen-use efficiency of plantations and primary forest in the eastern Brazilian Amazon, Forest Ecol. Manage., 109, 209–220, 1998. Sombroek W. G.: Amazon land forms and soils in relation to
bio-logical diversity, Acta Amazonica, 30, 81–100, 2000.
Vasconcelos, H. L. and Luiz˜ao, F. L.: Litter production and litter nutrient concentrations in a fragmented Amazonian landscape, Ecol. Appl., 14, 884–892, 2004.
Veneklaas, E. J.: Litterfall and nutrient fluxes in two montane trop-ical rain forests, Colombia, J. Trop. Ecol., 7, 319–336, 1991. Weiher, E. and Keddy, P. A.: Ecological assembly rules:
per-spectives, advances, retreats, Cambridge University Press, Cam-bridge, UK, 1999.
WRB World Reference Base for Soil Resources: A framework for international classification, correlation and communication, World Soil Resources Report 103, FAO, Rome, 2006.
Wright, S. J. and van Schaik, C. P.: Light and the phenology of tropical trees, Am. Nat., 143, 192–199, 1994.