Various studies conducted since the 1960s emphasize the contribution of socio-familial variables to students’ learning and academic achievement (AA). Coleman and colleagues in 1966 (Coleman, 1988) became famous in this regard, as they not only succeeded in demonstrating the relevance of the family sociocultural background (SCB), but also the relevance of an intervention to overcome defi cits at this level.
There is a signifi cant connection between the students’ AA and their families’ SCB. Higher levels of parents’ education —in particular of mothers— generate greater expectations, attendance and help concerning the children’s school work (Davis-Kean, 2005). This kind of attendance may compensate for the students’ learning diffi culties, and may contribute to overcome some of the failures pointed out in the educational system itself. Research conducted in various countries and among various ethnic groups confi rms the relevance of the family factors in explaining the students’ learning process (Dumka, Gonzales, Bonds, & Millsap, 2009; Engin-Demir, 2009; Flouri & Buchanan, 2004; López, Calvo,
& Caro, 2008). There is the conviction that parents’ educational styles and attendance of the school activities are positively related with students’ self-esteem and self-concept, becoming the students intrinsically motivated for learning and AA (García & Sánchez, 2005; Gonzalez-Pienda et al., 2002; López et al., 2008).
Along with parents’ SCB, other factors are equally important in explaining the students’ AA. Namely, the students’ cognitive abilities (CA) continue to be researched and are assumed to be a determinant factor in learning and AA. The cognitive functions used in the defi nition and measurement of intelligence are, after all, required in learning situations. These intellectual capacities are related to SCB (Colom & Flores-Mendoza, 2007; Deary, Strand, Smith, & Fernandes, 2007; Floyd, Evans, & McGrew, 2003; Taub, Floyd, Keith, & McGrew, 2008).
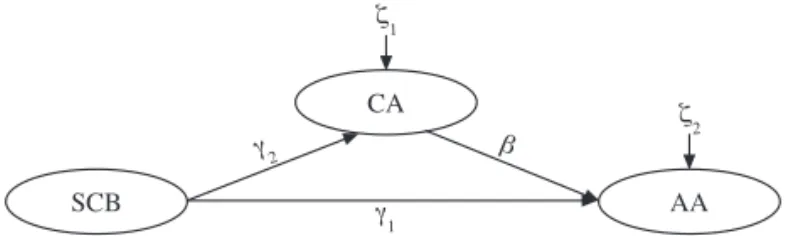
The infl uence of students’ SCB on CA and on AA, and of CA on AA, are acquired facts. However, the mediation role of CA on the relationship between SCB and AA is, as far as we know, not yet studied. We intend to assess the impact of students’ CA on the predictive relationship between their SCB and their AA in the three sequential years of the Portuguese third cycle of studies; 7th, 8th and 9th grades. We examine if the direct effect of SCB on AA (higher SCB, higher AA) is reinforced by the indirect effect of SCB on AA, represented by the effect of students’ SCB on their CA (higher SCB, higher CA) and the effect of students’ CA on their AA (higher CA, higher AA). In Figure 1, we present the conceptual
Fecha recepción: 31-8-10 • Fecha aceptación: 25-5-11 Correspondencia: Margarida Dias Pocinho Centro de Competência de Artes e Humanidades Universidad de Madeira
9000 Funchal (Portugal) e-mail: [email protected]
Cognitive abilities, sociocultural background and academic achievement
António Diniz
1, Margarida Dias Pocinho
2and Leandro Silva Almeida
31 Universidad de Évora (Portugal), 2 Universidad de Madeira (Portugal) and 3 Universidad de Minho (Portugal)
The infl uence of students’ sociocultural background on academic achievement is a well established fact. Research also points out that sociocultural background is related to students’ cognitive abilities and these have an effect on their academic achievement. However, the mediator role of cognitive abilities on the relationship between sociocultural background and academic achievement is less well known. A structural equation model that represents these relationships was tested in a sample (N= 728) of Portuguese junior high school students. Multigroup analysis of the model showed the importance of the cognitive ability mediation effect between sociocultural background and academic achievement in the 7th and 9th grades, but not in the 8th grade. This difference may be the result of the academic transition experienced in the 7th and 9th grades in the Portuguese educational system, which requires parents’ higher involvement in school.
diagram of the Path Model with Latent Variables for Sociocultural Background Infl uence on Academic Achievement (PMLV for SCB infl uence on AA) tested in this multigroup cross-sectional study, presuming it’s invariance across grades.
Method
Participants
A sample of 728 Portuguese volunteer students (age range= 11-19 years; M= 13, SD= 1) was used in this study. Among them, 37% belong to the 7th grade (47.7% have 12 years; 30.3% have 13 years), 28.8% to the 8th grade (36.8% have 13 years; 36.3% have 14 years) and 34.2% to the 9th grade (34.3% have 14 years; 39.4% have 15 years). This sample, mostly composed by girls across grades (7th, 54.4%; 8th, 59%; 9th, 56.5%), was selected (convenience sampling) in three public schools (n1= 249, 34.2%;
n2= 241, 33.1%; n3= 238, 32.7%).
Instrument
The latent construct CA was operationalized through the Reasoning Tests Battery, Version form 7th to 9th grades (RTB7/9) (Almeida & Lemos, 2007). The RTB7/9 is composed by fi ve reasoning tests: (1) Abstract Reasoning (AR, 25 fi gural analogies, 5 minutes of administration time); (2) Numerical Reasoning (NR, 20 numerical series,10 minutes of administration time); (3) Verbal Reasoning (VR, 25 verbal analogies, 4 minutes of administration time); (4) Mechanical Reasoning (MR, 25 mechanical problem-solving items, 8 minutes of administration time); and, (5) Spatial Reasoning (SR, 20 spatial orientation and cubes rotation series, 9 minutes of administration time). Reliability indices were calculated by test-retest correlation and internal consistency of items. The coeffi cients (KR21) obtained vary from .63 (MR) to .84 (NR). Principal components’ analysis suggests a common or general factor extracting 56% of the fi ve subtests scores’ variance, meaning an important role of the inductive and deductive processes (reasoning) activated by item’s specifi c content.
Procedure
Students’ parents provided active informed consent for their adolescents’ assessment. The RTB7/9 was administered collectively, as the teachers ceded the fi nal portion of their teaching time for this purpose. The students were informed in advance of
the objectives of the study. The schools’ administrative services provided the information about students’ SCB and AA.
The latent construct SCB was operationalized through the educational and professional level of students’ parents. Five levels to the former (level 1 ≤ 4th grade; level 2= 5th and 6th grades; level 3= 7th, 8th and 9th grades; level 4= 10th, 11th and 12th grades; and, level 5 > 12th grade), and three levels to the latter: level 1= low (unskilled workers in commerce, services, agriculture, fi shing, construction, industry and transports); level 2= medium (salesmen, skilled workers in agriculture and fi shing, technicians and administrative professionals); level 3= high (upper management and specialists in intellectual and scientifi c professions).
The latent construct AA was operationalized through the students’ marks (from 1 to 5) in the disciplines of Portuguese (Port.), English (Eng.), mathematics (Math.) and nature sciences (NC).
Data analysis
The SPSS for Windows(version 17.0) was used for descriptive data analysis. Participants with missing values and outliers were excluded. The model was tested using LISREL 8.53 (Jöreskog & Sörbom, 2002).
In a multigroup cross-sectional study with LISREL, measurement invariance of discrete data, like the ordered-categorial data generated for both SCB and AA, implies a specifi c kind of parameterization (Jöreskog, 2005; Millsap & Yun-Tein, 2004). PRELIS 2 (Jöreskog & Sörbom, 1996) uses the indicators’ underlying latent continuous response cut by m - 1 threshold parameters (m = number of response options) to produce the means and the polychoric covariance matrix of that latent variables, along with their asymptotic covariance matrix. The fi rst two thresholds are fi xed to zero and one respectively (Millsap & Yun-Tein, 2004). Estimates were computed for each group under fi xed thresholds to the pooled thresholds estimates in the combined group. The means and the covariance matrices of this multigroup analysis were used as input to LISREL.
Model estimation was done using the SIMPLIS command language (Jöreskog & Sörbom, 1993) with the Satorra-Bentler scaled correction of maximum likelihood (MLSB; Satorra & Bentler, 1994), which adjusts standard errors and model fi t statistics to nonnormality. This robust technique performs very well over different sample sizes and degrees of nonnormality with continuous (Curran, West, & Finch, 1996) and discrete (DiStefano, 2002) variables.
The MLSBχ2, the comparative fi t index (CFI) and the root mean
square error of approximation (RMSEA) were used in this study to evaluate the goodness of fi t (GOF) of the hypothesized model to empirical data. The χ2 is an absolute measure of the discrepancy
between model and data: a level of probability lower than .05 for the χ2
indicates lack of fi t (Jöreskog & Sörbom, 1993). The CFI compares the model with its’ null counterpart, the independence model, indicating the amount of data covariation that is reproduced by the model: it must be .90 to accept the model (by convention) and close or above .95 to show a good fi t (Hu & Bentler, 1998). The RMSEA is a measure of the discrepancy per degree of freedom between model and data: a value close or below .06 indicate a good fi t (Hu & Bentler, 1998).
Following Jöreskog and Sörbom’s (1993) two-step approach of modeling, the confi rmatory factor analysis (CFA) of the measurement model with the three latent constructs freely correlated (oblique factor model) was done before the assessment of the structural relationships of the PMLV for SCB infl uence on AA. To assure construct validity, it is important that latent constructs present acceptable convergent
CA
SCB AA
γ2
γ1
β
ζ1
ζ2
validity (CV), discriminant validity (DV) and reliability (Anderson & Gerbing, 1988). To assign the latent constructs’ units of measurement, the relationship for one of its indicators was fi xed to one.
Measurement equivalence across groups typically begins with the test of the confi gural invariance of the model. In this model all parameters are freely estimated across groups. As a baseline model, it serves a process of testing more stringent equality conditions across groups. Meredith (1993) pointed out three types of measurement invariance: weak, strong and strict. In the fi rst type, the factor loadings are equal over groups (all the other parameters are freely estimated). In the second, the factor loadings plus the fi tted means or intercepts (values of each indicator corresponding to the zero value of the factor) are equal over groups. In the third, besides factor loadings and intercepts, also the residuals (indicators’ specifi c factor plus random error) are equal over groups. Strong invariance is necessary for comparisons of latent construct means, because it assures that constructs have the same scale over groups (i.e., the same origin and unit of measurement). Likewise, strong invariance is necessary to test multigroup equality of regression models with latent variables (Jöreskog & Sörbom, 1993).
When full invariance is not achieved, partial invariance can be reached by allowing a subset of indicators to vary freely across groups, while constraining at least one to equality in addition to those that are equal due to their being fi xed to unity for identifi cation purposes (Byrne et al., 1989). Nevertheless, data-driven modifi cations of an initial model should be substantively justifi ed to avoid capitalization on chance (MacCallum, Roznowski, & Necowitz, 1992).
The assessment of model fi t in testing model equivalence is usually founded in GOF statistics, in addition to chi-square tests. However, the excessive sensitivity of the χ2 test statistic to sample
size and model complexity led to alternative approaches. The use of the CFI’s change (∆CFI) between a full model (model with parameters unconstrained in all groups) and a restricted model (model with specifi c parameters constrained to equality across
groups) is recommended to overcome that problem (Cheung & Rensvold, 2002). A ∆CFI higher than .01 indicates noninvariance of the restricted model.
The MLSB estimates for the completely standardized solution (with both factors and indicators standardized) to common metric of the measurement invariant model allowed the examination of latent constructs’ CV, DV, and composite reliability (CR) (Fornell & Larcker, 1981). The CV was assessed through the indicators’ average variance extracted (AVE), which should be at least .50. The DV was assessed by comparing the shared variance (squared disattenuated correlation) between any two constructs and the AVE of each: the values of the former should be lower than those of the latter. Construct’s reliability is deemed acceptable for group comparisons when it reaches .80 (Nunnally & Bernstein, 1994).
The unstandardized solution of the tested model (Figure 1) was used to examine its structural relationships, with one-tail t-Student tests because of the well established nature of model’s relationships (higher x, higher y). The expression ∆z= (γ(4) - γ(1))/root square
[(SE2 (4) + SE
2
(1))/2] was used to assess the CA’s mediation in the
predictive relationship between SCB and AA. In this expression: γ(4)= unstandardized total effect (equal to unstandardized direct
effect + unstandardized indirect effect) of SCB on AA; γ(1) = unstandardized direct effect of SCB on AA, with SE(4) and SE(1)
as respective standard errors. A ∆z test statistic higher than 1.96 indicates that the compared effects differ at the p<.05 signifi cance level: CA has a reinforcement effect.
Results
Measurement equivalence
The results of the CFA showed that form invariance of the measurement model across groups was not tenable because of the lack of reliability of MR subtest in the 9th grade group (B= .19,
Table 1
Measurement model’s form invariance: Maximum likelihood estimates for the common metric completely standardized solution
Indicator
7th grade (n= 269) 8th grade (n= 210) 9th grade (n= 249)
β R2 Intercept β R2 Intercept β R2 Intercept
MEL .93 .90 .57 .93 .84 .24 .93 .86 .29
MPL 1.05 .90 -1.62 1.11 .92 -1.81 .73 .96 -.91
FEL .79 .72 .08 1.07 .75 -.83 89 .82 -.51
FPL .63 .90 -.91 1.52 .62 -2.20 .82 .83 -1.20
AR .40 .49 4.82 .62 .19 11.34 .79 .35 13.16
NR .43 .26 7.53 .56 .33 7.47 .74 .39 9.63
VR .67 .37 11.00 .67 .44 11.70 .69 .53 13.71
SR .57 .38 8.14 .52 .45 8.40 .80 .41 10.49
Port. .90 .87 .45 .90 .81 .43 .90 .76 .35
Eng. .90 .64 .58 .59 .71 .68 .83 .62 .37
Math. .60 .90 1.10 .80 .42 .32 1.02 .55 .17
NC .91 .65 .67 .80 .71 .73 .74 .72 .57
Note: MEL= mother educational level; MPL= mother professional level; FEL= father educational level; FPL= father professional level; AR= abstract reasoning; NR= numerical reasoning; VR= verbal reasoning; SR= spatial reasoning; Port.= mark in Portuguese; Eng.= mark in English; Math.= mark in mathematics; NC= mark in nature sciences. β= standardized factor loading (with
t(247)= .90, p= ns). Note that MR has also a low unstandardized
loading in the 7th grade group (B= .34, t(267)= 2.99, p<01). According to previous described cutoff values for GOF statistics, the model without MR was well fi tted to data over groups (MLSBχ2=
142.41, df= 153, p= ns; CFI= .909; RMSEA= .00(90% CI = .00; .024)), and it was taken as a baseline model to assess measurement invariance. MLSB estimates for the solution completely standardized to common metric of this form invariant model are presented in Table 1.
Weak measurement invariance across groups was not achieved (MLSBχ2= 247.33, df= 171, p<.001; CFI= .874; ∆CFI>.01; RMSEA=
.043(90% CI = .031; .054)). It was only reached when the loadings of FPL,
AR and Engl. were freely estimated in the 8th grade group, plus those of MPL, FPL, NR and Engl. in the 9th grade group (see Table 1). With these modifi cations the model was well fi tted (MLSBχ
2=
161.73, df= 164, p= ns;CFI= .901; ∆CFI<.01; RMSEA= .00(90% CI
= .00; .028)). Thus, the hypothesis of partial weak invariance was not
rejected and partial strong invariance was assessed next.
Partial strong measurement invariance across groups was not achieved (MLSBχ2= 278.54, df= 181, p<.001; CFI= .836;
∆CFI>.01; RMSEA= .047(90% CI = .036; .058)). To make this model invariant (MLSBχ
2= 175.60, df= 173, p= ns; CFI= .895; ∆CFI<.01;
RMSEA= .008(90% CI = .00; .030)), it was necessary to freely estimate the intercepts of FEL and Math. in the 8th grade group, plus those of FEL and NC in the 9th grade group (see Table 1).
Nevertheless, the number of indicators in the 9th grade group with loadings and intercepts that needed to be unconstrained was too high to be acceptable (MPL, FPL and FEL), violating the standard of the maintenance of at least two fi xed indicators in a latent construct (Byrne et al., 1989). Hence, strict measurement invariance and factor level invariance were not assessed for completeness.
Finally, through MLSB estimates of the completely standardized
solution to common metric for the partial weak invariant model, excellent CV and CR were verifi ed in all groups for SCB (AVE between .84 and .83; CR= .95) and AA (AVE between .75 and .62; CR between .92 and .86). Nevertheless, both CV and CR were weak in all groups for CA (AVE between .42 and .34; CR= between .74 and .66). Regarding the latent constructs’ DV, all their shared variances were lower than the AVE of each one, with the exception of those obtained in the 7th grade group for both SCB and CA (.49) and CA and AA (.86), and the one obtained in the 9th grade group for CA and AA (.52).
Overall, the results of the CFA for the partial weak invariant model provided some evidence for construct validity (with major problems for CA in the 7th grade group), and this model was used to test the structural relationships of the PMLV for SCB infl uence on AA, with the direct effects, the variance of SCB and the structural residuals of CA and AA freely estimated across groups.
Structural relationships
The specifi ed PMLV for SCB infl uence on AA was well fi tted to data. The GOF statistics presented in the caption of Figure 2 are, as expected, identical to those of the partial weak measurement invariant model (the covariances of latent constructs were respecifi ed as direct effects). For simplicity purposes, only the structural relationships are presented in the fi gure.
We can see through the MLSB estimates for the model’s
unstandardized solution that all the direct effects are statistically signifi cant in all groups, with two nuances in the effect of SCB on AA (higher SCB, higher AA), which is both less signifi cant than
the other effects in all groups and less signifi cant in the 8th grade group than in the other groups. Also the magnitude of the effect of SCB on CA (higher SCB, higher CA) is lower in the 8th grade group than in the other groups, and the magnitude of the effect of CA on AA (higher CA, higher AA) is lower in the 9th grade group than in the other groups. Comparing the effects that constitute the indirect effect of SCB on AA, the one of SCB on CA is higher than the one of CA on AA in all groups.
Overall, the indirect and the total effects of SCB on AA were higher in both the 7th and 9th grade groups than in the 8th grade group, and the coeffi cients of determination (R2) of CA and AA
present the same pattern.
Finally, the MLSB estimates for the unstandardized solution also pointed out that the statistical signifi cance of the difference between the direct effect and the total effect of SCB on AA was tenable for both the 7th (∆z= 3.80, p<.001) and 9th (∆z= 3.10, p<.01) grade groups, but not in the 8th grade group (∆z= 1.83, p= ns).
Discussion
Following a two-step approach of modeling (Anderson & Gerbing, 1988; Jöreskog & Sörbom, 1993), we tested, in 7th, 8th, and 9th grade students, a PMLV for SCB infl uence on AA to assess
SCB
CA
AA R2= .350
.644(.111)
*** .176 (.047)***
.085 (.035)**
R2= .483 7th grade (n= 269)
Indirect effect SCB-CH-AA= .113(.025), t= 4.52, p<.001 Total effect SCB-AA= .199(.024), t= 8.29, p<.001
SCB
CA
AA R2= .097
.407(.111)
*** .170 (.036)***
.073 (.044)*
R2= .152 8th grade (n= 210)
Indirect effect SCB-CH-AA= .069(.018), t= 3.83, p<.001 Total effect SCB-AA= .142(.030), t= 4.73, p<.001
SCB
CA
AA R2= .240
.614(.111)
*** .132 (.037)***
.075(.032)**
R2= .284 9th grade (n= 249)
Indirect effect SCB-CH-AA= .08(.024), t= 3.40, p<.001 Total effect SCB-AA= .160(.022), t= 7.15, p<.001
Figure 2. Path Model with Latent Variables for Sociocultural Background Infl uence on Academic Achievement: Unstandardized maximum likelihood estimates for structural relationships. Goodness of fi t statistics: MLSBχ2=
162.21, df= 164, p= ns; comparative fi t index (CFI)= .901; root mean square error of approximation (RMSEA)= .00(90% CI = .00; .028). Standard errors in parenthesis. R2 (coeffi cient of determination)= amount of the latent
criteria’s variance accounted by latent predictor(s). See Figure 1 for other abbreviations.
the impact of CA on the predictive relationship between SCB and AA.
At measurement level, the test of form invariance led to the exclusion of MR. The model without MR was only weak invariant (Meredith, 1993) over groups, and in a partial way (Byrne et al., 1989). Once data-driven modifi cations of a model can be due to chance characteristics of the data set (MacCallum et al., 1992), their substantive justifi cations are: (1) the MR subtest includes items involving academic knowledge (e.g., from physic principles) or practical competencies (daily problem-solving strategies), and these different type of contents explain it’s reliability problems to represent CA; (2) the MPL and FPL’s group differences were due to random differences in sample characteristics; (3) the AR’s difference between the 7th and the 8th grade groups can be explained through normative age-graded developmental gains (Almeida & Lemos, 2007); (4) the NR’s difference between the 8th and the 9th grade groups can be explained as later developmental consequences of the previous changes in AR; and, (5) the Engl. group differences can be explained based on changes in curricular demands (higher with the grades passing by).
Because the necessary condition of strong invariance (Meredith, 1993) to test multigroup equivalence of regression models with latent variables (Jöreskog & Sörbom, 1993) was not verifi ed, the structural relationships of the PMLV for SCB infl uence on AA were assessed without equality constraints across groups.
The model was well fi tted to data and, as expected considering the previously reviewed literature, all its structural relationships were statistically signifi cant in all groups. Study’s results also showed that the pattern of model’s structural relationships was analogous in the 7th and 9th grade groups, but different to the one of the 8th grade group. The same can be said about the impact of students’ CA on the predictive relationship between their SCB and their AA: CA had a reinforcement role on the effect of SCB on AA in the 7th and 9th grade groups, but not in the the 8th grade group. Overall, there is a similar pattern in the beginning and in the end,
but not in the middle, of this cycle of studies. This difference can be related with a higher parent’s involvement in school transition years.
The PMLV for SCB infl uence on AA was analysed in terms of its «predictive accuracy within the same domain of prediction as that from which the observed data were sampled» (interpolative
predictive accuracy, Forster, 2002, p. S126). The convenience
sampling procedure of this research imposes limitations in model extrapolation and, moreover, in model generalization: the study of various non-probabilistic samples or, better, of a representative sample, is desirable. The study of the model equivalence across time would also illuminate if the changes found in this study for the 8th grade students were not artefacts created by its cross-sectional nature. Furthermore, knowing that parent involvement, with the mediation of academic self-concept (ASC), has a positive effect in AA (González-Pienda et al., 2002) the model might be improved with another indirect path including the ASC.
Some practical implications can be presented considering this study. The impact of SCB in students’ AA was confi rmed namely in the transition grades when it’s expected a bigger involvement of parents in their adolescents’ academic activities. So, particular attention must be given to students belonging to lowest social status, for example an enrichment curriculum or a parents’ education program promoting their investment on children’s academic activities. This study shows that the socio-familiar impact on academic achievement increases when we introduce in data analysis the students’ CA, which is particularly evident when students are involved in transition schools years. Cognitive training programs should be provided to students who cumulatively come from lower socio-familiar stratus and present low cognitive abilities. These students show patterns of self-concept, motivation and CA not favorable to a successful academic achievement. These academic fragilities can assume particular relevance in transition school grades, when some new disciplines or some vocational options are presented.
References
Almeida, L.S., & Lemos, G. (2007). Bateria de Provas de raciocinio: manual técnico [Reasoning Tests Battery: Technical manual]. Braga: Universidade do Minho.
Anderson, J.C., & Gerbing, D.W. (1988). Structural equation modeling in practice: A review and recommended two step approach. Psychologial Bulletin, 103, 411-423.
Byrne, B.M., Shavelson, R.J., & Muthén, B. (1989). Testing for the equivalence of factor covariance and mean structures: The issue of partial measurement invariance. Psychological Bulletin, 105, 456-466. Cheung, G.W., & Rensvold, R.B. (2002). Evaluating goodness-of-fi t
indexes for testing measurement invariance. Structural Equation Modeling, 9, 233-255.
Coleman, J.S. (1988). Social capital in the creation of human capital.
American Journal of Sociology, 94, 95-120.
Colom, R., & Flores-Mendoza, C.E. (2007). Intelligence predicts scholastic achievement irrespective of SES factors: Evidence from Brazil.
Intelligence, 35, 243-251.
Curran, P.J., West, S.G., & Finch, J.F. (1996). The robustness of test statistics to nonnormality and specifi cation error in confi rmatory factor analysis. Psychological Methods, 1, 16-29.
Davis-Kean, P.E. (2005). The infl uence of parent education and family income on child achievement: The indirect role of parental expectations and the home environment. Journal of Family Psychology, 19, 294-304.
Deary, I.J., Strand, S., Smith, P., & Fernandes, C. (2007). Intelligence and educational achievement. Intelligence, 35, 13-21.
DiStefano, C. (2002). The impact of categorization with confi rmatory factor analysis. Structural Equation Modeling, 9, 327-346.
Dumka, L.E., Gonzales N.A., Bonds, D., & Millsap, R. (2009). Academic success in Mexican origin adolescent boys and girls: The role of mothers’ and fathers’ parenting and cultural orientation. Sex Roles, 60, 588-599. Engin-Demir, C. (2009). Factors infl uencing the academic achievement
of the Turkish urban poor. International Journal of Educational Development,29, 17-29.
Flouri, E., & Buchanan, A. (2004). Early father’s and mother’s involvement and child’s later educational outcomes. British Journal of Educational Psychology, 74, 141-153.
Floyd, R.G., Evans, J.J., & McGrew, K.S. (2003). Relations between measures of Cattell-Horn-Carroll (CHC) cognitive abilities and mathematics across the years. Psychology in the Schools, 40, 155-171. Fornell, C., & Larcker, D.F. (1981). Evaluating structural equation models with unobservable variables and measurement error. Journal of Marketing Research, 18, 39-50.
Forster, M.R. (2002). Predictive accuracy as an achievable goal of science.
Philosophy of Science, 69, S124-S134.
Gonzalez-Pienda, J.A., Núñez, J.C., González-Pumariega, S., Álvarez, L., Roces, C., & García, M. (2002).A structural equation model of parental involvement, motivational and aptitudinal characteristics, and academic achievement. Journal of Experimental Education, 70, 257-287. Hu, L., & Bentler, P.M. (1998). Fit indices in covariance structure modeling:
Sensitivity to underparametrized model misspecifi cation. Psychological Methods, 3, 424-453.
Jöreskog, K.G. (2005). Structural equation modeling with ordinal variables using LISREL. Retrieved April 4, 2008, from: http:// www.ssicentral. com/lisrel/techdocs.
Jöreskog, K.G., & Sörbom, D. (1993). LISREL 8: Structural equation modeling with the SIMPLIS command language. Chicago: Scientifi c Software International.
Jöreskog, K.G., & Sörbom, D. (1996). PRELIS 2: User’s reference guide.
Chicago: Scientifi c Software International.
Jöreskog, K.G., & Sörbom, D. (2002). LISREL 8.53 for Windows. Chicago: Scientifi c Software International.
López, S.T., Calvo, J.V.P., & Caro, M.I. (2008). Estilos de educación familiar. Psicothema, 20, 62-70.
MacCallum, R.C., Roznowski, M., & Necowitz, L.B. (1992). Model modification in covariance structure analysis: The problem of capitalization on chance. Psychological Bulletin, 111, 490-504. Meredith, W. (1993). Measurement invariance, factor analysis and factorial
invariance. Psychometrika, 58, 525-543.
Millsap, R.E., & Yun-Tein, J. (2004). Assessing factorial invariance in ordered-categorical measures. Multivariate Behavioral Research, 39, 479-515.
Moon, S.S., & Lee, J. (2009). Multiple predictors of Asian American children’s school achievement. Early Education & Development, 20, 129-147. Nunnally, J.C., & Bernstein, I.H. (1994). Psychometric theory (3rd ed.).
New York: McGraw-Hill.
Satorra, A., & Bentler, P.M. (1994). Corrections to test statistics and standard errors in covariance structure analysis. In A. von Eye, & C.C. Clogg (Eds.), Latent variable analysis (pp. 399-419). Thousand Oaks, CA: SAGE.