MULTIVARIATE MODELING OF PEDESTRIAN FATALITY RISK
THROUGH ON THE SPOT ACCIDENT INVESTIGATION
A. B A D E A , A. F U R O N E S , F. J. P Á E Z and C. G O N Z Á L E Z
University Institute of Automobile Research (INSIA), Technical University of Madrid (UPM), Carretera de Valencia km7, Madrid 28031, Spain
Laboratory of Statistics, E.T.S. Industrial Engineering, Technical University of Madrid (UPM), C./José Gutiérrez Abascal n°2, Madrid 28006, Spain
ABSTRACT-Pedestrians are the most vulnerable users of public roads and represent one of the largest groups of road casualties; their death rate around the world due to vehicle-pedestrian collisions is high and tending to rise. In Spain, as in other countries of the European Union, steps have been taken to reduce the number and consequences of such accidents, with encouraging results in recent years. A key to countering this concern is the accident research activity that has obtained remarkable achievements in different fields, especially when multidisciplinary approaches are taken. This paper describes the development of a multivariate model that is able to detect the most influential parameters on the consequences of vehicle-pedestrian collision and to quantify their impact on vehicle-pedestrian fatality risk. First, an accident database containing detailed information and parameters of vehicle-pedestrian collisions in Madrid has been developed. The accidents were investigated on the spot by INSIA accident investigation teams and analyzed using advanced reconstruction techniques. The model was then developed with two components: (1) a classification tree that characterizes and selects the explanatory variables, identifying their interactions, and (2) a binary logistic regression to quantify the influence of each variable and interaction resulting from the classification tree. The whole model represents an important tool for identifying, quantifying and predicting the potential impact of measures aimed at reducing injuries in vehicle-pedestrian collisions.
KEY WORDS : On the spot accident investigation, Pedestrian safety, Accident reconstruction, Multivariate model
1. I N T R O D U C T I O N
Pedestrians are one of the largest groups of public road user, and they have the lowest level of protection against vehicle collisions. This high vulnerability, together with increasing population and traffic density, malees the death rate due to vehicle-pedestrian collisions a situation of growing concern, especially in developing countries. Vehicle-pedestrian collisions are the most aggressive component of the "hidden epidemic" represented by road accidents, which kill 1.2 million people each year (World Health Organization, 2004).
Over the last decade in Spain, a series of measures have been implemented to reduce the number of vehicle-pede-strian collisions and mitigate their serious socio-economic consequences. These measures belong to a number of different fields and require a joint effort, and most conform to the recommendations and directives launched at the European level (Commission of the European Communities, 2001, 2003). The result of their implementation, as shown in Figure 1, has been the reduction of pedestrian fatalities in Spain by 29% from 1996 to 2005 (DOT, 2009). The total
reduction in the 14 EU countries was 36% (European Road Safety Observatory, 2008).
This decrease is due to administrative measures for prevention, enforcement, infrastructure refurbishment and efficient planning of public roads.
However, lately the reduction has slowed down, and the efforts seem to be insufficient. The overall numbers of
6 0 0 0 i 1 ^——i 1 1 1 1 1 1 1 1 1
S 5000 — ~*"" > ..
£ 4000 H r*V_
I 3000
"" 2000
• • I I | —
0 -I \ 1 1 1 1 1 1 1
/ i i i i i 4 4 / i i i i 4
Year
-o-EU 14. Source: CARE database(2008)
-•-Spain. Source: Annual Statistical Report. Sparrisn Road Traffic Administration-DOT. [2009)
18000
16000
£ 14000
ra '=12000
tfí
* 10000
S. 8000
•a
¡£ 6000 c" 4000 2000
•J
I
S l A l £ ' h < . 4 Q 0 t Q i - i r 4 f ' l 4 - L l ' t i a h t £ S O > 0 H N * } 4 A U) h « > « > « > M 0 e i J i a i OLi OLi ( í i OLi ( T h ( T > ( ^ t r t Q Q Q Q O Q Q Q
Year • Inter-urban road
Figure 2. Injured pedestrians per year in traffic accidents in Spain (urban and inter-urban). Source: Annual Statistical Report DGT (2009).
The purpose of the current study is to develop a model that takes a set of parameters from the in-depth investi-gations, identifies the most significant parameters, and creates an explanatory model using those independent variables and their interactions to describe and quantify their influences on pedestrian injuries.
The explanatory model has two components, one based on classification trees and the second on binary logistic regression (logit). The model inputs come from a database of accidents that occurred in Madrid and were investigated on the spot by INSIA accident investigation teams. This database contains a large set of parameters collected in situ; others were obtained by reconstruction through computer simulations and through the study of injury mechanisms.
2. VIRTUAL RECONSTRUCTION OF REAL ACCIDENTS
pedestrian injuries and fatalities from traffic accidents are high and still of concern, especially in urban areas. Figure 2 shows the number of pedestrians injured in urban and non-urban areas per year in Spain. It can be seen that most vehicle-pedestrian collisions occur in urban areas, where the speed limit is normally under 50 km/h.
A key to further reducing the impact, causes and con-sequences of such accidents is to jointly implement the developments achieved in the different areas of pedestrian safety research, including in-depth accident investigation on the spot, detailed accident reconstruction, accident simulation through specific software, study of biomechanical and materials behavior and the development of statistical models to detect and quantify the influencing factors.
Outstanding results are emerging in each of these fields of research, but the improvements increase greatly when a multidisciplinary approach is taken. Previous works like Nagatomy et al. (2005) or Shin et al. (2008) integrate finite element models (FEM) and crash simulations during the design process for secondary safety systems; others like Koch and Howard (2005) and Yang et al. (2005) combine the analysis of real-world accidents with FEM models to run reconstructions and measure the severity of pedestrian injuries, or in the case of Simms and Wood (2006), to compare the crashworthiness of different types of vehicles. All of these works combine the use of FEM models with complementary applications, but due to their complexity, these models run into limitations when the number of iterative simulations rises too high.
A different approach is required when the number of cases is too high. In their recent studies, Oh et al. (2008) and Rosen and Sander (2009) have developed probabilistic models that combine the analysis of real-world accident reconstruction techniques and the study of kinematic parameters and mechanisms of injury. Oh et al. (2008) also complements these models with a suitable number of FEM simulations and laboratory impact tests to validate the results for the design of active safety devices.
2.1. Accident Database and Reconstruction Tool
The model developed to study vehicle-pedestrian collisions uses information from an accident database compiled by the Accidentology and Vehicle Dynamics Department of INSIA within the ABIDA project (INSIA, 2005). This database was constructed in collaboration with the Madrid Local Police and SAMUR emergency services and con-tains a sample of 108 vehicle-pedestrian accidents that occurred in Madrid between 2002 and 2005. It includes detailed information from the scene, road marks, vehicle data and deformations as well as pedestrian injuries and their generating mechanisms.
The sampling criteria were the following: the accident occurred in an urban area (where the speed limit is usually under 50 km/h); the type of vehicle involved was a car, minivan or SUV; and the pedestrian was impacted with the front edge of the vehicle and was injured or killed as a consequence. Fifty cases that met all of these requirements were selected.
With all of the information available regarding the initial conditions and depending on the methodology used for accident reconstruction, an additional set of data can be obtained from simulations, estimates, measurements and calculations.
In addition to the complexity of the FEM models and the difficulties in simulating pre-collision and post-collision stages, the first approach has the further drawback that in reconstructing a real-world accident there are infinite combinations of the initial parameters, and the simulation of the collision is sensitive to most of them. Authors like Lawrence (2005) and Bovenkerk et al. (2007) have demonstrated this through reconstructions that suggest that simulations with FEM models are very accurate when the initial conditions of the accident are well known, i.e., in standard laboratory conditions. Therefore, the implemen-tation of this methodology is proposed as a complement or an alternative to costly impact tests with dummies and other components.
To solve the difficulties in determining the correct initial conditions for multibody-FEM model simulations, Shen and Jin (2008) and Untaroiu et al. (2008) have proposed using optimization techniques that allow an a priori choice of the best combination of initial parameters for a reliable reconstruction. However, when the number of cases rises, the effort to run this type of reconstruction is still too high, and in some cases it is difficult to simulate the pre- or post-impact phases.
The second method is the classical approach, which uses algebraic models such as the pedestrian projection models of Han and Brach (2002) and Wood et al. (2005) or the physical model of Xu et al. (2009), which reproduces the windshield-head impact with the same accuracy or better than some of the developed FEM models.
In his recent probabilistic model, Oh et al. (2008) used empirical mathematical expressions such as the one developed by Schmidt and Nagel (1971) to determine the value of the collision speed. The empirical expression is based on the braliing marks, the static coefficient of friction, the height of the pedestrian center of mass and the throw-distance. Although this model has been widely used to determine the collision speed, the necessary parameters are not available in all cases, and the results are not always very accurate. To benefit from the advantages of each approach, the PC-Crash® simulation software has been used in this study. This program has a simple pedestrian multibody module that reproduces pedestrian kinematics and trajectories due to impact and allows reconstruction of the motion of the entire accident in a reasonable runtime; in addition, the most important kinematic parameters can be found versus time and distance. The ability of this tool to simulate vehicle-pedestrian accidents has been validated by Moser et al. (2000).
2.2. Setting Initial Conditions
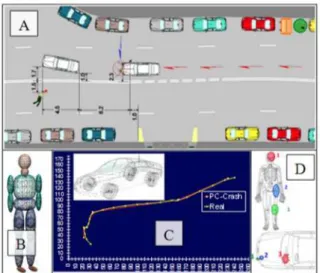
All available information and data investigated on the spot have been analyzed in depth and were used to simulate the accident with PC-Crash®. The scene was first recreated through detailed sketches, to scale, with the geometry, mea-surements, marks, traces, collision point and rest positions. The corresponding vehicle parameters were then loaded
Figure 3. Setting initial conditions for simulation: A) Sketch; B) Multibody model; C) Vehicle shape; D) Injury mechanisms.
from the vehicle databases of PC-Crash®, which considers the make, model, year of manufacture and variant and adjusts all of the parameters for which data were available. In this process, special attention was paid to setting and correcting the front shape of the vehicle. Next, all proper-ties of the multibody pedestrian model were defined, adjusting in each case the height and weight to the real values and scaling the most important anthropometric para-meters according to age and sex of the pedestrian, all based on anthropometric studies of the Spanish population (Benjumea, 2001). Finally, the friction properties were defined based on real conditions: the coefficient of friction between the multibody and the ground or the striking vehicle, the static coefficient of friction of the specific scene and the non-linear tire model; even the behavior of ABS has been reproduced in relevant cases. Figure 3 illustrates the adjusting of some of the simulation para-meters in schematic form.
2.3. Simulations and Collision Speed (Vk)
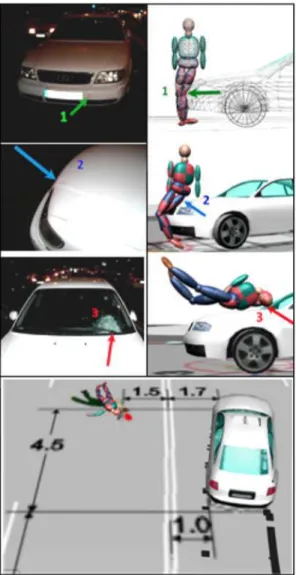
Figure 4. Simulation example: Contact and rest positions consistent with the real accident evidence.
position resulting from a simulation.
The collision speed is one of the most important para-meters in building the multivariate model because it deter-mines the intensity of the impact and, consequently, the severity of injuries. However, estimating its value accurately is not a simple task. In this study, simulations with PC-Crash® were performed to obtain accurate values for both the collision speed and the other parameters with which the multivariate model is built. This methodology represents a practical alternative to the traditional methods commonly used to estimate accident parameters.
The value of the collision speed obtained from the re-construction process depends on the initial conditions and on the rest positions, so the range in which these para-meters could be modified without affecting the simulation was very narrow.
Previous crash tests with dummies (INSIA et al., 2008) have shown that the value of the collision speed resulting from a reconstruction process similar to that described
above is very close to the real speed, with variations within 3 km/h, depending on the expert that performs the recon-struction.
PC-Crash® records many parameters in addition to the collision speed during the simulations and the output data can be shown in tables or graphs. However, dynamic para-meters and multibody accelerations, contact forces or energy have not been taken into account for this study because of the limitations of this program in terms of material properties, deformations and biomechanical behavior.
3. CLASSIFICATION MODEL
3.1. Tree Growth and Model Development
The method of classification trees was used to find the most influential variables and to analyze their effects and interactions. This is an effective technique for studying complex systems with many variables, such as vehicle-pedestrian collisions.
Classification and regression trees (Breiman et al., 1984) are hierarchical statistical techniques suitable for exploring the data set, detecting all significant interactions and developing chart models that illustrate how the response variable depends on the explanatory variables.
For multivariate models developed to study vehicle-pede-strian collisions, the response variable is usually a variable that measures the pedestrian injury severity. When working with complex FEM models or performing laboratory tests, the response variable is usually the Head Injury Criterion (HIC) (Mizuno and Ishikawa, 2001). The HIC value quanti-fies the severity of head impact based on its acceleration during the contact.
Because PC-Crash uses simplified multibody models that cannot reliably simulate biomechanical behavior, material properties or deformations as complex FEM models do, the head acceleration of the multibody model is considered an indicative value rather than a reference.
The pedestrian fatality risk was the dichotomous response variable for the classification tree. This variable has been used quite often in predictive models. The two possible values (fatality =1 or survival=0), were known in each case.
The SPSS statistical program was used to create the classification tree. Sixteen explanatory variables were initial-ly introduced as input. Table 1 describes the main charac-teristics of each variable.
The target category of the response variable for classi-fication is "1 =fatality". To reduce the risk of error associat-ed with an incorrect classification, the relative cost of mis-classifying a pedestrian fatality as a survivor was 2.3 times higher than that of misclassifying a survivor as a fatality. This relative penalty also served the function of offsetting the initial distribution of pedestrian fatalities or survivors, which is not homogeneous.
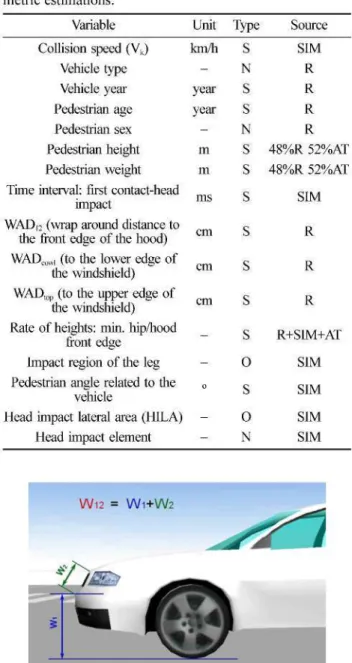
Table 1. Description of input variables. The type is denoted by: S=scale, 0=ordinal, N=nominal, and the data source is classified into SIM=Simulation, R=reality AT=Anthropo-metric estimations.
Variable Unit Type Source
Collision speed (Vk)
Vehicle type Vehicle year Pedestrian age Pedestrian sex Pedestrian height Pedestrian weight Time interval: first contact-head
impact
WAD 12 (wrap around distance to the front edge of the hood) WADC0W| (to the lower edge of
the windshield) WADtop (to the upper edge of
the windshield) Rate of heights: min. hip/hood
front edge Impact region of the leg Pedestrian angle related to the
vehicle
Head impact lateral area (HILA) Head impact element
km/h -year year
-m m ms cm cm cm -0
-s
N Ss
N Ss
s
s
s
s
s
0
s
0 N
SIM R R R R 48%R 52%AT 48%R 52%AT
SIM R R R R+SIM+AT
SIM SIM SIM SIM
W12 = W1+W2
£)m
•
» 1
®
J^^
—Figure 5. Wrap around distance from the ground to the front edge of the hood (WAD12).
variables introduced in the initial model, the algorithm kept only the most significant three, which had the largest influence on the response variable. These variables are:
a) Vk[km/h] - Collision speed.
b) WAD12 [cm] - Wrap around distance to the front edge of
the hood (Figure 5).
c) HILA - Head impact lateral area, from 1 to 12 (Figure 6).
The CHAID algorithm splits the independent variables into discrete intervals for classification. In SPSS, the default
Figure 6. Lateral pedestrian head impact region.
is 10 intervals for each variable, but this number can be modified. Given the range of values obtained from recon-structions, 24 intervals were specified for Vk and 16 for
WAD12.
3.2. Variable Interactions and Classification
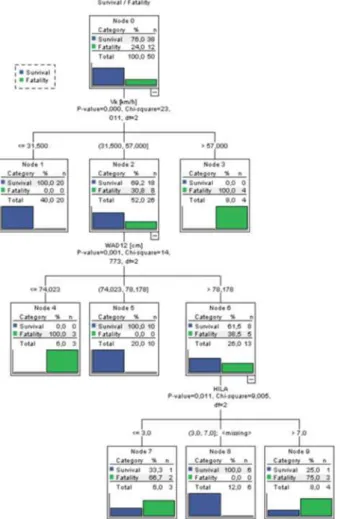
The resulting classification tree grew into three deep levels (Figure 7). The first splitting criterion was the collision speed, with a likelihood ratio Chi-squared statistic of 23.011 and a p-value less than 1.00725 x 10⁻⁵. This first branching clearly differentiates between three levels (nodes) of colli-sion speed:
- Node 1: Vk 31.5 km/h - Low speed collisions. In these 20
cases, the pedestrians always survived.
-Node 3: Vk> 57 km/h - In collisions with this impact
speed or higher, no pedestrian survived.
- Node 2: 31.5 km/h < Vk ^ 57 km/h - Within this range of
speeds, pedestrians died in 30.8% of cases.
This first classification fits with most probabilistic models for the pedestrian fatality risk in which the probability of death depends on the collision speed and is represented by an "S" shaped curve, in which the exponentially growing region is usually between 30 and 60 km/h (Oh et al., 2008, Rosen and Sander, 2009).
It is noteworthy that the classification model selected the collision speed as the most significant variable for pede-strian death or survival, in compliance with earlier studies.
Node 2 contains an important population of both fata-lities and survivors, so it had to be further developed with another criterion. The CHAID algorithm performed a new split on this node through the variable WAD12.
In most cases, WAD12 determines the pedestrian turnover
axis and, along with pedestrian height, affects the minimum hip height, pedestrian-vehicle coefficient of friction, the trajectory of the head during the collision and therefore the point of impact on the vehicle. This happens almost independently of the collision speed, as shown by Untaroiu
et al. (2007).
The split from WAD12 is relevant (p-value < 6.2 x 10⁻⁵)
vehicle is very low. The main common aspects of these accidents are: the pedestrian turnover axis on the front of the hood is somewhere around the low region of the femur above the knee, causing closed fracture of the leg with torn ligaments; the hip and lower thorax impact the front of the hood, causing a major dent in it; the head impacts a rigid region at the lower edge of the windshield or on the cowl, in a strong impact that breaks the windshield over a wide area and causes a severe head injury, resulting in the main reason for pedestrian death. •Node 5: In these accidents, the front edge height of the vehicle is within a medium range. Although the number of cases is greater than in the previous node, the collision speeds are similar as are the pedestrian characteristics. In particular, in this group of cases the bumper of the vehicle strikes the pedestrian femur and, in 80% of cases, does not produce serious injuries in the lower extre-mities. The pedestrian hip impact is on the hood over the front edge, except in one case of a 5-year old child. The head hits the windshield on the lower edge or slightly above on the cowl, but in these cases the area of the broken glass is smaller, so the impact is less violent. The injuries to pedestrians struck in this group are mostly
SUfftVll / FJUIity
, • Survival • I " F a t a l i t y ¡
Nod
• Survival
• F f U l i f r Tetal
6 0 * r 78.0 3S 24.0 1 Í 100,0 30
~~3
P-vjlg*=Q.QQO. Crti-¡quarí=23.
_L
H o d i l C a t t f l i i y * n • Survival • Fatality
T t f i l KHJ0 2D
4 0 A 2 Q
Nod
• Survival
T c t i l
1 2
ao.2 i s 30.8 8 52.C 26
1=1
1 M e d i O
• Fatality
T Í 1*1 0.0 J.O0.0 e.o ft 0 4 •i WAD12 [flm] • J UÍ H H01 Chi-!Q,tiart"1'
7 7 3 . fl>2
Cattgflrw S •. i. •• j I f a t a l i t y :•: J . j
(74-023. 73.176]
N o d i
• Survival 1D0.0 i o
• FjtalHy 0.0 0
> 7S.173
' • . : - • • .I i F a m i t y
t-%0
_L_
H l l > P - v * h i t " 0 , O l 1, Ch isq ua ie30.005,
d f " 2
p j G , 7 j O | ; írrnjsing>
• ' .ll-^n-y *t n
i S u r v i v e 33,3 1 F j t i l i r y 0 0 , 7 j Teta I 8.0 3
• •
N « d c 8
• &.JO. . . J I
Total 100,0 12,0 „ i 1 Modi
~ .\\-r. •••
m Survival
• FJUJHv Total 75 0 S.'j n I J
serious, especially the head injuries, but all of them survived.
-Node 6: In this group, the head impact against the windshield is the main injury mechanism and has severe consequences. In all of the pedestrian fatalities at this node, the head impact is located on rigid areas of the cowl or on the hood-windshield junction, regardless of the collision speed.
The last three nodes (leaves) sprout from node 6, based on HILA. The Chi-squared of this split is 0.05, and its p-value is 0.011.
Although there are three new nodes, the classification must be interpreted as two groups:
- Node 8: The pedestrians in this group all survived despite suffering severe head injuries, and it stands out that in all cases the pedestrian head hit the windshield around the center or within a certain distance from the margins (pillars or cowl), where the stiffness is lower than at the edges.
- Nodes 7 and 9: These two nodes represent a single group in which the pedestrian head hit the lateral borders on rigid areas. Almost all pedestrians within this group died, except for two cases in which the pedestrians survived despite suffering severe injuries to the head and other regions of the body. In both cases, the pedestrians were young males, one of whom (node 7) survived despite a vehicle collision speed of 50 km/h. A possible expla-nation for this is that there was no rigid object under the hood, even near the lateral edge at the head impact point. In the other case, the collision speed was 34 km/h and it seems that somehow the head impact on the windshield was not hard enough to fracture the glass.
Thus, the entire tree represents a diagram to analyze, group, classify and conveniently predict the causes of pede-strian fatality while considering a large number of para-meters. From a statistical standpoint, the tree has a good response. Table 2 contains the gains of the nodes. As it shows, all of the gains of the tree are in the terminal nodes (leaves): 3, 4, 7 and 9. These explain all of the fatalities and are completely homogeneous.
The estimated misclassification risk is 4%, with a 2.8% standard error and is caused by the two singular cases
Table 2. Gain summary table for nodes. Growing method: CHAID. Dependent Variable: Survival/Fatality.
Node Gain
Figure 7. Classification tree (CHAID method).
Table 3. Prediction percentage of the classification tree.
Observed Survival Fatality Overall percentage
Fatality 36
0 72.0%
Predicted
Survival Percent Correct 2 94.7% 12 100.0% 28.0% 96.0%
mentioned above.
The overall percentage of correct classifications for the tree is 96%>, as shown in Table 3. Taking into account the 2.3 times higher cost of misclassification of the target category specified at the beginning, the errors occur only in predicting pedestrian fatalities that actually survived, as opposed to predicting survivals that actually died, which had to be avoided.
The initial selection of variables and the classification made by the CHAID growth method are justified both by the influence of the selected parameters in the dynamics of the impact and by the significance of the statistics, specifi-cally the error risk and gain.
4. BINARY LOGISTIC REGRESSION MODEL (LOGIT)
The classification tree described in the previous chapter makes an intensive selection of variables depending on their relevance and ¿identifies the interactions that influence the response variable. Next, a suitable model to quantify the effects of these interactions and the relationships among the independent variables and the other predictive variables was developed, as suggested by Burnham and Anderson (2009).
Taking into account the characteristics of the explanatory variables and also of the response, which is a dichotomous variable, binary logistic regression (logit) modeling was applied. The logit model predicts the probability of pede-strian fatality (internal value=l) or of survival (internal value=0) depending on the independent variables.
The generic expression of the logit probabilistic model is:
p=F(xTfi)=- ' T (1)
exp(x P) where:
p : pedestrian fatality risk, from 0=survival to l=fatality; x : vector of explanatory variables (regressors);
¡3: vector of coefficients.
Besides the three independent variables, all of the second-and third-grade interactions detected by the classification tree were included in the logit regression, taking into account that the model is hierarchical.
By using the backward stepwise Wald method, an iterative selection of the predictors was made in SPSS.
Unlike the classification tree, the logit model does not include missing values. Because one of the explanatory variables is the lateral head impact area, of the 50 cases considered the model excluded 5 (10%) in which the pedestrian head did not impact the vehicle.
The modeling process converged in 2 steps, with a total of 8 iterations in the first step and 9 iterations in the second. The Omnibus Test of Coefficients indicates that the model fits well and is statistically significant:
Chi-square=27.170 Degrees of freedom=6 p-value=1.341xl0(-4)
The obtained R-squared values of the model are:
Cox and Snell R-squared=0.453 Nagelkerke R-squared=0.66
The goodness of fit was also supported by the test of Hosmer and Lemeshow (2000), in which the null hypo-thesis - the current model, which fits well - was accepted in the second step with a Chi-square of 8.16 with 7 degrees of freedom and a p-value of 0.319.
The predictive potential of this model is 88.9%> with a cut-off value of 0.5. The result of the classification is presented in Table 4. The drawback is that four of the five misclassified cases were classified as survivors when they were actually fatalities, i.e., the unwanted situation.
Table 4. Overall classification of the logit model.
Predicted
Observed Survival/Fatality pe r c e n t a g e
Alive Dead Correct Step 2 Survival/Fatality Alive 32
Dead 4 Overall percentage
1 97.0% 66.7% 88.9%
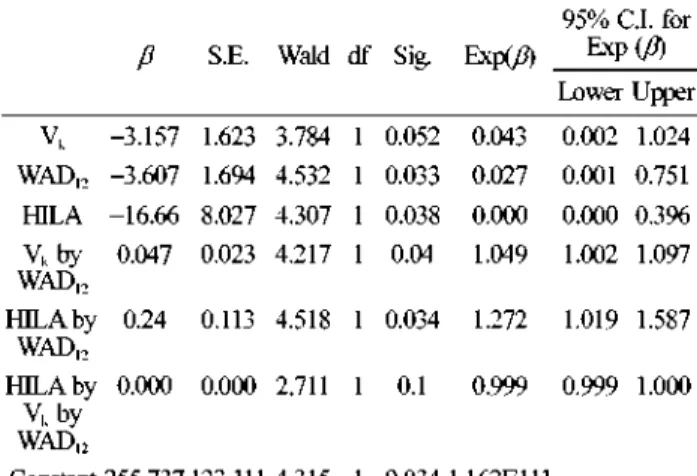
Table 5. Variables included in the logit model and their statistics.
v
kWADI2
HILA Vkby
WADI2
FULA by WADI2
HILA by Vkby
WADI2
P
-3.157 -3.607 -16.66 0.047
0.24 0.000
S.E.
1.623 1.694 8.027 0.023 0.113 0.000
Wald
3.784 4.532 4.307 4.217 4.518 2.711
Constant 255.737 123.111 4.315 df
1 1 1 1 1 1
1 Sig.
0.052 0.033 0.038 0.04 0.034
0.1
Exp(y?)
0.043 0.027 0.000 1.049 1.272 0.999
0.034 1.162E111
95% CI. for Exp(0) Lower Upper
In the backward stepwise method, all independent vari-ables and interactions considered were included in the model except for one: the second-degree correlation bet-ween the lateral region of head impact against the vehicle and the collision speed, which had a low significance score statistic.
The ¡3 coefficients of each variable in the equation and their statistics are shown in Table 5.
The effect of collision speed on pedestrian fatality risk seems to be an inverse relation because its ¡3 coefficient is negative; in fact, the influence of this independent variable is explained through the interaction of Vt and WAD12. A
possible interpretation of this result is that the collision speed is not the most important independent variable in predicting the pedestrian fatality risk within certain ranges in which most cases were considered (and also in which most vehicle-pedestrian accidents within urban areas occur). Rather, vehicle speed is important due to its interaction with other parameters, in this particular case, with the vehicle front edge height measured by WAD12. This
inter-action has already been noted in previous studies (Untaroiu
et al, 2007) that showed that the impact point of the head
and its trajectory do not depend only on the collision speed but also on the point at which the pedestrian hip impacts: below or above the front hood, sliding or not.
While the third-degree interaction between all variables is statistically significant, its ¡3 coefficient is almost zero, which means that their two second-degree interactions have sufficiently explained the variability.
The equation of the logit model adjusted in this study is:
vl - py
=255,737-3,15 K„-3,607W,2-16,66^//„.,+0,047K«Wi2+0,24»'p//„.i
(3)
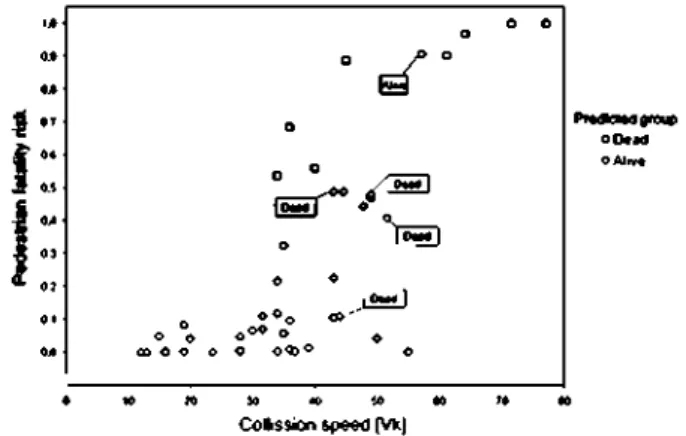
The graph of predicted values of pedestrian fatality risk as a function of collision speed (Figure 8) has a prob-abilistic distribution similar to the classic "S" shaped curve, but shows less homoskedastic adjustment between 30 and
c
CO O Í) c
•
•
O °
c
• a
¡Alrrt|
1°""]
Jo—1
o K > a o ! 0 4 0 6 e e o 7 Q a
Co Mission speed [Vk]
Figure 8. Pedestrian fatality risk as a function of collision speed. Predicted values and misclassified cases.
60 km/h. Misclassified cases appear within this range. This is precisely because the pedestrian death or survival is affected not only by the collision speed but also by other explanatory variables, some of which are not available and therefore are not included in the model. These cases have been labeled on the chart.
It is interesting to note that the significant interactions between regressors included by the logit model are the same as those identified through the branches of the classi-fication tree. The interaction of Vk and WAD12 is precisely
the split of node 2 into nodes 4, 5 and 6 (Figure 7), the interaction between WAD12 and HILA is the split of node 9
into leaves 7, 8 and 9, while the other second degree inter-action, Vk and HILA, is not included in the tree and is also
rejected by the logit model (p-value=0.1).
5. DISCUSSION
The model developed in this study has two complementary components. The first is a classification tree. This powerful statistical method performs an initial filtering of the 16 input parameters used in this study and selects three of them as having the most significant effects on the response variable. The classification tree characterizes the variables, making it easy to detect commonalities among the cases and clearly identify the relevant interactions.
Based on the results of the classification tree, the second part of the model is a logistic regression developed to quantify the influence of the regressors (already identified by the classification tree) and their interactions on the response variable.
This study was performed with a sample of 50 accidents that occurred in Madrid. The sampling criteria were based on the quality of the information available for each acci-dent, rather than the representativeness of the injury levels, so the sample included 12 fatalities, 34 severely injured, 3 slightly injured and 1 casualty for which the injury level is uncertain, but the relevance of the results is supported by both the commonalities with previous findings regarding vehicle-pedestrian collision kinematics obtained using other research techniques and by the statistical significance of the model.
The resulting fatality risk model is limited by the sample characteristics, but the methodology developed to detect the influence of other parameters besides the collision speed can be further extended to study a wider range of accidents in Madrid or any other city.
6. CONCLUSIONS
performs several functions: variable filtering, classification, prediction, interaction detection and quantification of vari-able influence.
Accident reconstructions were performed using advanced techniques to accurately estimate the diverse parameters of the collision phase and of the pre- and post-impact phases. The data were collected from the accident database develop-ed by the Accidentology and Vehicle Dynamics Department of INSIA.
The compound model proves that, within the range in which most accidents take place inside urban areas, the collision speed is not the most significant factor for predict-ing the pedestrian fatality risk; rather, the most important factor is the interaction of collision speed with other para-meters, in this particular case, the front edge height of the vehicle.
The interaction between collision speed and front edge height is more relevant to the severity of pedestrian head impact than the speed alone, because this interaction deter-mines the head trajectory, acceleration and collision point against the vehicle.
Multi-disciplinary approaches such as this study make the identification of critical parameters easier and simplify the development of practical solutions by quantifying their potential impact on future measures to improve pedestrian safety.
ACKNOWLEDGEMENTS-This study benefited from the accident database developed by Accidentology and Vehicle Dynamics Department of INSIA within the ABIDA project funded by Spain Ministry of Science and Technology through the National R&D Program (2000-2003). This research was sup-ported by the Madrid Regional Ministry of Education and the European Social Fund (ESF) through the Research Personnel Support Program of Madrid Autonomous Community. C. Gonzalez work was also supported by Spanish Ministry of Education, Culture and Sport under contract MTM 2005-08897. Special thanks to Mr. James Lenard, Research Fellow of VSRC-Loughborough University for his important redaction suggestions and observations.
REFERENCES
Benjumea, A. (2001). Datos Antropométricos de laPoblación Laboral Española. Instituto Nacional de Seguridad e Higiene en el Trabajo, [online]. Available at : http:// www.insht.es/portal/site/Insht/menuitem.3cf21 cd4ca9db 1 e6f 124b07db5d061 ca/?vgnextoid=a90aaf27aa652110 VgnVCM 100000dc0ca8c0RCRD&showTree=true&tip o=555aaf27aa652110VgnVCM100000dcOca8cOTAXC. [accessed: 17th October 2007].
Bovenkerk, J., Lorenz, B., Guerra, L. and Neal-Sturgess, C. (2007). Pedestrian Protection in Case of Windscreen Impact. Integrated Project on Adavanced Protection Systems [online]. Available at: http://www.aprosys.com/
Documents/crash.tech_ikaRWTH.pdf. [accessed: 13th October 2008].
Breiman, L., Friedman, J., Olshen, R. and Stone, C. (1984).
Classification and Regression Trees. Wadsword
Inter-national Group. CRC Press. Belmont. California. Burnham, K. and Anderson, D. (2009). Model Selection
and Multimodel Infereference. 2nd edn. Springer Verlac.
New York.
Commission of the European Communities (2001). White
Paper-European Transport Policy for 2010: Time to Decide. Brussels.
Commission of the European Communities (2003).
Com-munication from the Commission-European Road Safety Action Programme. Halving the Number of Road Acci-dent Victims in the EU by 2010. Brussels.
ERSO (2008). Annual Statistical Report 2007 Based on
Data from CARE/EC [online]. Available at: http://www. erso.eu/data/content/statistical_report.htm#_Statistical_ Report, [accessed: 2nd July 2009].
DGT (España. Ministerio del Interior-Dirección General de Tráfico DGT) (2009). Anuario Estadístico de Accidentes
2007. Madrid.
Han, I. and Brach, R. (2002). Impact throw model for vehicle-pedestrian collision reconstruction. Proc. Institution
of Mechanical Engineers, Part D: J. Automobile Engi-neering 216, 6, 443-453.
Hosmer, D. and Lemeshow, S. (2000). Applied Logistic
Regression. 2nd edn. Wiley. New York.
INSIA, Applus IDIADA, CENTRO ZARAGOZA and SERNAUTO. (2008). Investigación Industrial en la
Pro-tección de Peatones a Partir del Estudio en Profundidad de Accidentes de Tráfico en Madrid. Zaragoza y Barcelona.
(Informe Proyecto FIT-370100-2007-51). Madrid. 2005. INSIA (2005). Estudio Accidentológico, Biomecánico y
Dinámico de Atropello de Peatones-ABIDA (n° referencia:
DPI2001-2818). Madrid.
Kass, G. (1980). An exploratory technique for investigating large quantities of categorical data. J. Royal Statistical
Society. Series C (Applied Statistics) 29, 2, 119-127.
Koch, W and Howard, M. (2005). Comprehensive ap-proach to increased pedestrian safety in pedestrian-car accidents. Proc. Institution of Mechanical Engineers,
Part D: J. Automobile Engineering 217, 7, 513-519.
Lawrence, G. (2005). The next steps for pedestrian pro-tection test methods. Proc. 19th Int. Technical Conf.
Enhanced Safety of Vehicle. Washington D. C.
Mizuno, Y. and Ishikawa, H. (2001). Summary of IHRA pedestrian safety WG activities-Proposed test methods to evaluate pedestrian protection afforded by passanger cars. Proc. 17th Int. Technical Conf. Enhanced Safety of
Vehicle. Amsterdam.
Moser, A., Hoschopf, H., Steffan, H. and Kasanicky, G (2000). Validation for the PC-Crash pedestrian model.
SAE 2000 World Cong.. Detroit, Michigan.
Nagatomi, K., Hanayama, K., Ishizaki, T, Sasaki, S. and Matsuda, K. (2005). Development and full-scale dummy tests of a pop-up hood system for pedestrian protection.
Washington D.C.
Oh, C, Kang, Y, Youn, Y. and Konosu, A. (2008). Develop-ment of probabilistic pedestrian fatality model for charac-terizing pedestrian-vehicle collisions. Int. J. Automotive
Technology 9, 2, 191-196.
Rosen, E. and Sander, U. (2009). Pedestrian fatality risk as a function of car impact speed. Accident Analysis and
Prevention 41, 3, 536-542.
Schmidt, D. and Nagel, D. (1971). Pedestrian impact case study. Proc. 15th Conf. American Association for
Auto-motive Medicine. New York.
Shen, J. and Jin, X.-L. (2008). Improvement in numerical reconstruction for vehicle-pedestrian accidents. Proc.
Institution of Mechanical Engineers, Part D: J. Auto-mobile Engineering 222,1, 25-39.
Shin, M., Park, K. and Park, G. (2008). Design of the active hood lift system using orthogonal arrays. Proc.
Institu-tion of Mechanical Engineers, Part D: J. Automobile Engineering 222, 5, 705-717.
Simms, C. and Wood, D. (2006). Pedestrian risk from cars and sport utility vehicles - A comparative analytical study.
Proc. Institution of Mechanical Engineers, Part D: J. Automobile Engineering 220, 8, 1085-1100.
Untaroiu, C , Meissner, M., Crandall, J., Takahashi, Y, Okamoto, M. and Ito, O. (2008). Crash reconstruction of pedestrian accidents using optimization techniques. Int.
J. Impact Engineering 36, 2, 210-219.
Untaroiu, C , Shin, J., Ivarsson, J., Crandall, J., Takahashi, Y, Akiyama, A. and Kikuchi, Y (2007). Pedestrian kinematics investigation with finite element dummy model based on anthropometry scaling method. Proc. 20th Int.
Technical Conf. Enhanced Safety of Vehicle. Lyon.
Wood, D., Simms, C. and Walsh, D. (2005). Vehicle-pede-strian collisions: Validated models for pedeVehicle-pede-strian impact and projection. Proc. Institution of Mechanical Engineers,
Part D: J. Automobile Engineering 219, 2, 183-195.
World Health Organization (2004). World Report on Road
Traffic Injury Prevention. Geneva.
Xu, J., Li, Y, Lu, G and Zhou, W. (2009). Reconstruction model of vehicle impact speed in pedestrian-vehicle accident. Int. J. Impact Engineering 36, 6, 783-788. Yang, J., Yao, J. and Otte, D. (2005). Correlation of
differ-ent impact conditions to the injury severity of pede-strians in real world accidents. Proc. 19th Int. Technical