C 0
2Sink Effect of Concrete Carbonation
I. Galan1, C. Andrade1, P. Mora2, M. A. Sanjuan3, J. C. Lopez-Agtti3, M. Prieto1
'Eduardo Torroja Institute IETcc-CSIC, Serrano Galvache 4, 28033 Madrid, Spain. Email: <isabelsalan&ietcc.csic.es>, <andrade(a>,ietcc.csic.es>, <mprietorícÉietcc.csic.es>.
Oficemen, Jose Abascal 53, 28003 Madrid, Spain. Email: < pmora(cúíoficemen.es>.
3IECA, Jose Abascal 53, 28003 Madrid, Spain. Email: <masaniuan(a)lieca. es>.
<direccion(a),ieca.es>.
ABSTRACT
Although carbonation of cement phases is well known, the amount of carbon dioxide combined during the process has been much less investigated. Related to the greenhouse effect much more attention is being paid to the sinks for C02 in order to correctly compute the gases emission during production of materials. In the case of cement a strict calculation should discount the C02 emitted from that fixed by the concrete. This is the aim of present work which is a study of the cement based materials ability to combine C02. Using Thermogravimetry and Differential Thermal Analysis as well as phenolphthalein indicator, quantities of C02 combined and carbonation depth in several cement pastes and concretes exposed to different environments have been measured. A calculation to estimate the contribution of cement based materials carbonation to the partial re-absorption of the C02 emitted in cement production is proposed.
INTRODUCTION
Carbonation of concrete occurs when the C02 from the atmosphere reacts with alkaline components of the concrete, resulting in the formation of CaC03. This reaction leads to a decrease in pH of the aqueous phase of the concrete pores, from very alkaline values greater than 12 to values below 8. If the reaction reaches the steel reinforcement, its passive layer may disappear, exposing the steel surface to corrosion.
Considering corrosion and pH lowering, the Spanish Instruction for Structural Concrete, EHE, establishes minimum requirements for cover thicknesses of reinforcement based on the aggressiveness of the environment where the element will be placed, on the cement type, on the concrete characteristic strength and on the service life of the element, ensuring that if it is strictly fulfilled, the reinforcement will not be reached by the carbonation front within the service life time of the element considered.
The main objective of this study is to estimate the quantity of C02 that is reabsorbed into the cementitious materials due to the carbonation phenomenon, taking into account the composition of the cements, the environments in which the materials are exposed, the type of concrete and the time.
EXPERIMENTAL
The work developed for this study consisted on experiments and calculations to determine the quantity of C02 absorbed per gram of cement in specimens fabricated for the study, as well as in old samples. In order to supplement the data of the study, an exhaustive review of published work related to the measure of the amount of C02 combined or CaC03 formed in materials made of cement has been conducted.
Specimens. Cements. Exposure environments
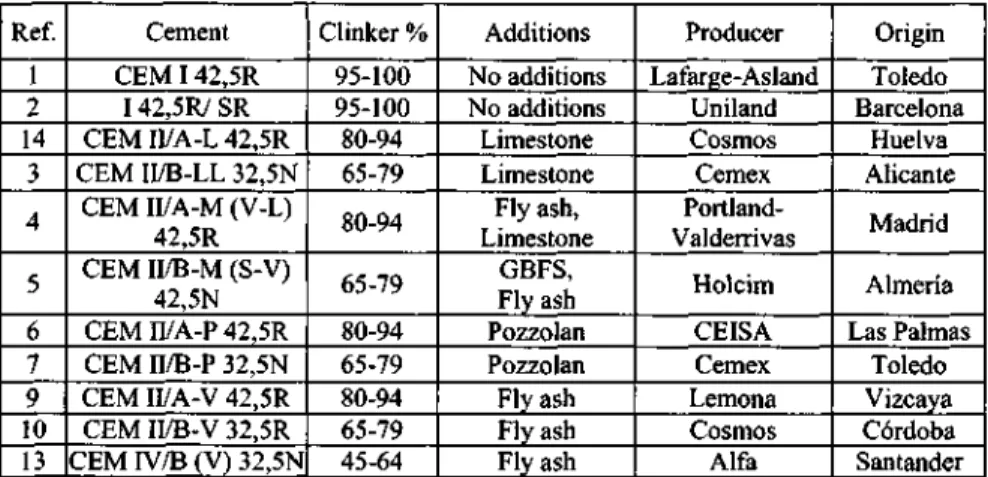
For the manufacture of the specimens 15 types of cement produced in Spain have been used. Their names, additions, producer and geographical origin are given in Table 1. With each type of cement 10mmxl0mmx60mrn prismatic paste specimens and 75mmxl50mm cylindrical concrete specimens were produced.
Table 1. Cements Selected for the Tests
Ref. 1 2 14 3 4 5 6 7 9 10 13 Cement CEM 142.5R 142,5R/ SR CEM II/A-L 42,5R CEM II/B-LL 32,5N
CEM II/A-M (V-L) 42,5R CEM II/B-M (S-V)
42.5N CEM II/A-P 42,5R CEM II/B-P 32.5N CEM II/A-V 42,5R CEM II/B-V 32,5R CEM rV/B (V) 32,5N
8 15 11 12
CEM II/A-S 52,5N III/A 42,5N/SR III/B 32,5N/SR III/C 32,5N/SR/BC 80-94 35-64 20-34 5-19 GBFS GBFS GBFS GBFS Tudela Veguin Tudela Veguin Alfa Cemex León Oviedo Santander Tarragona
Two water/cement (w/c) ratios were used for the mixtures: 0.6 and 0.45. For the specimens with w/c 0.6 cements numbered 1-12 were used, for the ones with w/c 0.45 all 15 were used. The mix proportions for the concretes are in Table 2.
Table 2. Concrete Mixes Mix A: building works Cement
Gravel 6-12 mm Sand 0-2 mm
Water w/c 300 kg 1144 kg 820 kg 180 kg 0,6
Mix B: civil works Cement
Gravel 6-16 mm Sand 0-2,5 mm
Sand 0-5 mm Water w/c 400 kg 949 kg 297 kg 614 kg 180 kg 0,45
Mix A is considered representative of concrete used for building works, and mix B for civil works. In the mixing of B concretes a fluidifying additive was used in order to obtain acceptable consistencies.
In order to reproduce the most possible real conditions, the curing period of the specimens was set at 48 hours, 24 before demolding and 24 once demolded. Paste and concrete specimens were subjected to three different environmental conditions: outside not sheltered from rain, outside sheltered from rain, and inside. The three environmental conditions were located in Madrid.
In addition to the specimens manufactured specifically for the study, samples from old structures and specimens were taken and analyzed in order to evaluate if time affects the amount of C02 reacted. As for the old specimens, three types of concrete specimens manufactured in 1991, 1999 and 2001 respectively, were selected. The specimens from 1991 were 7cmx7cmx28cm prisms fabricated with 395 cement kg per concrete m3 and six different experimental mixes: two without additions, two with fly ash, one with silica fume, and one with both fly ash and silica fume. For all mixes plasticizers and superplasticizers were used. The specimens were kept outside sheltered from rain. The specimens from 1999 were 7,5cmxl5cm cylinders fabricated with 400 cement kg per concrete m3 and microsilica and fly ash additions as well as superfluidifier. These specimens were kept inside. The specimens from 2001 were made from a concrete used to build a house. A standard mix for building works was supposed for making the calculations, that is, 300kg/m3 and 0,5 w/c ratio. The specimens were kept the first four years outside not sheltered from rain and the rest of the time sheltered from rain.
Characterization techniques
Samples of the fabricated specimens as well as samples taken from old specimens and structures were characterized by Thermogravimetry, TG, and Differential Thermal Analysis, DTA, tests. At the age of the test the depth of carbonation was measured by phenolphthalein coloration in all specimens. The characteristic parameters of environmental conditions, i.e. temperature, relative humidity, precipitation and CO: concentration were measured regularly both inside and outside.
RESULTS OF THE STUDY Environmental conditions
The data of relative humidity (RH), temperature, precipitation and environmental C02 concentration measured in the test period of the specimens fabricated for the study are in the following ranges (Table 3):
Table 3. Environmental Conditions during Test Period
Temperature (°C) RH (%) TC021 (ppm) Daily precipitation (mm)
Inside 13-25 24-68 500-850
Outside 0-31 27-97
500 0-39.6
Carbonation depths and rates
In the paste specimens made for the study it was found a similar behaviour in the carbonation depth with respect to the exposure environment. In general, specimens that were outside sheltered from rain presented maximum depth after 1 year, appearing colourless all the area tested. Specimens inside also presented fully carbonated the cross section, but in this case with very soft pink colour, i.e., indicating that they have been carbonated, and that the pH has dropped below 12, but not below 8. Finally, in the specimens outside not sheltered from rain about half of them presented maximum depth colourless and the other half partial depth. These results were found in all paste specimens with 0.6 w/c ratio. For the ones with 0.45 w/c ratio there were a few exceptions: specimens with maximum carbonation depth in the three environments and specimens with partial penetration depth in the three environments.
In figures 1 and 2 the rates of carbonation for the concrete specimens with 0.6 and 0.45 w/c in the three exposure environments are represented. The carbonation rate was calculated with the formula x=kt . The specimens are grouped according to type of additions, with the reference numbers shown in Table 1.
In general, the specimens that were kept outside sheltered from rain are the ones with the highest carbonation rates, while the ones that were kept inside present the lowest rate. In this sense the 0.45 w/c specimens present a more homogenous behaviour than those with 0.6 w/c. It's interesting to emphasize the increase in depth with the percentage of addition within some of the groups of cement types; this effect is indicated by arrows in figures 1 and 2. Concrete specimens 1 and 2 made with cement without additions show a very similar behaviour in the rate of carbonation in each of the environments, with both the 0.6 w/c and the 0.45. The fact that one cement is resistant to sulphate and the other is not, does not appear to have an effect on the rate of carbonation.
18
16
r"
CONCRETE w/c 0.6
A
A
• INSIDE
B OUTSIDE
AOUTSIDE SHELTERED
1 2 3 4 5 6 7 9 10
no limestone various pozzolan fly ash
11 12
GBFS
Fig. 1. Carbonation Rates of Concrete Specimens 0.6 w/c
CONCRETE w/c 0,45 «INSIDE
m OUTSIDE
A OUTSIDE SHELTERED
1 2 14 3 4 5 6 7 9 10 13
no limestone various pozzolan fly ash
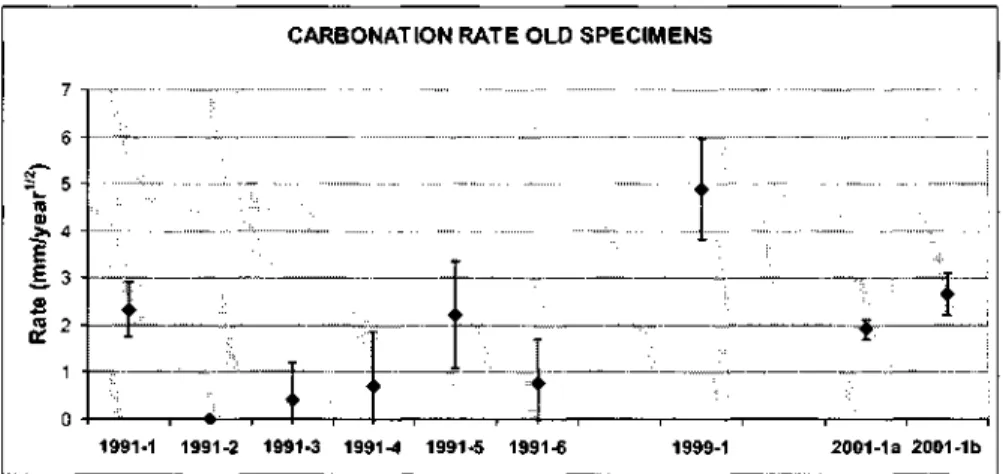
The graph in figure 3 represents the carbonation rate of the old specimens. Most of them present a rate lower than 3 mm/year12, not reaching four of the specimens made in 1991 the rate of 1 mm/year12. The specimen fabricated in 1999 is the one which presents the higher rate, close to 5 mm/year12.
CARBONATION RATE OLD SPECIMENS
1991-1 1991-2 1991-3 1991-4 1991-5 1991-6 1999-1 2001-1a 2001-1b
Fig. 3. Carbonation Rates of Old Specimens
Some of the authors that have studied the natural carbonation phenomenon from the point of view of calcium carbonate formation are Parrott, L. J. (1989), Parrott L. J. (1991/92) and Houst Y. F. (2002). These authors have also published the corresponding data of carbonation rates. As the environmental conditions and type of specimens are very different these data are not easily comparable but, in any case, it should be noticed that none of the rates published by theses authors exceeds 6.5 mm/year1'2.
Quantities of combined C02
Fig. 4. CO2 Quantities Absorbed in Paste Specimens 0.6 w/c
The behaviour of the 0.6 w/c specimens (Fig. 4) is very homogeneous with regard to the influence of the environment on the absorption capacity. It can be clearly observed that the specimens that absorb less C02 are those who remained in the laboratory, not reaching values higher than 6%. On the contrary, the ones that absorbed more are the ones that were outside not sheltered from the rain which reach values of absorption of 12 g of C02 per 100 grams of cement in the carbonated zone. The specimens that stayed the outside sheltered from rain absorb between 5 and 10% of C02 per gram of carbonated cement.
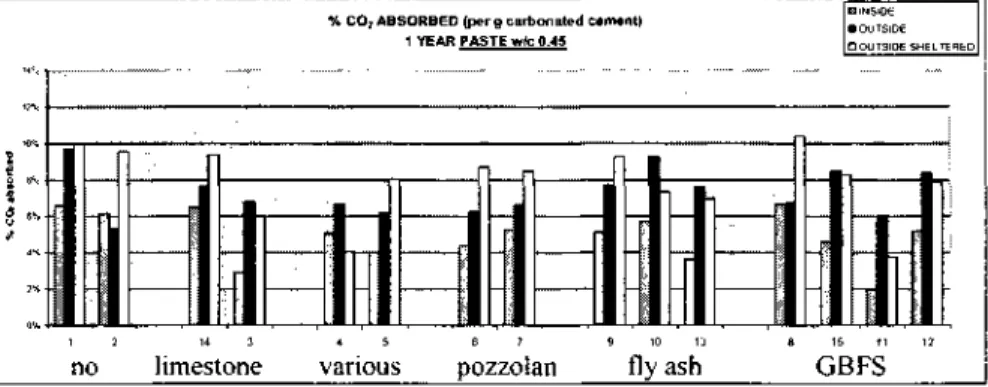
% CO, ABSORBED (per g carbonated cement) 1 YEAR PASTE w/c 0.45
H INSIDE • OUTSIDE DOUTSIDE SHELTER!
no limestone various pozzolan fly ash GBFS
Fig. 5. CO2 Quantities Absorbed in Paste Specimens 0.45 w/c
In the w/c 0.45 specimens (Fig. 5) also the specimens held inside are the ones which absorb less C02, with the exception of specimen 2 without additions and specimen 4 with fly ash and limestone. Now, however, the specimens that absorbed more are in half of the cases those sheltered from rain and in the other half the ones not sheltered.
The behaviour of the two groups of concrete specimens, w/c 0.6 and 0.45, is similar to the paste specimens with 0.6 w/c with regard to the environments. In almost all cases the specimens that absorb less are the ones inside and the ones that absorb more are the ones outside not sheltered from rain. In general, with few exceptions, the specimens of concrete made with w/c 0.45 absorb less C02 than the specimens made with w/c 0.6, being the percentages of absorption quite similar to those found in the paste specimens.
cannot be explained because of the difficulty of knowing exactly the repairs, alterations and paintings which have suffered the old structures throughout their life.
% C O ¡ ABSORBED OLD SPECIMENS AND S T R U C T U R E S (per g c a r b o n a t e d cement)
20% 18% 16% 14% 12% 10% 8%
1—1
r
•~
i r
1
f T l
"T "
"
1
—
;
i
1
*t '
j
n-1991-1 1991-2 1991-3 1991-4 1991-5 1991-6 2001-1a 2001-1b Hippo Hippo
up down
Fig. 6. C 02 Quantities Absorbed in Old Specimens and Structures
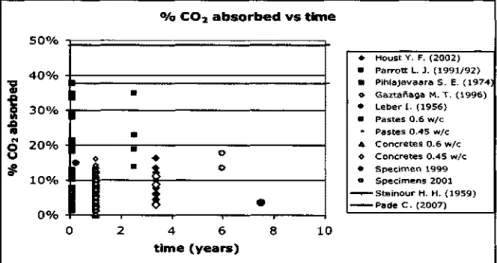
Finally, figures 7 and 8 represent all the data collected in this study of C02 absorbed as a function of time, both for specimens made for the study and the old ones, as well as for the data collected from the literature.
Figure 7 represents data from 0 to 10 years and figure 8 from 10 to 80 years. The two horizontal lines represent the maximum possible absorption calculated according to the formula of Steinour, H. H. (1959) and Pade, C. (2007), respectively, who believe that up to 78.5% and 75%, respectively, of the CaO present in the cement can be carbonated. Since these are different samples and different conditions the values can not be compared directly, however, it can be said that in most cases absorptions above 20% are not reached.
°/o C 02 absorbed vs time
I 1
m
•
.„„.
ir i • *
0%
-i—
o
* *
4 6 time (years)
10
H o u s t Y . F. (2002) Parrott L. J. ( 1 9 9 1 / 9 2 ) Pihlajavaara S. E. (1974) Gaztañaga M. T. (1996) Leber I . (1956) Pastes 0.6 w/c Pastes 0.45 w/c Concretes 0.6 w / c Concretes 0.45 w/c Specimen 1999 Specimens 2001 - S t e i n o u r H. H. (1959) -Pade C. (2007)
% C O , absorbed vs time
0 %
-X
i
A ± - i
• O
O
* Parrot L. J. (1989) • Rib
A Specimens 1991
o Hippodrome - i — S t e i n o u r H. H. (1959)
Pade C. (2007)
10 20 30 40 50 60 70 80
time (years)
Fig. 8. Quantities of CO2 Absorbed as a Function of Time 10-80 Years DISCUSSION OF RESULTS
Indicator parameters and characterization techniques in carbonation
The depth of carbonation x, measured by the technique of phenolphthalein coloration, and the carbonation rate k calculated from the formula x=k't1,2, are parameters of interest in studying the corrosion of steel reinforced concrete, identifying the change in pH, however, these parameters do not provide any information on the amount of calcium carbonate formed in the concrete, since no direct relationship has been found between the depths of carbonation, measured by the technique of phenolphthalein, and the quantities of calcium carbonate formed, measured by Thermogravimetry and Differential Thermal Analysis,
The amount of C02 absorbed or combined per gram of carbonated cement is a key parameter not only to calculate the ability of cement based materials to re-absorb carbon dioxide, but also to model the progress of carbonation.
Influence of the different variables on the carbonation Exposure environments
In the internal environment, with temperatures ranging 13-25 ° C, RH 24-68% and [C02] of 500-850 ppm, the amount of carbon dioxide combined in the specimens and the carbonation depth during the first year of exposure are considerably lower than in the external environment, with temperatures ranging 0-31 ° C, RH 27-97% and [C02] of 500 ppm, both sheltered and not sheltered from rain. This result indicates that the higher concentration of C02 in the interior does not imply a greater absorption of C02 in the range of C02 concentrations considered.
Type of cement
The influence of type of cement is also very important in the process of carbonation. There are significant differences in the resistance to carbonation (amount combined and carbonated depth) on the different specimens depending on the type of cement used, related both to the type of additions and to the amount of clinker per m3 of concrete. In general, with increasing amount of clinker, the amount of CaO increases, i.e. material subject to carbonate. When introducing additions to the cement it is important to take into account that the water/clinker ratio will increase, but it is also very important to know the contribution of the additions to the CaO content.
By increasing the amount of CaO generally increases the amount of C 02 absorbed and decreases the depth of carbonation, being the relationship with depth much more clear than the relationship with the combined C02. Both relationships become more evident when considering the groups of additions separately, and also by dividing them by environments. In any case, it is important to note the presence of exceptions.
Until now it can be stated that there is a combined dependence of the type of cement and the environmental conditions on the carbonation.
Life time
There are several models to predict the progress of the carbonation front, mostly based on the solution of Fick's law. The effectiveness of these models has been tested experimentally on numerous occasions; however, it is important to be cautious when using them as the constants of proportionality depend on many factors.
Regarding C02 combined there are very few models or proposals. The evolution of C02 combination with time is not evident. Young samples may have greater absorption than older ones. In general, the ones studied here do not exceed 20% of the cement amount of C02 absorption in the carbonated zone.
Composition of concrete
Calculation of C 02 absorption in structures
Once the carbonation depth and the CO, absorbed in the carbonated zone are measured for each type of concrete and exposure, it is possible to relate these data with real structures in order to calculate the CO; that will be re-absorbed during their service life. The third variable needed for this calculation is the exposed surface of the concrete structure, that is. the area susceptible to carbonate in each type of exposure. Multiplying the three terms bv the quantity of cement in the concrete, the amount of C 02 absorbed per concrete volume unit is obtained. Considering the relationship between cement production and CO; emissions, the quantity of CO; absorbed in cement based materials can be related to the C O: emitted during cement production.
C O N C L U S I O N S
Cement based materials recombine C 02 due to their alkaline character.
The combination of CO: by carbonation is influenced by the environmental exposure, mainly by the humidity. It is also influenced by the type of cement, amount of CaO and type and percentage of additions. Also the type of concrete affects the absorption of CO; primarily by the variation of porosity. Finally the dependence of the absorption of C O . over time is unclear and should be studied in depth in the future.
From the available data it can be said that the CO; absorption in the carbonated zone is below 20% per gram of cement both in young as in old samples.
Knowing the exposed surface susceptible to carbonate it is possible to calculate and estimate the amount of CO; that real structures will absorb during service life.
REFERENCES
Gaztañaga, M. T. (1996). "Influencia de la carbonatación en la microcstructura de diferentes pastas de cemento hidratadas." PhD. Universidad Complutense de Madrid. Spain. Houst. Y. F.. Wittmann. F. H. (2002). "Depth profiles of carbonates formed during natural
carbonation." Cement and Concrete Research 32. 1923-1930.
Leber. [., Blakey, F. A. (1956). "Some effects of carbon dioxide on mortars and concrete."
Journal of the American Concrete Institute 53, 295-308.
Padc. C . Guimaraes, M. (2007). "The C 0 2 uptake of concrete in a 100 year perspective."
Cement and Concrete Research 37, 1384-1356.
Parrott, L. J., Killoh, D. C. (1989). "Carbonation in a 36 year old. in situ concrete." Cement
and Concrete Research, 19 (4), 649-656.
Parrott, L. J. (1991/92). "Carbonation, moisture and empty pores." Advances in Cement
Research, 4 (\5), 111-118.
Pihlajavaara, S. E., Pihlman E. (1974). "Effect of carbonation on microstructural properties of cement stone." Cement and Concrete Research 4, 149-154.