Modeling Piezoelectric Harvesting Materials in Road Traffic Applications
M. VÁZQUEZ-RODRÍGUEZ, F. J. JIMÉNEZ and J. DE FRUTOS
Abstract: - The method to obtain electrical equivalent models of piezoelectric materials used in energy harvesting road traffic environment is presented in this paper. The experimental results are processed in order to determine the optimal topological structure and technology of the semiconductor elements used in the input stage of the power harvesting system. The non regulated power supply model under variable current demand is also presented.
Key-Words: - Electric model, energy harvesting, piezoelectric material.
1 Introduction
Green and efficient energy generation is a challenge not only in transport, urban and industrial sectors, but also for microelectronic devices and electronic systems. Table 1 resumes several applications related with piezoelectric devices used as micro-power genératers. Recently, powering sensor networks, monitoring devices and systems [17,18] related to civil infrastructures contribute the research in self-powered systems.
In order to obtain an electrical model of piezoelectric materials used as generators in road traffic applications a test bench [19] was developed to genérate the electric signáis produced by the piezoelectric materials in real traffic environment. In several cases is necessary associate the response of the material to an electronic circuit, to analyze generated power [20], use discontinuous conduction converters [21, 23] or adaptive circuits for remote applications [22]. In our case, using the characterization data collected with our road traffic test bench, the input stage electrical model of the energy harvesting system is obtained. This paper reviews the type and optimal topological structure of semiconductor elements to achieve optimal efficiency inthat stage.
2 Piezoelectric Model under Road
Traffic Stimulus
2.1 Test Bench
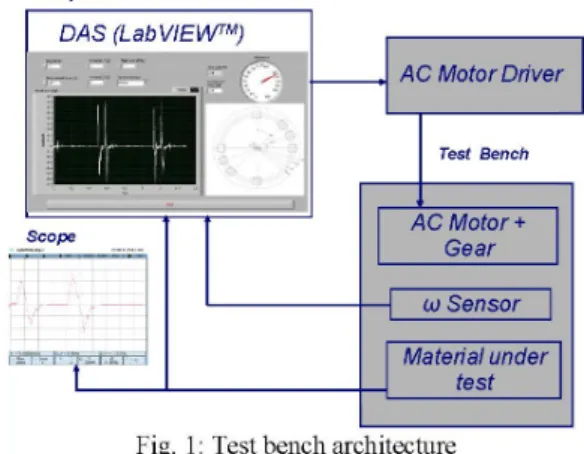
The test bench block diagram is presented in Fig. 1.
Computer
DAS (LabVIEW™) DAS (LabVIEW™)
AC Motor Dríver
i ?m
AC Motor Dríver AC Motor Dríver AC Motor DríverTest Bench
HlflHiH
i .- i
. Scope __ AC Motor +
Gear
•
Material under test Material under
test
' Material under test
Fig. 1: Test bench architecture
In Fig. 2 it's presented a picture with a test in progress.
Test in progress
test resume, at speeds between 14 and 116 km/h, and the peak voltage obtained in a piezoelectric cable.
TABLEl
PIEZOELECTRIC POWER GENERATION
Material Applications Dimensions Power
(H.W)
Power density (|xW/cm3)
Voltage (V)
Resistance (kQ)
Ref.
PZT Composites, d33 39 MPa compress.
Composites 12000 1,2
PVF2 Compress. Windmill 500 |jm*90 mm*70mm 2.4 0.76 1 400 3
BIMORPHPVDF. d3i Shoe-mounted 1300 18 250 4
PZTDFMORPH, d31 Shoe-mounted 8400 64.8 500 4
PVDF bimorph. Windmill Rotor. 12 cantilevers bimorphs. Rotor dn load
Windmill rotor Each bimorph 60*20*0,5mm 10200 1420 6.8 4.6 5
PZT-5 A LOAD MEMBRANE; BLOOD PRESSURE
Biomedical Área lcm2
Thick. 9 pin
2.3 2600 6
PZT rectangular structure Knee Implant 1*1*1,8 cm3 4800 890 7
Vibrant Transducer membrane
Low power sensors Total radius: 20,5 mm (12,5mm P Z T r a d i u s ) , thick. 230 |jm, Fastening thick.: 400 |jm
1700 106 9 47 1,2
PZT thin layer. Cantilever generator
MEMS (170*260) |jm2 1 740 2.2 5200 8
PZTthick layer, 80 Hz MEMS Layers of 20 |jm 2 0.81 333 9
PZT, 1.5 MPa lateral pressure, 15 Hz
Wireless transmitter Volume: 0.2 cm3 1200 6000 9 10
PZT stacked generator(164 layers, 1 Hz , 250 N)
Muscle activation power 5*5*80 mm3 690 345 19.3 540 1,2
Thin layer PZT membrane coupled with heat engine.
Hybrid Surface: 3 mm2
Thick: 3,4 |jm
56 5.5 106 4 11
PZT Cymbal d33 load Cymbal Diameter: 29 m m
Thickness: l m m
39000 43900 400 12
PZT button (ignition) d33 load
Pulse generator Diam:1.27 cm Thick: 1.3 m m
25 109 1.514 106 500 0.01 13
PMN-PT composites. d33 compressive load 40,4 MPa
Composite 22100 14
PZT between steel and brass. Stress cyclesofO. 7 N, 590 Hz
0.51 cm3 11000 21570 14.07 18 15
Piezoelectric nanowires Arrays and semiconductive ZnO
Biosensors and Electronic nanogenerators
Diameter wire 300 nm. Arrays 6.5*3.2 pm2
- 1 0 - 2 0 pW/ wire
100-200 0.02 16
TABLE2
TESTS RESULTS SIMULATING BURIED PIEZOELECTRIC CABLE UNDER CONTINOUS ROAD TRAFFIC
p(°) Test N. Ax(s) AT(s) n0 (rpm) v ( k m / h ) Peak voltage(mV)
22
1 0.156 1.284 23.364 60.923 538.531
22
2 0.136 1.148 26.132 69.882 531.581
22
3 0.120 1.000 30.000 79.200 643.253
22 4 0.108 0.892 33.632 88.000 647.536
22
5 0.096 0.804 37.313 99.000 779.142
22
6 0.088 0.736 40.761 108.000 821.405
22
7 0.082 0.674 44.510 115.902 794.013
45
8 0.332 1.340 23.388 28.627 476.660
45
9 0.284 1.148 26.132 33.465 454.793
45
10 0.248 1.000 30.000 38.322 549.714
45 11 0.220 0.892 33.632 43.200 601.004
45
12 0.196 0.800 37.500 48.490 723.335
45
13 0.178 0.734 40.872 53.393 818.550
45
14 0.168 0.674 44.510 56.571 900.096
90
15 0.680 1.360 22.059 13.976 551.763
90
16 0.576 1.156 25.952 16.500 675.318
90
17 0.500 1.004 29.880 19.008 743.948
90 18 0.444 0.888 33.784 21.405 770.583
90
19 0.404 0.806 37.221 23.525 818.952
90
21 0.340 0.676 44.379 27.953 847.158
The test bench is composed by a computer controlled rotating platform droved by a geared ac-motor. The angle between its axes (P)(°) (each axis comprises a pair of wheels) and the selection of the rotating angular speed (no)(rpm), see (1), simulates the time between the pass of the two axes (Ax)(s) of a real vehicle.
Ar (1)
The equivalent speed of a vehicle having a well known distance between its front and rear axis (b)(m) (in table 2 it's used a distance of b= 2,64 m, that is a common distance in sedan type cars) is calculated usmg (2).
b
v = 3,6 (2) A r - 1 0 0
Fig. 3 describes the electrical results obtained in the
14th test of table 2, acquired with an Agilent
Technologies TDS7054 scope, test probé 10073C (10:1, 500 MHz BW) and 1 MQ as selected input impedance.
n 500^/
IAX = 674.000000000ms 1/AX
-&• O.Os 100.0?/ Stop i Q
7ST
Fig. 3: Electrical results of \A test (table 2)
2.2 Electrical Equivalent Models
The experimental results in our laboratory simúlate the behavior of buried piezoelectric cables in real traffic sensing applications. The electrical model [23, 24] of the piezoelectric element excited by the mechanical action of the road traffic is composed by the Thévenin association of the voltage generator in series with the capacitance of the piezoelectric cable or by the Norton equivalent, formed by a current generator associated in parallel with that capacitance.
We assume that the periodical mechanical
excitation provided by the test bench is equivalent to continuous real traffic. The periodical nature of the electrical signáis collected justifies the use of the Fourier mathematical analysis exposed in our method. The method is resumed in five steps.
Extract the amplitude and time valúes of each test, for one electrical period of the signal (AT)(s), to write a text file with that valúes. Calcúlate the Fourier components of that signal, until the necessary harmonic. We use the well known electronic simulator PSpice, and its voltage generator V P W L F R E F O R E V E R with the above text file.
Test the simulation results of the series association of the harmonic components and the original signal of the text file with a load resistance in both cases approaching open load (1000GQ).
Apply the superposition principie and calcúlate the inner generators that in series with the capacitance of the piezoelectric material perform the real model of the piezoelectric element.
Test the above electric real model with a 1 MQ load resistor, equivalent to the probé impedance that has been used to obtain the electrical initial measurements.
The number of equivalent Fourier components in series with the equivalent capacitance of the material is between 75 and 100, using the total number of decimal positions to avoid the electric noise produced if the number of decimals were truncated.
In Fig. 4 is presented the equivalent 75 generators
of the real model of the test 14th (table 2), see Fig. 3.
*
--.
=<f
rri0"*^s; = r
= y
é
=£¿p
'.. zirzj©"
r-
=;¡±
J
iiif
U**f
, U
= s
^ 1
s-jj^y r... r;.j¡3* 'I'^Zlé
tSgtvasní Y
i £ ™ j Fig. 4: Equivalent electrical model of 14* test (table 2).
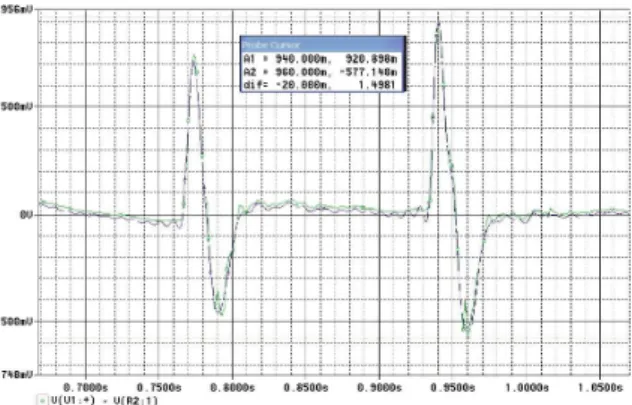
Finally, in Fig. 5 is represented the comparison of the last step of the method. The error is less than 2%, so we can evalúate the performance of piezoelectric materials (not only piezoelectric cables) in power harvesting related to road traffic environment.
.
»
esas »
: esas »
:
EL
•• 940.OOOm. : 9 6 0 OOOm. - 2 0 OOOm.9 2 0 . 8 9 8 m - 5 r r 148m
1 4 9 8 1
» !
EL
•• 940.OOOm.
: 9 6 0 OOOm. - 2 0 OOOm.
9 2 0 . 8 9 8 m - 5 r r 148m
1 4 9 8 1
;•
EL
•• 940.OOOm. : 9 6 0 OOOm. - 2 0 OOOm.9 2 0 . 8 9 8 m - 5 r r 148m
1 4 9 8 1
;•
í; ¡i
j :
"
1
•' 1
i
• - • '
•il
• < . ,
•il
748mU-Fig. 5: Model 14* (table II) validated
3 Energy Harvesting using the Models
The generators modeled are in correspondence with consecutives buried piezoelectric cables. The practical distance of 1,6 cm between them was obtained by experimental results. This new parameter is included in the models as a time delay between the generators associated to consecutive cables using (3).
"
0
-í%))-*
í3)
tD =
In (3) tD is expressed in seconds, d0 (m), n0 (rpm),
and R (m) is the rotating platform radio of the test bench. As R=0,75m»do=0,016m, we are using the
geometric approximation between are and chord. The valué of the capacitor used to hold the charge from the piezoelectric cables, is set constant in order to compare the results. Its valué will affect the time needed to achieve the steady state. To collect charge from the positive and negative stress, semiconductor topologies are used. Its type and optimized structure is presented in the next item.
3.1 Rectifier Topologies
In this section the compared results of several rectifying structures and the influence of the semiconductor diode type is presented. In the first analysis, the valúes of the capacitor and the load resistor were constant.
The association of generators (one from one individual piezoelectric cable) was studied using
bridge rectifiers connected in parallel or using polyphasic structures, i.e. star topology. The polyphasic topology in D structure was very soon rejected by its poor results.
We present in Fig. 6 (a) an example of 16 cables (having internal structure like Fig. 4) associated by rectifier bridges in parallel. This is the inner structure of one hierarchical block, and these hierarchical blocks are associated in parallel in order to perform a great number of cells in parallel, Fig. 6 (b).
'§f'^p— j T ^ j x
-1
(a)
Scablf s_0 16cabk s_1 16cabl< s_2
: ; a b l e s _ 0 1E ; a b l e s _ 1 1E ;ables_2
rV
(b)
Fig. 6: (a) Bridge rectifiers in parallel association (b) 48 bridge rectifiers in parallel formed by 3 hierarchical blocks like 6(a).
Fig. 7 resumes the results of 48 piezoelectric generator cables associated using silicon rectifier diodes (1N400X type), Schottky diodes (BAS40-04W and RB751 type) and signal diodes (1N4148 type) used in the topological rectifier structures analyzed. The simulation time in computers Intel® Core™ 2 E8400 @ 3 GHz, 2 GB RAM, was 26 hours if Schottky diodes were used and 16 hours if 1N4148 diodes were used. All the studies executed later were performed with 1N4148 diodes.
1N4148 bridges. On next section we present results using series association of paralleled structures and mechanical amplification simulating heavy traffic.
Fig. 7: Output voltage (mV) vs. time (s)
1N4148 bridge
ln.dr, 30 « b l
lvrid-> 72 cabl
luidrr 04 « b l
l u i d * - 50 « b l
lnidr, 4 ¡ ! « b l
Ivrid.-- 40 « b l
ln.dr, 32 « b l
l>rtd.> 28 « b l ln¡ll¿> 22 «1)1
luid-,. 10 «1)1 iHKlrr 8 cables ln-.d-, l>l¡drr
lvri,l.->
4 «1)1*' 2 cables 1 « b l e
Fig. 8: 1N4148 bridge: Output voltage (mV) vs. time (s)
3.2 Final Results
The results of the harvester formed by the series association of two 80 parallel circuits, using a set of resistor valúes from open load to 100 Q, are depicted in Fig. 9. The 160 GB data file obtained with each one of the load conditions made impossible use the PSpice parametric study because the hard disk capaciry.
In Fig. 9(b), it's presented the relation between power vs. current supplied to the load resistor. The point of máximum valué verifies (4).
V2
V °C (4) P, RoutMAX
4-R
This applies when the valué of load resistor equals the output equivalent resistance (RQ) of the harvesting circuit. The high valué found of R<, and the open load voltage (Voc), limits the practical power to be harvested. Table 3 presents máximum power and the parameters of the lineal input stage final model, including results for the test with mechanical amplification, which simulates the effect of heavy traffic. Their graphical results are presented in Fig. 9 (c) and (d). At the optimal point of operation,
mechanical amplification has an incremental voltage factor of 4,27 over the results without it, so the ratio for power collected is about (4,27) =18,28 .
V o ( m V ) v s l o { m A ]
0,G0E+00 1.C0E-03 2,002-03 3.03E-03 4,00E-03 5,00E-03
(a)
P o ( n W ) v s l o ( m A )
O.OOEIOO 1.00E-03 2.03E-03 3,00E-03 4.00E-03 5,30E-Ü3
(b)
Vo{mV) us lo{mA)
O.OOCiOO 500E-03 l,00E-0; 1.50EO2 2 00E-02 2.Í.OE-02
(c)
Po(nW) us lo(mA)
0.00CI00 5.00E-03 l,00E-02 ),50E-02 2,00E-O2 2,50E-02
(d)
Fig. 9: Final results. Model without mechanical amplification (a), (b).Model with mechanical amplification (c), (d)
TABLE3
EQUIVALENT FINAL LINEAL MODEL: PARAMETERS AND MÁXIMUM OPTIMAL POWER.
TEST using mechanical amplification
Voc (mV) Ro(í2) PRoutMÁX ( H W )
NO 2,748.3 715,431 2.635
YES 11,341 666,300 48.258
4 Conclusión
equivalent models of piezoelectric materials specifically designed to be involved under road trafile mechanical stimulus, is presented.
The analysis of the optimal input stage of an energy harvesting system using piezoelectric materials, and its linearized electrical model are also covered. The equivalent model should be used in the design process of the following regulator circuit.
The optimal harvested power results shown, with mechanical amplification, guarantees the availability of self-powering a practical sensor's network, in civil and road applications, if the piezoelectric devices have enough mechanical amplification in locations with no power lines available.
Acknowledgement:
This work was supported in part by the project MAT2010-21088-C03-03
References:
[1] K. A. Cook-Chennault, N. Thambi, & A. M. Sastry, Powering MEMS portable devices—A review of nonregenerative and regenerative power supply systems with special emphasis on piezoelectric energy harvesting systems. SmartMat. & Struc, 17,2008,33p. [2] K. A. Cook-Chennault; N. Thambi; M.A. Bitetto; E.B.
Hameyie, Piezoelectric Energy Harvesting: A Green and Clean Alternative for Sustained Power Production,
Bulletin of Science, Technology & Society, vol. 28, 6,
2008, pp. 496-509.
[3] S. Pnya, C.T. Chen, D. Fye & J. Zahnd, Piezoelectric windmill: A novel solution to remote sensing. Jap.
Journal of Appl. Physics: Part 2—Letters & Express Letters, 44 (1-7), 2005, L104-L107.
[4] N. S. Shenck & J. A. Paradiso, Energy scavenging with shoe-mounted piezoelectrics. IEEE Micro, 21 (3), 2001, pp. 30-42.
[5] V. H. Schmidt, Piezoelectric energy conversión in wmdmills. IEEE Ultrasonic Symp., 1992, pp. 897-904. [6] M. J. Ramsay & W. W. Clark, Piezoelectric energy
harvesting for bio MEMS applications. Smart Struct.
and Materials, Ind. Proa ofSPIE. 2001,pp. 429-438.
[7] S. R. Platt, S. Farntor, K. Garvín & H. Haider, The use of piezoelectric ceramics for electric power generation within orthopedic implants. IEEE-ASME Trans. on
Mechatronics, 10 (4), 2005, pp 455-461.
[8] Y. B. Jeon, R. Sood, J. H. Jeong, S. G. Kim, MEMS power generator with transverse mode thin film PZT,
Sens. andAct. A: Physical, 122(1), 2005, ppl6-22.
[9] N. M. White, P. Glynne-Jones & S. P. Beeby, A novel thick-film piezoelectric micro-generator. Smart
Materials & Structures, 10 (4), 2001, pp. 850-852.
[10] S. Roundy & P. K. Wright, A piezoelectric vibration based generator for wireless electronics. Smart
Materials & Structures, 13 (5), 2004, pp 1131-1142.
[11] S. Whalen, M. Thompson, D. Bahr, C. Richards & R. Richards, Design, fabrication and testing of the P 3 micro heat engine. Sensors. and Actuators A: Physical,
104 (3), 2003, pp. 290-298.
[12] H. W. Kim, A. Batra, S. Pnya, K. Uchmo, D. Markley, R. E. Newnham, H. F. Hofmann, Energy harvesting using a piezoelectric "cymbal" transducer in dynamic environment. Jap. Jour. Appl. Phys. 43, 2004, pp 6178-6183.
[13] T. G. Engel, C. Keawboonchuay & W. C. Nunnally, Energy conversión and high power pulse production using miniature piezoelectric compressors, IEEE Trans.
on Plasma Science, 28 (5), 2000, pp. 1338-1341.
[14] K. L. Ren, Y. M. Lm, X. Geng, H. F. Hofmann & Q. M. Zhang, Single crystal PMN-PT/epoxy 1-3 composite for energy harvesting application. IEEE
Trans. on Ultrasonics, Ferroelectrics, and Frequency Control, 53 (3), 2006, pp. 631-638.
[15]Sheng Wang, Kwok Ho Lam, Cheng Liang Sun, Kin Wing Kwok, Helen Lai Wa Chan, Ming Sen Guo and Xing-Zhong Zhao, Energy harvesting with piezoelectric drum transducer, Appl. Phys. Lett. 90, 113506, 2007. [ 16] Zhong Lin Wang, Jinhui Song, Piezoelectric
Nanogenerators Based on Zinc Oxide Nanowire Arrays, Sience Vol. 312 no. 5771, 2006, pp. 242-246. [17] Chung-Bang Yun and Jiyoung Min, Smart Sensing,
Monitoring, and Damage Detection for Civil Infrastructures, KSCE Journal of Civil Engineering
15(1), 2011, pp.1-14.
[18]N. Elvin, A. Elvin, D.H. Choi, A self-powered damage detection sensor, J. Strain Anal.,38(2), 2003,
pp.115-124.
[19] M. Vázquez Rodríguez, F.J. Jiménez Martínez, J. de Frutos. Banco de ensayos para materiales piezoeléctricos en aplicaciones viales. Bol. Soc. Esp.
Ceram. Vidr. Vol 50. 2, 2011, pp. 65-72.
[20] M. Zhu, E. Worthington, J. Njuguna, Analyses of power output of piezoelectric energy-harvesting devices directly connected to a load resistor using a coupled piezoelectric-circuit finite element method,
IEEE Trans. Ultrason. Ferroelectr. Freq. Control 56,
2009, pp. 1309-1317.
[21] J. Sun, D. M. Mitchell, M. F. Greuel, R M. Bass, Averaged modeling of PWM converters in discontinuous conduction mode, IEEE Trans. Power
Electron., vol. 16, 2001, pp. 482-492.
[22] G. K. Ottman, A. C. Bhatt, H. Hofmann, G. A. Lesieutre, Adaptive piezoelectric energy harvesting circuit for wireless remote power supply, IEEE Trans.
Power Electron., vol. 17, 2002, pp. 669-676.
[23] G.K. Ottman, H.F. Hofmann, G.A. Lesieutre. Optimized piezoelectric energy harvesting circuit using step-down converter in discontinuous conduction mode,