SOCIAL SCIENCE
Madrid cycle track: visualizing the cyclable city
Gustavo Romanillosaand Martin Zaltz Austwickb
a
tGIS Transport, Infrastructure and Territory research group, Complutene University of Madrid, Profesor Aranguren S/N, 28040 Ciudad Universitaria Madrid, Spain;bBartlett Centre for Advanced Spatial Analysis, University College London, Gower Street, London WC1E 6BT, UK
ABSTRACT
Maps are currently experiencing a paradigm shift from static representations to dynamic platforms that capture, visualize and analyse new data, bringing different possibilities for exploration and research. Thefirst objective of this paper is to present a map that illustrates, for thefirst time, the realflow of casual cyclists and bike messengers in the city of Madrid. The second objective is to describe the development and results of theMadrid Cycle Track initiative, an online platform launched with the aim of collecting cycling routes and other information from volunteers. In the framework of this initiative, different online maps are presented and their functionalities described. Finally, a supplemental video visualizes the cyclistflow over the course of a day.
ARTICLE HISTORY Received 15 December 2014 Revised 4 June 2015 Accepted 21 July 2015
KEYWORDS
Cycling; bike mobility; cycle map; transport visualization; GPS
1. Introduction
The understanding of urban cyclist behaviour is crucial to planning and designing optimal bike infrastructures and promoting efficient policies aimed at fostering cycling as a sustainable mode of transport in cities. Cyclist behaviour is complex and not easily predictable because it is influenced by a diverse set of factors. With different objectives, it has been traditionally analysed through the information derived from household sur-veys or more specific group surveys. Regarding the areas of demand analysis, preference evaluation and forecasting, Stated Preference (SP) techniques have been commonly applied (e.g. Kroes and Sheldon (1988)), in order to measure the effects of certain improvement on cycle facilities and then forecast the effect of others (Hopkinson & Wardman, 1996) or with the aim of estimating the potential cycle demand in certain urban areas (Ortúzar, Iacobelli, & Valeze, 2000). Also, Revealed Preference (RP) studies have been conducted with different purposes, such as the development of mode choice models (Noland & Kun-reuther, 1995).
More specifically, concerning the spatial analysis of cycling for planning purposes, SP and RP methods have been the dominant techniques. In SP studies, respondents were typically asked to evaluate the impact of different factors on their cycle route choice, or to state their preference for a street or a route by evaluat-ing the options usevaluat-ing photos of the routes or locations (Bradley & Bovy, 1984; Larsen & El-Geneidy, 2011; Tilahun, Levinson, & Krizek, 2007). Some RP-based studies asked respondents to design their cycle route on a map (Ben-aiuva & Morikawa, 1990) and finally,
some approaches involved both SP and RP techniques, but still using similar methods (Yang & Mesbah, 2013). In recent years, the research on cycling has grown substantially, and shifted with the emergence of new location-based data allowing more complex spatial analysis. Recent investigations have studied two differ-ent types of location data: point data captured by the growing Bike-Share Systems spread around the world (Côme & Latifa, 2012;Froehlich, Neumann, & Oliver, 2009; O’Brien, Cheshire, & Batty, 2013; Zaltz Austwick, O’Brien, Strano, & Viana, 2013) and GPS tracking data collected through smartphones appli-cations or specific devices, gathered specifically with research purposes or made available by ‘Big App’ Companies for research or planning (Broach, Dill, & Gliebe, 2011; Harvey & Krizek, 2007; Menghini, Carrasco, Axhausen, & Schüssler, 2010).
By overcoming the traditional SP and RP limitations in terms of high costs, small samples and spatial impre-cision (Hood, Sall, & Charlton, 2011), these new studies are improving the understanding of urban cyclist behaviour and producing outputs to inform the plan-ning and design of bike infrastructures and policies.
The goal of this paper is to describe the objectives, the methodology and the outputs of the initiative Huella Ciclista de Madrid (Madrid Cycle Track), launched with the aim of collecting cycling routes and other infor-mation from volunteers in the city of Madrid, as well as to present the resulting map–and its online version– that represents all the gathered cyclist routes. Finally, the paper also visualizes the cyclistflow over the course of a day through a supplemental video.
Urban cycling in Spain has one of the lowest rates in the European Union (Roldán, Díaz, & Mellado, 2013)
© 2015 Gustavo Romanillos
CONTACT Gustavo Romanillos gustavro@ucm.es http://dx.doi.org/10.1080/17445647.2015.1088901
and Madrid has a particularly low modal split (0.6% according to Ayuntamiento de Madrid (2013)) com-pared to other cities such as Barcelona or Seville (2.0% and 6.6%, respectively, according to Agencia de Ecología Urbana de Barcelona (2014)). However, the number of cyclists in the city has grown significantly in recent years, and the municipality has launched a series of initiatives, ranging from a bike-share system to a new cycling infrastructure, with the objective of reaching 4.5% of the modal split in 2020 ( Ayunta-miento de Madrid, 2014). Specific geographical charac-teristics that shape the observed patterns of cycling (topography and land-use distribution, e.g.) are dis-cussed in the results section.
2. The initiative Madrid cycle track
2.1.Background and main objectives
Madrid Cycle Track (originally Huella Ciclista de Madrid, in Spanish) launched in June 2013 in the fra-mework of a broader research aimed at developing new models for designing optimal bike networks, in which the understanding of cyclist behaviour and route pre-ferences plays a crucial role. In this domain, modelling is targeted to forecast the potential cyclistflow in differ-ent bike network proposals, evaluating the impact of different factors on cyclists’route choice (such as the slope of the streets, the type of bikeway or traffic den-sity) as well as disaggregating cyclists by factors such as age or gender or journey purpose. In order to perform this evaluation, an analysis of real cyclist routes in Madrid (the research case study) was required.
The available information on Madrid bike mobility was limited to the Transport Household Survey con-ducted in 2004 and other more specific surveys aimed at analysing the evolution of cycling in certain areas of the city in which bike infrastructure has been implemented. Because these surveys did not provide relevant spatial data for the purpose of the investi-gation, the research team conceived the initiative Madrid Cycle Track with the aim of gathering cyclist routes and other relevant data from volunteers in the city of Madrid.
2.2.The online platform and the participation process
The initiative was launched through an online platform (website available at www.huellaciclistademadrid.es), designed with five different objectives. The first one was to provide information about the project’s back-ground and goals, so that potential volunteers could get interested in it. The second goal was to enable the engagement of urban cyclist interested in the initiative. Volunteers could register, download a free GPS smart-phone application, Map My Tracks, and join the group
of volunteers within the online platform to make the process minimize the risk of volunteer dropout.
The third and main objective of the online platform was to collect cyclists’routes. Volunteers could upload the routes to the platform in three different ways. Initially, a cyclist could only participate by uploading routes through the smartphone GPS app. All of the data were stored in the app website and then down-loaded by the research team. In a second stage of the project, due to volunteer demand, the gathering pro-cess let the cyclists to upload GPS that they collected through other GPS apps. The number of cyclists parti-cipating through this option was not very high, but was easily implemented and provided some extra GPS tracks. Finally, in order to open the initiative to people not owning a smartphone or not willing to use the app for whatever reason, a participative online map was embedded on the platform enabling volunteers to easily design their cycle routes on a map with accuracy and with the possibility of providing some extra infor-mation about themselves (such as age and gender) and their routes (such as purpose and frequency of the jour-ney or safety of the route).
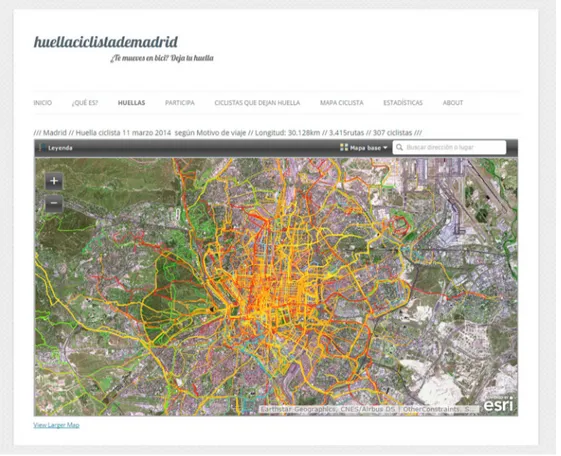
The fourth goal was to let cyclists visualize their routes, get access to different statistics and explore some data about their activity (distance and time tra-velled, gradient, slope, speed, etc.). Volunteers could also look up other group members’ activity and get in touch with them by text messages. These functional-ities provided the sense of belonging to a community, and encourage people to participate and to invite other people to join the initiative. Figure 1 shows a screenshot of the online platform illustrating collected cyclists’routes.
Finally, thefifth objective of the online platform was to visualize the collective cycle trackthrough different online maps that represented the evolution and the growth of the track over time. The representation of all the routes together through online maps let the possibility of exploring the city, visualizing the streets with highest levels of cyclist flow according, for example, or relating routes to journey purpose. How-ever, providing appealing feedback to the volunteers who altruistically participated in the initiative was a goal in itself. They could not only visualize the collec-tive track, but also identify and look up individual con-tributions by clicking on the routes. These online maps are described in more detail in later sections.
2.3.Bike messengers engagement
Bike messengers companies are experiencing a renais-sance, playing a growing role in the delivery of packages and mail in many major cities (Fleming, 2012; Hong, Zhiliang, & Wei, 2006; Kidder, 2008). Cycle couriering is not only a competitive transport mode for the delivery of time-sensitive materials in
the core of many metropolitan areas (Kidder, 2008, 2011), but is also attractive from a sustainability per-spective. Many cities are implementing policies aimed at fostering this sustainable transport system in urban areas (Fleming, 2012; Hong et al., 2006). In this sense, the study of bike messengers’ mobility could provide some relevant clues for better implementing these planning and policy strategies. However, while bike messengers have been studied from the social researchfield (Fincham, 2007;Kidder, 2011) or regard-ing environmental questions (Bernmark, Wiktorin, Svartengren, Lewné, & Aberg, 2006), their mobility is underexplored and has not been spatially analysed (with few exceptions; for example,Kidder (2008)), in comparison with casual cyclists or other transport modes.
The city of Madrid is not an exception and several new bike messengers companies emerged recently. Our interest for studying and comparing their mobility patterns with one of the casual bikers for which we had started collecting data led us to open the Madrid Cycle Track initiative to their participation. On November 2013, four different companies based in Madrid joined the initiative and started to track their activity: Ema-kers, Trébol ecomensajeros, Mensos and BikePost ecomensajeros.
Though the bike messengers’activity was eventually integrated in the existing online platform, the method-ology followed to collect their routes differed from the one followed with casual bikers. Since couriers cycle many hours a day and often use their phones for work-ing purposes, smartphone GPS apps have serious issues around battery life. Instead, these companies were equipped with specific cycling GPS devices (Garmin EDE 200). Their tracks were initially uploaded to a Garmin online platform (Garmin Connect), and then downloaded and integrated in the online platform of Madrid Cycle Track, where they were visualized through an independent online map, similar to the one displaying casual bike mobility.
2.4.Results
A total of 6022 cycle routes were gathered, resulting in 48,122 km of tracks uploaded by 328 volunteers parti-cipating from June 2013 to September 2014, taking into account both the casual cyclists and bike messengers.
2.4.1.Casual cyclists results
Casual cyclists’routes were mainly collected from June 2013 to March 2014, after a two-month period of gath-ering routes for testing the app and the online platform
Figure 1.Screenshot of the online platform illustrating collected cyclists’routes.
performances. The initiative collected 37,345 km of cycle routes obtained from 3970 journeys. From them, 327 were gathered through the ‘Design your route’ map, and the rest are GPS tracks collected through the online, with 307 participants in total. The proportion of males and females in this sample was 72–28%, respectively, figures that correspond well to existing local surveys (DOYMO, 2011;Monzon de Cáceres, Rondinella, & Muñoz López, 2011). Figure 2 illustrates the gender proportion according to age.
The data obtained from the routes revealed differences in average speed, distance and travel time, according to the purpose of the journey. Table 1 shows the summary statistics regarding this.
The map showing all the routes together yields clear mobility patterns to the trained eye. For example, the business districts spread along the Castellana axis and the employment associated with it explain the high volume of commuter cyclists; journeys around the Uni-versity Campus may include trips with mixed purposes such as leisure, sport, commuting and study; other areas such as the Casa de Campo park, the Madrid Río riverside park or theCycling Belt present mainly leisure and sport journeys. A surprisingfinding when exploring the map is the fact that streets with high level of motor traffic are used by a significant number of cyclists. Past surveys report that intensive traffic is
one of the most significant barriers to cycling, especially for non-cyclists considering adopting cycling (Monzon de Cáceres et al., 2011). Finally, at a neigh-bourhood scale, some other interesting patterns can be identified; for example, the influence of the slope in hilly areas of the city, evidenced by the use of differ-ent streets when going up or down on similar routes.
2.4.2.Bike messengers results
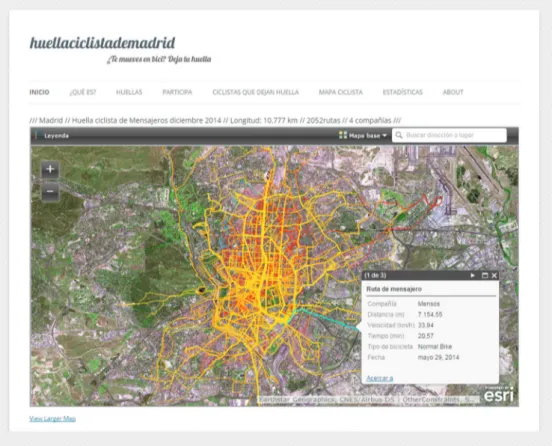
Bike messengers’routes were collected from November 2013 to September 2014, though the companies partici-pated in different moments throughout this period of time. A total of 2052 routes were gathered from four different companies, providing 10,777 cycled kilo-metres. The total number of cyclists participating in the initiative was 23. After a cleaning process some routes were discarded (due to other possible purposes rather than couriering) and finally the route sample we analysed and visualized was composed of 1722 routes and 9143 km. Bikers’ socio-demographic data were not provided by the companies, though their pro-files were similar: all were male and aged between 18 and 42 years.
Three different types of bikes were used by the mes-sengers. Depending on the volume and weight of the material to deliver, apart fromcasual bikes, they rode bullit cargo bikes (or freight bikes) and cargo trike bikes(or freight tricycles), though the sample gathered includes very few of the latter. Some of the bullit cargo bikes and all the cargo trike bikes featured electric assistance.
The resulting map illustrates different mobility pat-terns compared to the ones obtained from casual bikers. The map illustrates that the main streets of the city, often those presenting highest values of vehicle traffic density, showed also the maximum cycle flow values, evidencing that bike messengers are more used and less afraid of coping with vehicles. The video visualization also evidences the different flow patterns over the course of the day, almost complemen-tary. Casual cyclists’ performance shows the classical
Figure 2.Cyclists according to age and gender.
Table 1. Route statistics according to the purpose of the journey.
Purpose of the journey
Routes (%)
Routesa (%)
Speed Av. (km/h)
Time (min) average
Distance (m) average
Commuting 31.11 42.19 15.82 24.52 5889
Leisure 17.17 23.28 15.15 23.94 5705
Sport 5.72 7.76 16.19 80.81 21,002
Shopping 6.30 8.55 14.66 22.29 5648
Management/ other
5.51 7.47 15.18 17.07 4231
Study 7.93 10.76 14.82 21.12 5201
Unknown 26.26 – 14.28 28.30 6638
Total/mean over total
100.00 100.00 15.42 31.64 7947
aRoutes over total number with known purpose.
two peaks, early in the morning and then in the eve-ning, and bike messengers’activity is more distributed throughout the morning and afternoon.
Finally, the analysis of the data derived from the GPS tracks revealed some interesting and also unex-pected findings on bike messengers’ behaviour. Though it is not the objective of this paper to describe them in detail, some interesting outcomes can be high-lighted. It was expected that the average speed of mes-sengers riding casual bikes (19.6 km/h) was higher than those of casual cyclists (15.42 km/h), but we found it surprising that the average speed of messengers riding bullit cargo bikes was revealed to be similar (19.7 km/ h) to that of messengers riding casual bikes. In this par-ticular case, this finding can be due to the electric assistance that most of the bullit cargo bikes feature, and the way it helps messengers in a hilly city like Madrid. Though they are also electrically assisted, the average speed of cargo trike bikes was notably lower than that of the other ones (11.4 km/h). Other
variables, such as the average distance or the height gradient of the journeys, showed also clear differences. Table 2illustrates some basic statistics on bike messen-gers’mobility according to the type of the bike used.
3. The online maps
The Madrid Cycle Track web platform (www. huellaciclistademadrid.es) hosts different online maps aimed at illustrating both the casual cyclists’ and the bike messengers’ routes, and their evolution over time. All the online maps have been designed using theArcGIS Onlineplatform. They arefinally embedded in different pages of the website (a WordPress blog) usingiframes. In order to better configure the presen-tation of these maps within the website, we have used theWeb Maps for WordPressand theiframeplugins.
The use of online maps offers many advantages. Because of the different functionalities they provide, they are more dynamic, more complete and easier to explore than conventional printed or digital maps. It is possible to change the extent and the scale of the map, so that we can have an idea of the global cyclist track (Figure 3) as well as to explore the cyclist flow in specific streets. We can select different base maps (provided by ArcGIS Online or other Web Maps Ser-vices) or search for specific locations. We also have access to information regarding the routes and the cyclists behind them. By selecting any track, a pop-up window emerges (Figure 4) showing different data
Table 2.Cycling statistics according to the type of bike of the messengers.
Type of bike
Routes (Uds.)
Speed Av.(km/
h)
Gradient Av. (m)
Time (min) average
Distance (m) average
Normal bike
1553 19.6 95.8 30.49 5245
Bullit bike
131 19.7 63.7 11.26 3061
Cargo trike
37 11.4 134.1 14.85 2494
Figure 3.Screenshot of the online map illustrating casual cyclists’mobility.
such as the name (username), age and gender of the cyclists, or the purpose of the journey, distance tra-velled, average speed, time, gradient, etc. These func-tionalities made the map attractive not only for the cyclist community participating in the project, but also for other people interested in exploring bike mobi-lity in Madrid.
Finally, the initiative was released to people not owning a smartphone through the‘Design your route map’(Figure 5), another online map opened to public edition. Volunteers could easily design their own cyclist route on the map, using the base maps and the zoom for more accuracy, and oncefinished, they could intro-duce some personal information (username, age and gender) as well as some other information regarding the route (purpose, frequency, safety, etc.). This map was also designed using the ArcGIS Online platform. This map is accessible at the website, through the label Participa/Dibuja tu huella in the Menu bar.
4. The map
The Main Map canvas illustrates both the casual cyclists’ and the bike messengers’ collected routes through four different maps. Thefirst map represents casual cyclist mobility on a map at a metropolitan scale. Routes are symbolized according to the purpose of the journey, distinguishing between work-commut-ing, study, shoppwork-commut-ing, leisure, sport and others, so that it
is possible to visualize not only overall cyclistflow but also the spatial patterns that emerge regarding the different purposes of cyclist journeys. A second map zooms into a central urban area, showing in detail the diverse level of cyclist flow through the different streets. The third map illustrates bike messenger mobi-lity at the same metropolitan scale and extent used in thefirst map, so that it not only represents the general cyclist flow but also makes possible the comparison between the two different mobilities. In this case, routes are symbolized according to the bike messengers com-pany. The map revealed some differences, such as not only the extent of the global cycle track, but also others that became clearer in the fourth map that zooms into another central urban area. The visualization of the tracks evidenced a stronger preference for riding in the main streets even where they have the highest motor trafficflow.
The maps represent the routes collected from 327 GPS tracks and the routes designed by cyclists through the‘Design your route’ online map. In order to rep-resent cyclist flow as a collection of different routes, these track lines were deliberately not matched to any street network layer (Figure 6). Finally, the routes are displayed over a satellite image, a GeoEye ortophoto obtained by using a web map service with ArcGIS 10.2. Different Photoshop filters were applied to the orthophoto to make it more homogeneous, to reduce contrast without losing the detail an ortophoto brings compared to base maps and to increase the contrast
Figure 4.Screenshot of the online map illustrating bike messengers’mobility and a pop-up window with information about the selected route.
of the displayed routes, allowing an accurate but a clear visual exploration of the map at the same time. Admin-istrative or political boundaries (in the case of Madrid not at all related to the extent of the urban area) were intentionally avoided in order to highlight the natural, irregular and progressively diffuse boundaries of the cycle track.
5. Dynamic visualizations
The online visualization animates the activity of both casual users and bike messengers, shown according to time of day, but collapsed from multiple days
(including several journeys by some users) onto one day, to illustrate routes and activity as they vary by time of day. In doing this, we have combined journeys from weekdays and weekends, special events and bank holidays, and journeys taking place in different days and weeks–all of which might have different charac-ters due to different reasons for journeys, weather, sea-sons and traffic.
The visualization was produced using the Proces-sing programming language (http://processing.org) using the code written for the purpose (https:// github.com/martinaustwick/GPS-vis). The journey data are stored in a MySQL database in two separate
Figure 5.Screenshot of the‘Design your route’online map.
Figure 6.Visualization of casual cyclists’routes.
tables (one each for couriers and casual users); each table contains a series of rows which has a user ID, location and timestamp associated with that location.
In each frame, a query is sent to the couriers table, requesting all data points which were recorded less than 20 seconds after the current timestamp. These points are drawn on the screen with two increasingly large and transparent ellipses (8 and 16 pixels) drawn at the same location. This is a simple method to produce a ‘heatmap’ effect when multiple data points exist in close proximity at the same or similar timestamps, or when the same locations were recorded at the same time on con-secutive days. This process is then repeated for the casual users, but the colour is changed to distinguish these two groups.
In between frames, a partially transparent version of the underlying map is redrawn, meaning that the location of points in previous timestamps remains par-tially visible, creating the illusion of a continuous path. By decreasing transparency (increasing alpha value), those previous values become more strongly obscured, emphasizing the ‘current’ position of cyclists; by increasing transparency (reducing alpha), prior paths are more obvious, at the expense of the most current data. In each frame, a .jpg image is captured, creating some 3150 images (17.5 h at 3 images per minute), which when assembled at 30 frames/second results in a movie of under 2 min.
6. Conclusions
The maps presented in this paper visualize the distri-bution of cyclist flow for the first time in the study area. This visualization reveals mobility patterns regarding the use of bikes for different purposes and disaggregated by different socio-demographic charac-teristics, allowing us to understand better bike mobility trends and cyclist behaviour. But the maps have played a crucial role behind the visual exploration and the analysis of the outputs. The creation of online maps was central in the design of the initiative. Online maps were dynamic; they represented the evolution of the collective track over time and let volunteers to visualize their contribution. Furthermore, cyclists were also able to design their routes on the map, so that they became not only a representation tool but also an instrument for capturing new data and enga-ging our community of cyclists. Maps play a central role in innovative participatory projects that bring new possibilities for collecting new data and allowing communities affected by planning changes to directly contribute to those processes. Madrid Cycle Tracks has demonstrated new ways to engage community sta-keholders as active citizen scientists in helping to shape their city infrastructure, and demonstrated the value of
interactive mapmaking and visualization in building and maintaining these communities.
7. Software
ArcGIS 10.2 was used to process the GPS tracks, to associate the corresponding travel and socio-demo-graphic information and to create the preliminary maps. The online maps were designed and published using ArcGIS Online platform. Madrid Cycle Track online platform is a WordPress blog that integrates the online maps by using Web Maps for WordPress and the iframe plugins. Adobe Photoshop CS6 was used to apply some filters to the satellite ortophoto and Adobe Illustrator CS6 to produce the final map. The visualization was produced using the Processing programming language (http://processing.org) using MySQL and associated Java connectors and the video was edited withWindows Movie Maker.
Acknowledgements
We would like to express our gratitude to the hundreds of volunteers who contributed to this exercise in collective mapmaking, without who these maps would not have been possible.
Disclosure statement
No potential conflict of interest was reported by the authors.
References
Agencia de Ecología Urbana de Barcelona. (2014).Informe de Sostenibilitat Ambiental del Pla de Mobilitat Urbana de Barcelona 2013–2018. Barcelona: Ajuntament de Barcelona.
Ben-aiuva, M., & Morikawa, T. (1990). Estimation of switch-ing models from revelaed preferences and stated inten-tions.Transport Research A,24(6), 485–495.
Bernmark, E., Wiktorin, C., Svartengren, M., Lewné, M., & Aberg, S. (2006). Bicycle messengers: Energy expenditure and exposure to air pollution.Ergonomics,49(14), 1486– 1495.doi:10.1080/00140130600708206
Bradley, M. A., & Bovy, P. H. (1984). A stated preference analysis of bicyclist route choice. Planning and Transport Research and Computation. Retrieved from http://trid. trb.org/view.aspx?id=218736
Broach, J., Dill, J., & Gliebe, J. (2011).Bicycle route choice model developed from revealed-preference GPS Data. Transportation Research Board 90th annual meeting. Retrieved September 12, 2014, from http://trid.trb.org/ view.aspx?id=1093304
Etienne, C., & Latifa, O. (2012). Model-based count series clustering for Bike-sharing system usage mining, a case study with the Vélib’ system of Paris. Transportation Research-Part C,5(3), 1–23.
DOYMO. (2011).Estudio de seguimiento de impacto de la implantación del PDMC. Eje Prado, Recoletos, Castellana. Fincham, B. (2007). Bicycle messengers: Image, identity and community. In D. Horton, P. Rosen, & P. Cox (Eds.),
Cycling and society (pp. 179–196). Aldershot: Ashgate Publishing Ltd.
Fleming, S. (2012).Cycle space: Architecture & urban design in the age of the bicycle. Rotterdam: NAi010 publishers. Froehlich, J., Neumann, J., & Oliver, N. (2009). Sensing and
predicting the pulse of the city through shared bicycling. In
Twenty-first international joint conference on artificial intelli-gence (IJCAI-09)(pp. 1420–1426). Beijing, China: AAAI Press Harvey, F. J., & Krizek, K. J. (2007). Commuter bicyclist behavior and facility disruption. Transportation Research Board. Retrieved September 8, 2014, fromhttp://trid.trb. org/view.aspx?id=811576
Hong, Z., Zhiliang, W., & Wei, L. (2006). Bicycle-based cour-ier and delivery services in beijing: Market analysis.
Transportation Research Board 1954(80), 45–51. Hood, J., Sall, E., & Charlton, B. (2011). A GPS-based bicycle route
choice model for San Francisco, California. Transportation Letters: The International Journal of Transportation Research,
3(1), 63–75.doi:10.3328/TL.2011.03.01.63-75
Hopkinson, P., & Wardman, M. (1996). Evaluating the demand for new cycle facilities.Transport Policy,3(4), 241–249. Kidder, J. L. (2008). Appropriating the city: Space, theory,
and bike messengers. Theory and Society, 38(3), 307– 328.doi:10.1007/s11186-008-9079-8
Kidder, J. L. (2011).Urbanflow: Bike messengers and the city
(1st ed.). Ithaca, NY: ILR Press.
Kroes, E. P., & Sheldon, R. J. (1988). Stated preference methods. An introduction.Journal of Transport, Economics and Policy,
22(1), 11–25.
Larsen, J., & El-Geneidy, A. (2011). A travel behavior analysis of urban cycling facilities in Montréal, Canada.Transportation Research Part D: Transport and Environment,16(2), 172–177.
doi:10.1016/j.trd.2010.07.011
Ayuntamiento de Madrid. (2013).Plan de movilidad urbana sostenible del distrito centro de madrid. Madrid. Retrieved November 26, 2014, from http://www.madrid.es/Unidades Descentralizadas/UDCMovilidadTransportes/EspecialInforma tivo/PMUS/ficheros/RESEJEpmus.pdf
Ayuntamiento de Madrid. (2014). Informe de Seguimiento del desarrollo del PDMC (2008–2016). Madrid. Retrieved
November 26, 2014, fromhttp://www.madrid.es/Unidades Descentralizadas/UDCMovilidadTransportes/BICI/OficinaBici /Informeseguimiento desarrollo PDMC 20140414.pdf Menghini, G., Carrasco, N., Axhausen, K. W., & Schüssler, N.
(2010). Route choice of cyclists in Zurich. Transportation Research Part A: Policy and Practice,44(9), 754–765.doi:10. 1016/j.tra.2010.07.008
Monzon de Cáceres, A., Rondinella, G., & Muñoz López, B. (2011). Estudio de evaluación de la demanda, impacto social y sobre la movilidad urbana correspondiente al eje de la red básica de vías ciclistas de las calles Atocha. Mayor–Alcalá.
Noland, R. B., & Kunreuther, H. (1995). Short-run and long-run policies for increasing bicycle transportation for daily commuter trips. Transport Policy, 2(1), 67–79. doi:10. 1016/0967-070X(95)93248-W
O’Brien, O., Cheshire, J., & Batty, M. (2013). Mining bicycle sharing data for generating insights into sustainable trans-port systems. Journal of Transport Geography, 34, 262– 273.doi:10.1016/j.jtrangeo.2013.06.007
Ortúzar, J. D. D., Iacobelli, A., & Valeze, C. (2000). Estimating demand for a cycle-way network.Transportation Research Part A: Policy and Practice, 34(5), 353–373. doi:10.1016/ S0965-8564(99)00040-3
Roldán, O. M. G., Díaz, J. R. A., & Mellado, J. J. N. (2013). Cycling mobility accidentability in Spain.Securitas Vialis,
4(3), 97–104.doi:10.1007/s12615-012-9060-1
Tilahun, N. Y., Levinson, D. M., & Krizek, K. J. (2007). Trails, lanes, or traffic: Valuing bicycle facilities with an adaptive stated preference survey.Transportation Research Part A: Policy and Practice,41(4), 287–301.doi:10.1016/j.tra.2006. 09.007
Yang, C., & Mesbah, M. (2013). Route choice behaviour of cyclists by stated preference and revealed preference. In
Australasian transport research forum. Brisbane, Australia. Retrieved fromhttp://www.patrec.org/atrf.aspx Route. Zaltz Austwick, M., O’Brien, O., Strano, E., & Viana, M.
(2013). The structure of spatial networks and commu-nities in bicycle sharing systems.PloS One,8(9), e74685.
doi:10.1371/journal.pone.0074685