Transportation infrastructure impacts on firm location: the effect of a new
metro line in the suburbs of Madrid
Lucia Mejia-Dorantes , Antonio Paez , Jose Manuel Vassallo
Firm location patterns emerge as a consequence of multiple factors, including firm considerations, labor force availability, market opportunities, and transportation costs. Many of these factors are influenced by changes in accessibility wrought by new transportation infrastructure. In this paper we use spatial sta-tistical techniques and a micro-level data base to evaluate the effects of Madrid's metro line 12 (known as Metrosur) expansion on business location patterns. The case study is the municipality of Alcorcon, which is served by the new metro line since 2003. Specifically, we explore the location patterns by dif-ferent industry sectors, to evaluate if the new metro line has encouraged the emergence of a "Metrosur spatial economy". Our results indicate that the pattern of economic activity location is related to urban accessibility and that agglomeration, through economies of scale, also plays an important role. The results presented in this paper provide evidence useful to inform efficient transportation, urban, and regional economic planning.
1. Introduction
Commercial establishment location patterns are a consequence of multiple factors. Firms select a site for an establishment based whether the firm is market- or resource-oriented, the level of access to markets it can achieve, the availability of labor and re-sources, and the presence of appropriate real estate. Once a firm is established in a specific location, it also may generate interac-tions with other firms. It may attract complementary activities, developing local markets, or it may repel other business activities that try to avoid competition. Firms can find proximity to other business advantageous or disadvantageous depending on the char-acter of interactions. In most cases, there are reasons to believe that firms are not indifferent to the presence or absence of other firms in their neighborhood.
The theoretical foundation for the location patterns of firms is given by the concept of market areas. A market area is the geo-graphical extent of a firm's consumer base, and is determined by the firm's spatial pricing, the distribution of population, and the elasticity of demand of the good or service offered. In order to
maximize revenue and profit, firms consider how locating at a spe-cific location would affect their market potential based on their ability to set a price consistent with their marginal revenue and marginal costs. Consumers, it is assumed, will compare for compet-ing establishments their delivered price, which depends on the cost of transportation. Other things being equal, the cost of trans-portation generates in consumers a tendency to prefer firms with the lowest delivered price. Firm locational patterns emerge as a consequence (Hoover and Giarratani, 1971).
Madrid transportation modal share, 2004
Mode
Walking Urban Bus Metro Suburban Bus Suburban Train Car
Taxi Motorbike
Urban
32.00% 15.50% 19.90% 0.40% 2.30% 22.40%
6.60% 0.70%
Metropolitan
30.20% 0.10% 3.70% 12.10% 8.50% 44.50% 0.40% 0.50%
Metro monthly trips (miles) per year
70,000.00 -r
0.00
m ID r* oo 01 0"i Ol Ol 01 01 Ol 0) Ot Ol Ol
o *H IN m o o o o _
- - O O O O O O O O O O O t H i H i - i < - i < - i r > j r > j r M r M r M r M f M f N C N C N r N m yo r* oo en o o o o o o
Fig. 1. Modal share of urban and metropolitan trips in 2004 (jordá, 2009) and metro's monthly trips per year (Spain National Statistics Bureau, 2010).
question that must be examined in the context of the various fac-tors that influence location.
In practice, empirical analysis of spatial and temporal patterns of firm location is complicated due to lack of detailed firmographic data. Very few studies are available that examine these issues (Baumont et al., 2004; Manzato et al., 2011; Maoh and Kanaroglou, 2007). The studies of Maoh and colleagues (Maoh and Kanaroglou, 2007; Maoh, 2007; Maoh and Kanaroglou, 2009; Maoh et al., 2010; Ryan et al., 2009) for example, were facilitated by access to firm micro-data through a special program with Statistics Canada that allowed the researchers to work at a secure data facility site in Ot-tawa. This program has since been discontinued, and other suitable databases are typically not easy to access or simply do not exist.
The aim of this paper is to investigate the impact of changes in the accessibility surface on the location pattern of firms. Specifi-cally, we hypothesize that the change in accessibility wrought by
new infrastructure, with the consequent localized, and spatially differentiated reduction in transportation costs, affects the loca-tional patterns of businesses establishments, and generates a ten-dency to locate near transit facilities. Furthermore, we hypothesize that the location of firms is also affected by the surrounding oppor-tunity landscape, and the presence of other firms that may gener-ate economies of agglomeration and/or competition.
The case study presented in this paper is the Madrid Region. The focus is on the municipality of Alcorcon in the southwest of Madrid City, a zone long underserved by urban mass transportation. In or-der to improve service, a new metro line (Line 12), known as "Met-rosur", was built between 1999 and 2003 to connect the five most important municipalities in the region with each other, and also with Madrid City (see Fig. 2). The new infrastructure, which started operations in 2003, is a circular line that provides connectivity with commuter rail and the main segments of the metro network.
Madrid zonal fare
One of the main stated objectives of this metro line was to promote economic activity within the region, under the expectation that an improved transportation network in the area would facilitate not only travel to Madrid but would also become a pole of attraction for different firms that would help to create jobs in the region.
Herein, we propose to evaluate the impact of the new metro line the location pattern of business establishments. This research makes use of micro-data from the years 1998 and 2007 collected by the Bureau of Statistics of the Madrid Region. Analysis is based on the application of a spatial multinomial logistic model, which allows us to assess the impact of geographical attributes on the occupation of existing sites. This includes proximity to stations of the newly developed metro line, as well as proximity to other establishments.
The paper is organized in the following way. In the second tion we discuss the background to this research. In the third sec-tion, we discuss the characteristics of the study area. In the fourth section, we describe the methods and models used. In the fifth section, we present and discuss the results. The last section of-fers a final discussion and the main conclusions.
2. Background
During the past few decades, urban areas around the globe have experienced important changes due to decentralization of activi-ties. Urban form has in many places evolved, and is increasingly less defined by a unique pole of economic activity, i.e., a traditional Central Business District (CBD), and more by multiple suburban-ized economic poles. Employment, housing and population are therefore reorganized in new areas (Cuthbert and Anderson, 2002). Transportation, it is commonly agreed, has played a key role in facilitating and even encouraging this type of development.
Several factors are important for the development of locational patterns: available labor force and its cost, market opportunities, taxes and subsidies (if available), infrastructure, transportation accessibility, space, amenities and even personal decisions (Banis-ter and Berechman, 2001; Beckmann, 1999; Small, 1982). Compe-tition among business firms is also an important factor (Hoover and Giarratani, 1971). Furthermore, the location of firms and industries is influenced by geographic factors and agglomeration (Yrigoyen and Garcia, 2009). The latter is a consequence of econo-mies of scale, and means that the profit of some firms is improved when they operate in the context of a larger local economy, taking advantage of being closer to related firms (Cohen and Paul, 2005; Johansson and Quigley, 2003). When interdependent industries are attracted due to their economic linkages, it is even possible that these linkages attract them to other locations, such as out of urban centers. Whenever different types of firms locate closer, they even-tually create clusters, which impact the way commercial and industrial land uses are defined over space. Eventually, such a pro-cess of co-location can have broader implications for urban form (Maoh and Kanaroglou, 2007). If different industrial sectors take advantage of physical proximity to related firms, these agglomera-tions become economic poles. In order to create agglomeration economies, a powerful labor force should be present (Feser and Sweeney, 2000; Maoh, 2005).
Public transportation infrastructure can be a powerful driver of urban form. Authors, such as Banister and Berechman (2000), clas-sify those effects as: transportation-related effects, land-use ef-fects, and effects on jobs and business activities. The general explanation for these effects is that transit facilities increase the accessibility to public transportation for the people living nearby, therefore reducing their travel time to other destinations in urban areas. Similarly, business activities (both offices and shops) near the stations also enjoy some advantages: jobs and shops are now
more accessible for those coming from any destination; business activities close to the stations enjoy either the increase in the num-ber of people who pass by near the shops in their way to or from the stations, or the increase in the qualified labor force they can draw upon.
The effects on jobs and businesses are usually noticed over the long term and are mostly those produced by agglomeration econ-omies (Boarnet, 2006; Fujita, 1989). Moreover, researchers such as Mas and Maudos (2004), have shown that transportation infra-structure does not only have significant effects on the area directly influenced by it, but also on areas close or connected to it. In fact, economic development and economic growth are the result of the long-term increase in economic activities which can be attributed in part to the direct impact of improvements in the transportation infrastructure, such as travel time reductions that promote indus-trial agglomeration. However, as noticed by Banister and Berech-man (2001), economic development requires a social and political framework that prompts such economic growth, which in-cludes: policy actions and institutional support, the necessary funds for an efficient investment, and economic conditions as well as positive externalities.
On the other hand, authors such as Cervero and Aschauer for Cambridge Systematics (1998), and Schwanen et al. (2004) men-tion that Transit-Oriented Development (TOD) initiatives are important urban policy actions in order that areas around the transport stations become more attractive either for housing or for firms. These initiatives include among others: high density developments near transit stations, pedestrian-friendly neighbor-hood design especially through dense street patterns and mixed land uses. Different studies note as well, that the characteristics of the street network design determine the attractiveness of transit stations because most of the riders get to the stations by walking. Therefore, traditional street patterns (narrow roads with frequent crossings) enhance pedestrian access; while, newly developed areas designed for private transport (longer and wider roads, irreg-ular patterns) limit pedestrian access to the stations (Gutiérrez and García-Palomares, 2008; Mejia-Dorantes and Vassallo, 2010).
3. Study area and data
3.1. Regional context: the Madrid Region, the metro rail system and the Municipality ofAlcorcon
Almost six million people live in the Madrid Metropolitan Area (MMA) (CRTM, 2006). This area is composed of a large economic and social pole at the center (Madrid City with a population slightly over three million) and a set of small and medium-sized cities around this pole. Madrid City can be reached through both private and public means of transportation.
In terms of public transportation, the system in Madrid is multi-modal: commuter rail and metro network, urban and interurban buses, along with some relatively new light rail services. Fig. 1 shows the modal share either for urban trips or for metropolitan trips and the evolution of metro's monthly trips per year. The per-centage of people with a monthly travel pass living in zone A is equal to 28.8%; while this percentage decreases as we move farther from the core of Madrid: the percentage of people living in zone B with a travel pass is equal to 20.7% and equal to 17.2% in the case of zone C (TARYET & IMOP, 2005). This executive report also states that people are more prone to have a travel pass if their trips are multimodal.
its validity range. The Madrid metro network and the configuration of the different zonal fares in the region of Madrid are shown in Fig. 2.
In the last three decades, the municipality of Madrid itself has substantially restrained new real estate development inside its boundaries, leading to high real estate prices. Some municipalities outside of, but surrounding Madrid City, have reacted by promot-ing large real estate developments in order to increase the supply of affordable housing. As a consequence, some municipalities which four decades ago were small towns with little connection to Madrid City have within the span of a few years evolved into sa-tellite cities with large populations, and substantial numbers of commuters who travel regularly to Madrid City. The largest growth occurred in five municipalities located to the southwest of Madrid (Alcorcon, Mostoles, Leganes, Getafe and Fuenlabrada). This situa-tion is especially remarkable considering that the combined popu-lation of these municipalities has reached almost 1 million, compared to a population of slightly over 3 million in Madrid City.
Fig. 3 shows the location of these municipalities within the MMA. The shaded areas represent Madrid City. The darkest shaded areas show the central districts, while the areas that are only slightly shaded show the outer districts. Until recently, the metro system of Madrid City did not extend beyond the city limits so as to reach other municipalities (shaded areas).
The urban areas of the five municipalities mentioned before had largely unconnected population centers with mostly undeveloped areas between them. Local transportation systems in these cities used to focus on connecting these municipalities to the City of Ma-drid through both regional buses and commuter trains. However, transit services linking these five municipalities were extremely limited.
As these municipalities continued to grow, one of their most important issues became their status as dormitory communities. Accordingly, business activities and consequently local employ-ment opportunities were noticeably scarce in these municipalities. Appraising this situation, the Regional Government of Madrid adopted as a policy the promotion of a more balanced growth of those municipalities, and as a tool, the creation of greater transpor-tation accessibility and better linkages among these five munici-palities in order to create an economic region alternative to Madrid. A new circular metro line (line 12 or Metrosur) connecting
Fig. 3. Madrid metropolitan area (MMA). The municipalities marked with (*)
correspond to the municipalities connected by Metrosur and Alcorcon is marked with (**).
those five municipalities of the southwest of Madrid was the tan-gible outcome of the policy.
Metrosur was built entirely underground in order to minimize negative environmental impacts. This was the first time that the metro network was extended beyond Madrid City itself. This new line, currently in operation, contains 28 stations and is additionally connected to the metro network of the central city through Line 10. It also shares six transfer stations with the commuter rail lines "Cercanias" (see Fig. 2). The construction of Metrosur began in 1999 and its operation started in April 2003. It is a circle line of about 54.6 km, and its construction cost was about 52.7 million €/km, including the trains (Melis et al., 2003).
Alcorcon is the closest municipality to Madrid City served by Metrosur. The total area of its territory is about 33.6 km2, and its
population has notably increased over the years. Table 1 shows its most important characteristics.
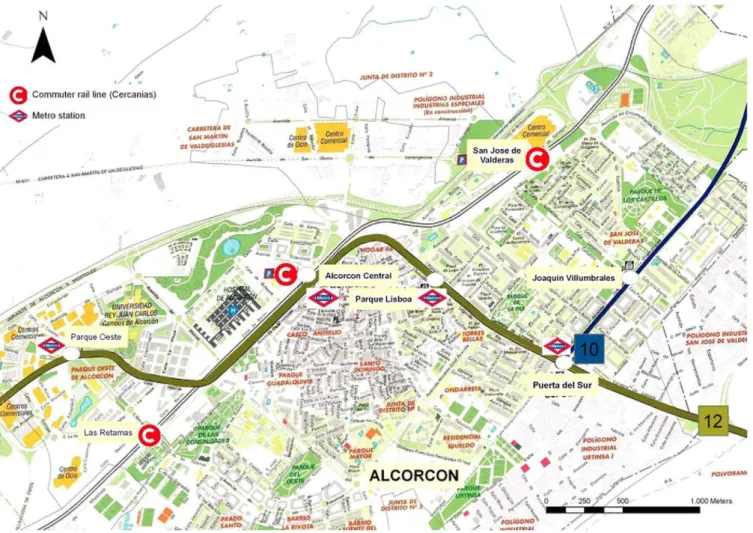
Alcorcon is served by different transport systems (see Figs. 3 and 4):
Four metro line 12 stations. This line is the one known as Met-rosur: Puerta del Sur (transfer to line 10), Parque de Lisboa, Alcor-con Central (transfer to Cercanías), and Parque Oeste.
Table 1
Alcorcon's urban, socio-economic and other characteristics (Bureau of Statistics of the Madrid Region, 2011).
Alcorcon Madrid Year Region
Territory
Distance to the Capital Population
Men Women Female rate
Index per 100 inhab.
Inhabitants under 14 years Inhabitants over 65 years
Labor market
People with social security/1000 inhab Rate of female economic activity Unemployment/100 inhab.
Macroeconomic info
Gross Domestic Product (Per Capita) Income Per Capita
Socioeconomic condition/1000 inhab.
Managers and technicians Businessmen in charge of workers Non-skilled workers
Pop/1000 inhab. working at
Retail and food services Transport and communications Financial services
Professional services
Social services and personal services Public administration and other
services Housing Family-owned In rent Other Persons/house Education Illiterate No education Primary education High-school education
University studies (college and higher)
Others
Cars/1000 inhab.
33.6 km2 8028 km2
13 km
167,967 6386,932 2009 82,705 3094,874 2009 85,262 3292,058 2009 1.03 1.06 2009
14.39 14.93 2009 14.55 14.43 2009
269.39 466.03 2008 42.34% 42.59% 2001 4.74 4.01 2008
16,305.00 31,577.00 2007 14,963.83 17,996.98 2007
138.56 159.88 2001 20.3 22.17 2001 105.46 90.85 2001
106.15 107.43 2008 22.35 37.5 2008 8.21 17.49 2008 37.66 112.99 2008 57.05 79.22 2008 21.23 49.52 2008
89.54% 82.02% 2001 7.98% 13.62% 2001 2.48% 4.36% 2001 3.01 2.88 2001
1.50% 1.77% 2001 10.70% 9.97% 2001 19.00% 17.44% 2001 54.18% 50.09% 2001 15.15% 20.74% 2001
^//<s?
MFs
r ALCORCON
^
^ JmS* * ^ZSK* *^ ^*\ r-new*
»
^ ///¡SE j¡MJLs¿r
%¿&Í
Fig. 4. Metrosur and Cercanías
"'
ALCORCON
^
S
J
^
runout • .- > . ;
stations within Alcorcon (self-modified after a map from Melis et al. (2003)).
\ JUNTA 0 I \
:f be'"'» «*J
Two metro line 10 stations: Puerta del Sur (transfer to Metrosur) and Joaquin Villumbrales. This line takes people directly to Madrid downtown. Moreover the extension of this metro line to Alcorcon was built at the same time as Metrosur was built. Three commuter train stations. This system is also known as Cercanías: Las Retamas, Alcorcon Central (transfer to Metrosur) and San Jose de Valderas.
It is served as well by different interurban buses that have stops through all the territory.
Recently, a light rail line started to operate through the west of Alcorcon and has two stations; however it has limited connec-tion to the urban areas.
Furthermore, Alcorcon is the multimodal gateway to the rest of the municipalities.
3.2. Data
The dataset used in this research includes detailed geographical information regarding the location of economic activities within Alcorcon from 1998 to 2007, as provided by the Bureau of Statistics of the Madrid Region. In general terms, data for the region are lim-ited (Le Gallo and Chasco, 2008). For each year, the Bureau gives the exact location of the establishment, so-called portal, that is, an address available for commercial activity. The availability of a geographical reference makes it possible to relate each portal to spatial variables of interest. In addition, the database contains the type of economic activity to the Spanish CNAE codes (National
Classification of Economic Activities), as seen in Table 2. However, other data to characterize the establishments do not exist, such as number of employees, revenue, and profit.
The set of spatial variables considered is shown in Table 3. The literature on this matter indicates that accessibility and other ur-ban characteristics affect the location of different types of estab-lishments. For example, a number of variables describe proximity to various landmarks, including distance to the nearest Metrosur Station, and distances to the traditional business district of the municipality, commuter train station, and interurban bus stop. Additional variables were considered in order to describe the po-tential of the market (i.e. population density: POPDEN) and the
Table 2
Economic sectors analyzed. Sector
BC1 BC2 BC3 BC4 BC5 BC6 BC7 BC8 BC9
Description Manufacturing firms Construction firms
Retail and related business activities Food service and hotel business activities Transport, storage and communication firms Finance, insurance, real estate, rental and other enterprise services
Health and vet; social services; cultural and recrational; sport activities
Others Vacant Total
Table 3
Explanatory variables used in the specification of the models.
Variable Units Description SECTOR MS_DISTNET CBD_DISTNET CER_DISTNET INT_DISTNET ROADEXIT_D ROAD_DEN POPDEN km km km km km 10 km/km2
1000/km2
Dependent variable. 1 if that location is in use by the/business activity in 2007 Street network distance from each possible location to the closest Metrosur station Street network distance from each possible location to Alcorcon downtown
Street network distance from each possible location to the closest commuter train station (Cercanías) Street network distance from each possible location to the closest Interurban bus stop
Street network distance from each possible location to the closest motorway exit Street density around 100 m for each location
Population density around 100 m for each location Constant
rBcl (1998:
r80 (1998: r8" (1998:
r8" (1998:
r8" (1998: 1^(1998: r8" (1998: r8^ (1998:
100 m) 100 m) 100 m) 100 m) 100 m) 100 m) 100 m) 100 m) Proportion Proportion Proportion Proportion Proportion Proportion Proportion Proportion At each At each At each At each At each At each At each At each location, location, location, location, location, location, location, location, the vector the vector the vector the vector the vector the vector the vector the vector ofBCl ofBC2 ofBC3 ofBC4 ofBC5 ofBC6 ofBC7 ofBC8 firms firms firms firms firms firms firms firms around around around around around around around around 100 m 100 m 100 m 100 m 100 m 100 m 100 m 100 m in 1998 in 1998 in 1998 in 1998 in 1998 in 1998 in 1998 in 1998
built environment (i.e. road density: ROAD_DEN). Finally, spatial agglomeration of firms is measured by means of a location-specific occupancy ratio variable (rf), which the number of economic activ-ities of a certain type k that were located in the neighborhood of a specific location i in 1998. This variable is used to assess the hypothesis that location patterns are influenced by proximity to certain types of activities.
All of the spatial variables described above are used to charac-terize the local environment of a portal. Occupancy ratio in partic-ular was calculated using a spatial weights matrix (Bailey and Gatrell, 1995). The spatial weights matrix defines, for each location in the analysis, the neighbors within a specified radius. Sites within that radius are assigned a value of 1 or a value of zero otherwise. This binary matrix was combined with the occupation statistics of 1998. Sector-specific occupancy ratios were defined for each of the eight sectors in the analysis. This was done by dividing the number of establishments of type i by the total number of sites (including vacant) in the same area. This gives a measure of geo-graphical clustering of business that allows us to analyze whether the location of economic activities is influenced, in addition to proximity to transportation infrastructure, by agglomeration econ-omies. A radius of 100 m was selected for the spatial weights ma-trix after extensive sensitivity analysis of model fit.
Some variables of interest were not available. In particular, land rent statistics do not exist. In a similar way, employment statistics could not be used since the datasets on this matter are very lim-ited, especially in 1998. Moreover, the existent information about jobs is very broadly categorized, which greatly limits its usability.
4. Methods and models
Data processing was conducted using a Geographic Information System (GIS). GIS integrates the information to be managed under one system. It provides important tools for transportation research and planning, from pre-processing and processing of data, to fun-damental spatial analysis operations such as the calculation of dis-tances, areas, frequencies, and spatial relationships (Hsiao et al., 1997; Miller and Shaw, 2001) This research takes into account the distances from each location to the different facilities evalu-ated, such as the closest metro station through the street network, which increases the confidence in the analysis through the use of actual distances between points (Gutiérrez and García-Palomares, 2008; Mejia-Dorantes et al., 2011).
In terms of the analysis, we adopt a spatial statistical approach to the analysis of urban systems (Páez and Scott, 2004). We begin
with a spatial description of the spatial pattern of firms. A useful descriptive statistic is obtained by means of kernel surfaces to investigate the density of a point pattern. While the descriptive statistic can provide evidence of clustering, it does not help to ex-plain the factors that may cause the pattern. Therefore, we also ap-ply a spatial modeling approach based on multinomial logit models to tease out the contribution of different factors that help explain the location decision of firms.
4.1. Point pattern
There are different statistical methods to analyze urban pat-terns. One of them is the point pattern analysis, which evaluates the distribution of events over an urban area. To analyze the firm location evolution over time and its clustering, the kernel estima-tion method for point pattern analysis can be used. Kernel surfaces are a powerful tool for the exploration of the spatial and temporal characteristics of clustering (Bailey and Gatrell, 1995; Cressie, 1991). This type of analysis has been implemented in the past in urban analysis by, among others, Cuthbert and Anderson (2002) and Maoh et al. (2010). It generates density surfaces that show where point features are concentrated, which in this case allows the identification of zones with high density of firms. The outcome is a continuous surface which represents the number of firms by business activity per square meter in the years 1998 (before the metro line was introduced) to 2007 (when the completed line was in full operation).
Kernel estimation is an extension of the moving window ap-proach. It was originally developed to obtain a smooth estimate of a univariate or multivariate probability density from an ob-served sample of observations; in other words, a smooth histo-gram. Estimating the intensity of a spatial point pattern is very like estimating a bivariate probability density and bivariate kernel estimation can be easily adapted to give an estimate of intensity (Bailey and Gatrell, 1995).
If s represents a general location in R and s^ sn are the
loca-tions of the n observed events then the intensity, l(s), at s is esti-mated by:
1 1=1
•Si
0)
amount of smoothing, essentially it is the radius of a disk centered on s within which points s, will contribute significantly to lT(s).
Edge corrections are also used.
There are different possible functional forms of the kernel esti-mate. ArcGis uses the Quadratic normalized function, where dis-tances have been divided by the kernel bandwidth (De Smith et al., 2007). As a smoothing, exploratory technique, the bandwidth for the kernel is selected by visual inspection of the results in order to discover potential patterns. Further information regarding the theory about intensity functions can be found at Bailey and Gatrell (1995), Cressie (1991), and De Smith et al. (2007).
4.2. Model
The proposed model is based on the population of sites (portals) available for commercial activities, and the probability that a spe-cific site will be occupied by a spespe-cific form of activity. The vari-ables used in the analysis are presented in Table 4. The analysis is conducted using the multinomial logit model (MNL).
The multinomial logit model (MNL) is commonly used in trans-portation studies. It is an extension of the simple logit model for dichotomous variables. The form of the logit model prevalent in transportation applications is based on McFadden's random utility approach to model discrete choices (the so-called conditional lo-git). Previous studies have, in analogy to random utility, framed firm locational processes as the outcome of a profit maximization approach. Firms are the unit of analysis, and the locations are the outcome of their choices. In the present case we apply instead a probabilistic model that sees the portal as the unit of analysis, and its state as the outcome. Each portal can, at a given time, be in one and only one of a finite set of states: vacant or occupied by an establishment of type j .
To some extent, the selection of a probabilistic model is dictated by our data availability situation. While profit maximization is compatible with economic theory, it requires information about the firms, attributes which are not known in our case. Furthermore, it is quite possible that one firm could have in fact a number of establishments, i.e., that it operates out of various locations -again, a piece of information that was not available. The technical differences between the choice-based and probabilistic approaches
are rather minimal, but important from a conceptual and practical perspective. As an approach to model locational firm patterns, our probabilistic approach loses some economic theoretical appeal. On the other hand, it helps us circumvent some serious data and mod-eling issues, including the treatment of single firms owning multi-ple establishments.
Herein, two models were tested. First, a MNL was estimated using all variables with the exception of the occupancy ratios that account for the information of the spatial relationship with busi-ness activities in 1998 (Model 0). In the second model (Model 1), occupancy ratios were introduced. This expanded model provided a better fit. Model 0 is used for the Likelihood Ratio test (LR test), which is the statistical test for comparing two different models when one of them is a special case of the other. Due to space con-straints, only Model 1 is presented in this paper. In the model, one of the outcome classes is arbitrarily set as the base outcome. For ease of interpretation, in this study we select vacant as the refer-ence category.
The multinomial logit probability for outcome j can be pre-sented as:
Pj =
m-lrfx
(2)The spatial version of the model incorporates a spatial weights matrix as described above. Now the probability of a portal being in state j depends on a set of covariates x and also the presence/ab-sence of other businesses in the neighborhood. The weights in ma-trix W are defined as follows:
1 if d¡j < d* for iVj
0 otherwise (3)
where d¡¡ is the distance between locations i and j , and d* is a critical cut-off distance (100 m in our case).
Further, we define vectors of occupancy as a set of dummy variables that indicate for each available location its occupancy status:
0 =
1 if portal i was of type k in 19980 otherwise (4)
Table 4
Multinomial logit model summary: parameter estimates by activity sector which accounts for the spatial relationship with business activities in 1998 by means of the occupancy ratios. BC9 is the base outcome.
Var
Model 1. (reference is
MS_DISTNET CBD_DISTNET CER_DISTNET INT_DISTNET ROADEXIT_D ROAD DEN (100 m) POP DEN (100 m)
j-BCl J.BC2 J.BC3 J.BC4 J.BC5 J.BC6 J&C7 J&C& Const Units B9: vacant) km km km km km 10 km/km2
1000/km2 Proportion Proportion Proportion Proportion Proportion Proportion Proportion Proportion km Min 0 0.017 0.0771 0 0.07 0.31 0 0 0 0 0 0 0 0 0 1 Max 6.3657 6.6227 6.3354 2.4497 2.68 10.9 15.28 0.6667 1 1 1 0.5 0.5 1 0.5 1 BC1 -0.5384 -0.9165 1.5329 0.7399 -0.2909 -0.1264 0.0072 3.9774 0.1271 -0.9302 2.9027 -3.4585 0.8652 4.4268 2.4243 -2.6428 BC2 -0.5125 -0.1299 0.6732 -0.8090 0.1037 -0.0962 0.0920 1.1914 1.2940 -1.3777 3.0523 -2.1089 0.8466 5.3570 -0.2755 -2.5146 BC3 -0.6054 -0.2837 0.9177 0.2047 -0.3234 -0.1438 0.0884 1.3198 -2.2504 0.5328 2.9747 -3.1176 2.1393 4.1832 0.6960 -1.5107 BC4 -0.6948 -0.0989 0.4812 -0.9699 0.0442 -0.2395 0.1014 0.2446 -1.0452 -0.8203 6.5152 -6.2806 1.8591 5.1395 1.6662 -1.8525 BC5 -0.5498 0.0218 0.3591 -0.8615 0.5016 -0.2543 0.1130 0.5996 -1.2131 -1.0411 3.2528 0.3428 2.8250 3.8088 -0.9578 -2.7011 BC6 -0.4948 -0.0565 0.3776 -0.0773 -0.1147 -0.1411 0.0662 1.4816 -0.5555 -1.3306 1.4986 -1.4351 7.3588 4.2552 1.9388 -1.9175 BC7 -0.4754 0.0621 0.2057 -1.1065 0.0350 -0.1935 0.1122 1.4426 -0.6822 -1.5722 1.2727 -2.3020 3.6705 8.1500 3.7233 -1.8388 BC8 -0.7923 -0.2053 0.3825 -1.5035 0.2448 -0.2896 0.0885 -1.3367 -5.1484 -1.4046 1.6257 -2.5277 4.4106 2.4487 9.6891 -2.1901
Observations (n) = 8154.
Number of parameters in Model 0 = 7; log likelihood model 0 = Number of parameters in Model 1 = 15; log likelihood model 1 = LR test (vs Model 0) = 515.68; "not significant at 5%.
The occupancy ratio at location i for activity class k gives a mea-sure of agglomeration in the preceding time period. This ratio is calculated based on the spatial weights matrix and occupancy as follows:
(5)
The value of r¡ is the number of available sites that were occu-pied by activities of type k in 1998, divided by the total number of sites available for occupancy. The multinomial logit model with this spatial component becomes:
P> =
e^'+E-í
(6)
The model in Eq. (6) is the multinomial version of the spatial lo-git model introduced by Dubin (1995) however using a binary weights matrix instead of a negative exponential distance decay. Similar models were used by Páez and Suzuki (2001) in their examination of land use change, and Páez and Scott (2007) with reference to social networks.
5. Results
The kernel surfaces show a different spatial variation pattern, depending on the type of activity at each location. Kernel estima-tion smoothes the data, therefore, white zones do not always imply a lack of economic activity within that area. It may only be very low relative to other areas where the value is higher. The maps
Alcorcon
Kernel differences among 2007-1998
Alcorcon Central
Parque Oestes
Las RetamasW
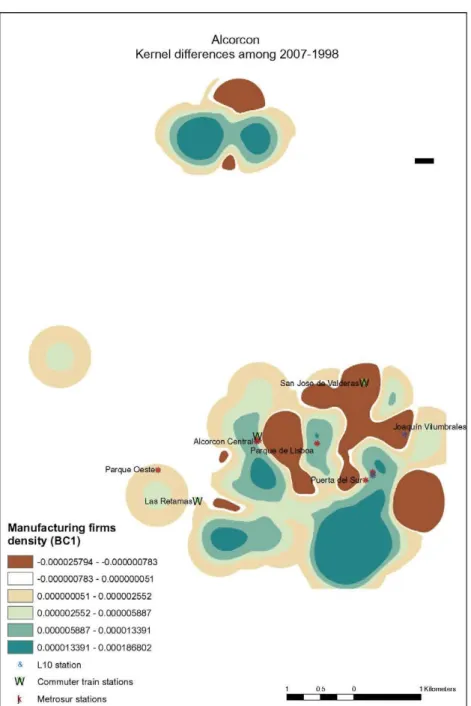
Manufacturing firms density (BC1)
| -0.000025794 - -0.000000783 ~^\ -0.000000783 - 0.000000051 ~^\ 0.000000051 - 0.000002552 ~^\ 0.000002552 - 0.000005887 | 0.000005887-0.000013391
| 0.000013391 -0.000186802
s L10 station
W Commuter train stations
K Metrosur stations
Alcorcon
Kernel differences among 2007-1998
I
San Jose de ValderasW
Alcorcon Central
Parque de Lisboa
Joaquín VHumbrale
*
Parque Oeste
Las Retamas W
Construction firms density (BC2)
| -0.000002902 - -0.000001088
^\ -0.000001088 - -0.000000483
^2 -0.000000483 - 0.000003145
2\ 0.000003145-0.000014634
2\ 0.000014634-0.000041845
| 0.000041845-0.000151293
s L10 station
W C o m m u t e r train stations
¡; Metrosur stations
Fig. 6. Kernel density maps for different types of economic activities. They show the difference in economic activities between 2007 and 1998.
(Figs. 5-11) provide relevant information regarding how each type of activity locates in space over time and how they cluster: They indicate the presence of clustering patterns while showing an in-crease in economic activities over time. Some of the economic activities have higher density changes than others. It is also possi-ble to appreciate that the north of the Municipality did not display an important increase of economic activities. It is worth noting that densities tend to surround metro stations; that Sector B3 (retail and similar) presents the highest density pattern and that the loca-tion of economic activities diminishes near the commuter train station "Las Retamas" and the metro station "Parque del Oeste". Both these zones have low density development with wide streets, which may limit pedestrian mobility.
Interestingly, the pattern by manufacturing firms has not par-ticularly increased its density in ten years, as can be seen in
Fig. 5 (BC1). This is the case of resource-oriented firms. It seems that the geographic location of Alcorcon and its proximity to Ma-drid City through different means of transport increases other kind of economic sectors, mainly market-oriented firms (Figs. 6-11, BC2-BC7).
The construction gives signs of an increased activity pattern through the territory. It is possible to appreciate a sprawling pat-tern, away from the local CBD. If we take into account that Alcor-con increased its population over the years, firms related to the construction sector were necessary for the housing needs.
Alcorcon
Kernel differences among 2007-1998
\
San Jose de ValderasWParque Oeste
Las R e t a m a s W
r
corcon CentraHP ^ ^ ^ Parque de LisboaJoaquín Vilumbrales
Puerta del Sur
Retail firms density (BC3)
| -0.000141233--0.000001787 | -0.000001787--0.000000107
^2 -0.000000107-0.000006613
2\ 0.000006613-0.000020054
| 0.000020054 - 0.000055336 | 0.000055336-0.000287186
s L10 station
W C o m m u t e r train stations
¡; Metrosur stations
Fig. 7. Kernel density maps for different types of economic activities. They show the difference in economic activities between 2007 and 1998.
urban development areas may limit the expansion of retail stores which may have to move to other zones with larger land availabil-ity and even with lower land prices.
The main changes in density patterns appear to have happened outside of the CBD. All sectors expand following the same sprawl-ing pattern. The former impressions brought about by the descrip-tive spatial analysis are borne by the multivariate models. The parameter estimates of the multinomial logit model (Table 4), pro-vide further insights into the location patterns of various sectors. Model 1 shows that Metrosur is relevant for every sector of economic activity at a very high confidence level. Recalling that the reference outcome is "vacant", the models indicate that the probability of a portal being occupied decreases with increasing distance from the nearest Metrosur station. According to Model 1, the effect is relevant in every case although there are slight dif-ferences depending on the type of economic activity. Model also shows that although the effect of agglomeration economies is
al-ways positive, in the case of Alcorcon it is not alal-ways significant, as it can be noted on BC2 (Construction); BC3 (Retail) and BC5 (Transport, Storage and Communications). It implies that espe-cially in the case of those economic activities, they have been drawn to a site with good accessibility, which is in general related to Metrosur, as it is explained in the following paragraphs.
Alcorcon
Kernel differences among 2007-1998
•
Parque O e s t e *
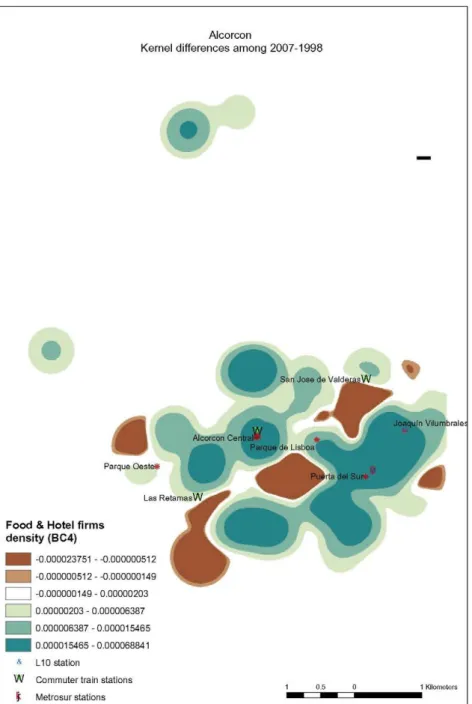
Food & Hotel firms density (BC4)
| -0.000023751 --0.000000512 | -0.000000512--0.000000149 2\ -0.000000149 - 0.00000203 2} 0.00000203 - 0.000006387 2] 0.000006387-0.000015465 | 0.000015465-0.000068841
& L10 station
W Commuter train stations
t Metrosur stations
Fig. 8. Kernel density maps for different types of economic activities. They show the difference in economic activities between 2007 and 1998.
newer transport infrastructure, and it connects to the surrounding municipalities, whereas Cercanías only connects to the Municipal-ity below, Mostoles, and to Madrid CMunicipal-ity.
Population density plays an important role in the location of economic activities. Areas with low population density such as semi-detached or detached houses limit the location of businesses. It implies that, in order to have the maximum profitability of the public transport infrastructure, TOD strategies should accompany the location of stations. These results are also in the line with Maoh et al. (2010), which affirm that there is a strong dependency among residential and commercial land uses.
In the case of road density, both models offer similar results: A higher road density decreases the probability of location of any economic activity. One of the explanations might be that higher density patterns are located in downtown and as kernel maps show, the trend is that economic activities are sprawl, which im-plies more land availability. On the other hand, distance to the
closest motorway exits seems not to be an important factor when locating any type of business activity within Alcorcon. Hence, this would mean that neither of both road accessibility indicators is important when locating an economic activity, since the whole municipality benefits from good motorway accessibility: It should be borne in mind that the Madrid metropolitan area has one of the highest rates of kilometers of motorways per habitant in Europe (Fundación de la energía de la Comunidad de Madrid, 2010).
Regarding the variable CBD, model 1 shows that in most of the cases, distance to Alcorcon downtown is not relevant. The param-eter suggests that Alcorcon does not follow a monocentric pattern. This parameter is consistent with the Kernel surfaces.
In the case of interurban buses, the model suggests that being closer to a bus stop in some cases implies a greater opportunity for a business activity, however in other cases it is not significant. The rBC variables for all sectors shed some light on the
Al co reo n
Kernel differences among 2007-1998
San Jose de V a l d e r a s W
MWco
Parque O e s t e *
* •
Icorcon Central
Parque de Lisboa
r b r £ n VilumbraleE
Puerta del Sur
Las R e t a m a s W
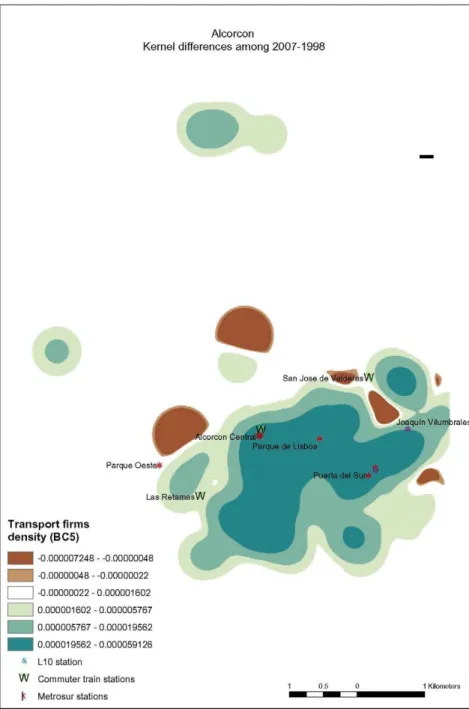
Transport firms density (BC5)
| -0.000007248 - -0.00000048
| -0.00000048--0.00000022 2\ -0.00000022-0.000001602 2} 0.000001602-0.000005767 | 0.000005767-0.000019562 | 0.000019562-0.000059126
& L10 station
W Commuter train stations
K Metrosur stations
Fig. 9. Kernel density maps for different types of economic activities. They show the difference in economic activities between 2007 and 1998.
there was already the same group business activities in 1998 (principal diagonal) increases the probability of locating a firm re-lated to the same sector. This statement holds except for BC2, BC3 and BC5.
Finally, the model sheds some light on the location dynamics of economic activities within this region. There seems to be some advantages or disadvantages on the location of different types of economic activities as a result of the development of local markets or the reaction to competition. For instance, in 1998 an area with retail activities (rBC3) decreases the probability of location of other
types of economic activities, but it increases the location of the same type of activity in 2007. This statement might be related to the higher land values, to the lack of land availability or to a rejec-tion to competirejec-tion. On the other hand, in 1998 an area with neigh-boring financial activities (rBC6) increases the probability of
locating any type of economic activities in 2007, which might be related to economies of scale.
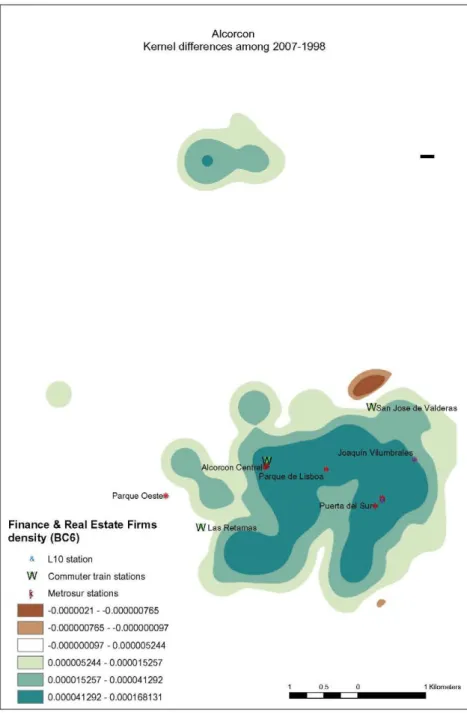
6. Discussion and conclusions
The objective of this paper has been to analyze economic activ-ity spatial patterns using spatial analysis techniques and models, along with a detailed data base. Herein, we examined the loca-tional pattern and relevant factors for different industry sectors within the territory of Alcorcon. In particular, the analysis has been of how this location pattern changed following the introduction of a new major rail transit project. The results indicate the presence of spatial clusters. They also show an increase in economic activi-ties over time, with retail activiactivi-ties displaying the highest pattern of concentration. This is consistent with their market orientation. It seems that market-oriented firms have displaced manufacturing firms within the territory.
trans-A l c o r c o n
K e r n e l d i f f e r e n c e s a m o n g 2 0 0 7 - 1 9 9 8
W S a n Jose de Valderas
Parque Oeste
F i n a n c e & Real E s t a t e F i r m s d e n s i t y ( B C 6 )
& L10 station
W Commuter train stations j Metrosur stations
| -0.0000021 --0.000000765 | -0.000000765 - -0.000000097 ^¡ -0.000000097 - 0.000005244 2\ 0.000005244 - 0.000015257
0.000015257-0.000041292 0.000041292-0.000168131
Alcorcon Central1
W L a s ^ B
Fig. 10. Kernel density maps for different types of economic activities. They show the difference in economic activities between 2007 and 1998.
port and finance and real estate) are related to urban characteris-tics, such as distance to different public transport infrastructure; population and street network densities; local CBD and a ratio of business occupation around each location point in 1998. Our esti-mates show that firms benefit from neighborhood characteristics. We conclude that the changes in accessibility related to Metrosur affected the locational pattern and generated a tendency to locate near Metro stations. However, and this is a key point supported by our use of spatial modeling approaches, the pattern is also a consequence of agglomeration economies and other neighborhood characteristics such as the location around places with higher pop-ulation, which may be seen as zones with more potential clients or workers. It is important to note that the types of firms where agglomeration with the same type of activities were not significant are the ones related to construction, transport and retail which might be a consequence, in addition to the nature of these activi-ties, of land availability constraints and other macro-level factors,
such as the general geographic situation of the municipality within the region.
Alcorcon
Kernel differences among 2007-1998
<
%
%
^
•
Alcorcon Central
^ H . P a r q u e <
Parque Oeste
Health & Social W L a s RetarTlas
Services density (BC7)
| -0.000003146 --0.000000656 | -0.000000656 --0.000000241 [ ] -0.000000241 -0.000002663 ^\ 0.000002663 - 0.000009302
0.000009302-0.000026314 | 0.000026314-0.00010266
& L10 station
W Commuter train stations
1
Sc Metrosur stations
W S a n Jose de Valderas
_^^^
Joaquin VilumbralesÉ
e Lisboa ^ V
Puerta del Sur
P ^
V
^ ^
0 5 0 1 Kilometers
Fig. 11. Kernel density maps for different types of economic activities. They show the difference in economic activities between 2007 and 1998.
Metrosur. More generally, the approach used here should be appli-cable to other cities, as long as similar databases can be obtained. Finally, this paper leaves many doors opened for future research, such as an analysis among parameters of the five municipalities connected by Metrosur, which could be of great interest.
The authors would like to thank the Bureau of Statistics of the Madrid Region for the information shared with us to carry out this research. Financial support from the Ministry of Science and Inno-vation of Spain (TRA2006-07008) is gratefully acknowledged.
Bailey, T.C., Gatrell, A.C., 1995. Interactive Spatial Data Analysis. Longman Harlow, Essex, UK.
Banister, D., Berechman, J., 2000. Transport Investment and Economic Development. Routledge.
Banister, D., Berechman, Y., 2001. Transport investment and the promotion of economic growth. Journal of Transport Geography 9 (3), 209-218.
Baumont, C, Ertur, C, Le Gallo, J., 2004. Spatial analysis of employment and population density: the case of the agglomeration of Dijon 1999. Geographical Analysis 36 (2), 146-177.
Beckmann, M.J., 1999. Lectures on Location Theory. Springer, Germany.
Boarnet, M.G., 2006. Conducting Impact Evaluations in Urban Transport. Doing Impact Evaluation Series 5. The World Bank.
Bureau of Statistics of the Madrid Region, 2011. Database: Municipalities' Files, 2011 (10/01).
Cervero, R., Aschauer, D.A., 1998. Economic Impact Analysis of Transit Investments: Guidebook for Practitioners. Cambridge Systematics, National Research Council (US), Washington, DC.
Cohen, J.P., Paul, C.J.M., 2005. Agglomeration economies and industry location decisions: the impacts of spatial and industrial spillovers. Regional Science and Urban Economics 35 (3), 215-237.
Cressie, N., 1991. Statistics for Spatial Data. John Wiley and Sons, Inc., USA. CRTM - Consorcio Regional de Transportes de Madrid, 2006. Encuesta domiciliaria
Cuthbert, AL., Anderson, W.P., 2002. Using spatial statistics to examine the pattern of Urban Land development in Halifax-Dartmouth. The Professional Geographer 54 (4), 521-532.
De Smith, M.J., Goodchild, M.F., Longle, P., 2007. Geospatial Analysis: A Comprehensive Guide to Principles. Techniques and Software Tools. Matador, Leicester.
Dubin, R., 1995. Estimating logit models with spatial dependence. In: Anselin, L, Florax, R. (Eds.), New Directions in Spatial Econometrics. Springer-Verlag, Heidelberg, pp. 229-242.
Feser, E.J., Sweeney, S.H., 2000. A test for the coincident economic and spatial clustering of business enterprises. Journal of Geographical Systems 2 (4), 349-373.
Fujita, M., 1989. Urban Economic Theory: Land Use and City Size. Cambridge University Press, UK.
Fundación de la energía de la Comunidad de Madrid, 2010. Movilidad urbana sostenible: Un reto energético y ambiental.
Gutiérrez, J., García-Palomares, J.C., 2008. Distance-measure impacts on the calculation of transport service areas using GIS. Environment and Planning B: Planning and Design 35 (3), 480-503.
Hoover, E.M., Giarratani, F, 1971. An Introduction to Regional Economics. McGraw-Hill, New York.
Hsiao, S., Lu, J., Sterling, J., Weatherford, M., 1997. Use of geographic information system for analysis of transit pedestrian access. Transportation Research Record: Journal of the Transportation Research Board 1604, 50-59.
Johansson, B., Quigley, J.M., 2003. Agglomeration and networks in spatial economies. Papers in Regional Science 83 (1), 165-176.
Jordá, P., 2009. Time use constraints in multimodal trips making. In: Proceedings Young Researches Seminar.
Le Gallo, J., Chasco, C, 2008. Spatial analysis of urban growth in Spain, 1900-2001. Empirical Economics 34 (1), 59-80.
Manzato, G., Arentze, T., Timmermans, H., Ettema, D., 2011. Exploring location influences on firm survival rates using parametric duration models. In: Transportation Research Board 90th Annual Meeting.
Maoh, H.F., 2005. Modeling Firm Demography in Urban Areas with an Application to Hamilton, Ontario: Towards an Agent-Based Microsimulation Model. ETD Collection for McMaster University.
Maoh, H., 2007. Business establishment mobility behavior in urban areas: a microanalytical model for the City of Hamilton in Ontario, Canada. Journal of Geographical Systems 9 (3), 229-252.
Maoh, H., Kanaroglou, P., 2007. Geographic clustering of firms and urban form: a multivariate analysis. Journal of Geographical Systems 9 (1), 29-52.
Maoh, H., Kanaroglou, P., 2009. Location of business establishments: a micro-analytical model for the City of Hamilton in Ontario, Canada. Transportation Research Record: Journal of the Transportation Research Board 2133, 33-45. Maoh, H.F., Koronios, M., Kanaroglou, P., 2010. Exploring the land development
process and its impact on urban form in Hamilton, Ontario. Canadian Geographer/Le Géographe Canadien 54 (1), 68-86.
Mas, M., Maudos, J., 2004. Infraestructuras y Crecimiento Regional En España Diez Años Después. In: Villaverde Castro, J. (Ed.), Competitividad Regional En La Unión Europea Ampliada, first ed. Instituto de Estudios Fiscales, p. 143. Mejia-Dorantes, L, Vassallo, J., 2010. Does A New Metro Line Promote Business
Activities Close to Its Stations? Case study of Metrosur in Madrid. TRANSyT Working Papers: 2010-01-EN (February 25, 2010).
Mejia-Dorantes, L., Paez, A., Vassallo, J., 2011. Analyzing house prices to assess economic impacts of new public transport infrastructure: Madrid metro line 12. Transportation Research Record: Journal of the Transportation Research Board. Melis, M., Arnaiz, M., Trabada, J., Diaz, J. M., Olivé, R., González, A., Alonso, J.P., de Matías, L, Lera, M., Diez, J.C., Herrera, M., Juncá, J A , 2003. Metrosur, first ed. Comunidad Autónoma de Madrid, Madrid. ISBN: 9788445124741.
Miller, H.J., Shaw, S.L, 2001. Geographic Information Systems for Transportation: Principles and Applications. Oxford University Press, USA.
Páez, A., Scott, D.M., 2004. Spatial statistics for urban analysis: a review of techniques with examples. Geojournal 61, 53-67.
Páez, A., Scott, D.M., 2007. Social influence on travel behavior: a simulation example of the decision to telecommute. Environment and Planning A 39 (3), 647-665. Páez, A, Suzuki, J., 2001. Transportation impacts on land use change: an assessment
considering neighborhood effects. Journal of the Eastern Asia Society for Transportation Studies 4 (6), 47-59.
Ryan, J., Maoh, H., Kanaroglou, P., 2009. Population synthesis: comparing the major techniques using a small, complete population of firms. Geographical Analysis 41 (2), 181-203.
Schwanen, T., Dijst, M., Dieleman, F.M., 2004. Policies for urban form and their impact on travel: the Netherlands experience. Urban Studies 41 (3), 579-603. Small, K.A., 1982. Geographically Differentiated Taxes and the Location of Firms.
Princeton Urban and Regional Research Center, Princeton, New Jersey. Spain National Statistics Bureau, 2010. Madrid Urban Transportation, 2011 (02/02/
2011).
TARYET & IMOP, 2005. Aspectos socioeconómicos y de movilidad. Resumen ejecutivo de la encuesta domiciliaria de movilidad de 2004 en la Comunidad de Madrid. Yrigoyen, C.C., García, A.M.L., 2009. In: Paez, A., Gallo, J., Buliung, R., Dall'erba, S.