Simple nonlinearity evaluation and modeling of low-noise amplifiers with
application to radio astronomy receivers
F. J. Casas, J. P. Pascual, M. L. de la Fuente, E. Artal, and J. Portilla
Citation: Rev. Sci. Instrum. 81, 074704 (2010); doi: 10.1063/1.3463295
View online: http://dx.doi.org/10.1063/1.3463295
View Table of Contents: http://rsi.aip.org/resource/1/RSINAK/v81/i7
Published by the American Institute of Physics.
Related Articles
Controlling a telescope chopping secondary mirror assembly using a signal deconvolution technique Rev. Sci. Instrum. 74, 3802 (2003)
A wideband lag correlator for heterodyne spectroscopy of broad astronomical and atmospheric spectral lines Rev. Sci. Instrum. 72, 1531 (2001)
A medium-frequency interferometer for studying auroral radio emissions Rev. Sci. Instrum. 71, 3200 (2000)
Implementation of a photonic automatic gain control system for correcting gain variations in the Green Bank Telescope fiber optic system
Rev. Sci. Instrum. 71, 3196 (2000)
The Mt. Fuji submillimeter-wave telescope Rev. Sci. Instrum. 71, 2895 (2000)
Additional information on Rev. Sci. Instrum.
Journal Homepage: http://rsi.aip.org
Journal Information: http://rsi.aip.org/about/about_the_journal
Top downloads: http://rsi.aip.org/features/most_downloaded
Simple nonlinearity evaluation and modeling of low-noise amplifiers
with application to radio astronomy receivers
F. J. Casas,1J. P. Pascual,2M. L. de la Fuente,2E. Artal,2and J. Portilla3 1
Physics Institute of Cantabria, CSIC-University of Cantabria, Av. Los Castros SN, 39005 Santander, Spain
2
Department of Communications Engineering, University of Cantabria, 39005 Santander, Spain
3
Department of Electricity and Electronics, University of the Basque Country, Apdo. 644, 48080 Bilbao, Spain
共Received 27 April 2010; accepted 16 June 2010; published online 27 July 2010兲
This paper describes a comparative nonlinear analysis of low-noise amplifiers 共LNAs兲 under different stimuli for use in astronomical applications. Wide-band Gaussian-noise input signals, together with the high values of gain required, make that figures of merit, such as the 1 dB compression 共1 dBc兲 point of amplifiers, become crucial in the design process of radiometric receivers in order to guarantee the linearity in their nominal operation. The typical method to obtain the 1 dBc point is by using single-tone excitation signals to get the nonlinear amplitude to amplitude 共AM-AM兲 characteristic but, as will be shown in the paper, in radiometers, the nature of the wide-band Gaussian-noise excitation signals makes the amplifiers present higher nonlinearity than when using single tone excitation signals. Therefore, in order to analyze the suitability of the LNA’s nominal operation, the 1 dBc point has to be obtained, but using realistic excitation signals. In this work, an analytical study of compression effects in amplifiers due to excitation signals composed of several tones is reported. Moreover, LNA nonlinear characteristics, as AM-AM, total distortion, and power to distortion ratio, have been obtained by simulation and measurement with wide-band Gaussian-noise excitation signals. This kind of signal can be considered as a limit case of a multitone signal, when the number of tones is very high. The work is illustrated by means of the extraction of realistic nonlinear characteristics, through simulation and measurement, of a 31 GHz back-end module LNA used in the radiometer of the QUIJOTE 共Q U I JOint TEnerife兲 CMB experiment. © 2010 American Institute of Physics. 关doi:10.1063/1.3463295兴
I. INTRODUCTION
In the design process of radiometric receivers,1linearity is one of the main goals to be achieved.2–5In these receivers there are two main sources of nonlinear behavior: detectors and low-noise amplifiers共LNAs兲. Linearity of astronomical detectors is considered an important issue.6–11In the particu-lar case of LNAs, linearity is used to be defined by taking into account a figure of merit such as the 1 dBc point and setting an appropriate input power back-off level. This point is part of the nonlinear amplitude to amplitude 共AM-AM兲 characteristic, typically estimated by means of single-tone excitation signals. Nevertheless, there are many applications in which the operation of the circuits is driven by wide-band excitation signals. This is the case of radiometric receivers where the excitation signal comes from the sky in the form of a wide-band Gaussian-noise signal to be filtered and am-plified in the band of interest. As will be shown in this work, the different nature of this kind of excitation signal, with respect to the typical one-tone test signal, makes the receiver LNAs present a more nonlinear behavior than it would be expected for the single-tone nonlinear characteristics.12 In fact, similar nonlinear effects have been detected in power amplifiers of communication systems with wide-band-modulated excitation signals.13 So, in order to analyze the
suitability of the LNAs’ nominal operation point, linearity figures of merit, such as the 1 dBc point, have to be obtained, but using realistic excitation signals.
This paper is focused on the extraction of the nonlinear characteristics of a 31 GHz LNA that is part of the radiomet-ric receiver for the QUIJOTE CMB experiment.14 An ana-lytical study of compression effects due to amplifier excita-tion signals composed of several tones is proposed. On the other hand, nonlinear characteristics with wide-band Gaussian-noise excitation signals are obtained by simulation and measurement. This kind of signal can be considered as a limit case of a multitone signal with a very high number of tones. Due to the intermodulation noise, the nonlinear Gaussian-noise characteristic still provides an optimistic 1 dBc point. To take this into account, the total distortion power and power to distortion共P/D兲 共Refs. 15and16兲 have
been obtained by simulation and measurement. These char-acteristics give a very accurate idea of the amplifier linearity as a function of the input power.
The paper is organized as follows. In Sec. II, a simple analytical study of the nonlinear behavior of amplifiers when excited with multitone signals is described. In Sec. III, non-linear characteristics and figures of merit, with multitone and Gaussian-noise excitation signals, are obtained by simulation
of a behavioral model of the particular LNA reported in the work and also by measurement. Finally, conclusions are summarized in Sec. IV.
II. NONLINEARITY ANALYTICAL STUDY OF AMPLIFIERS
This section describes a simple analytical study of the compression effects in amplifiers as a function of the number of tones of the excitation signal. For a more detailed analy-sis, see Ref.17.
Figure1shows the schematic of a generic amplifier with a multitone voltage excitation signal and a load resistance of value R0. For simplicity the input impedance of the amplifier is also R0. On the other hand, the output current of the am-plifier Ioutis a function of the input voltage Vinand is given analytically by
Iout= a1· Vin+ a3·共Vin兲3. 共1兲
We suppose that the coefficients a1and a3are real, so, in order to simplify the calculations, the equation corresponds to a memoryless weakly nonlinear amplifier. By means of simple mathematical developments, it is possible to conclude that for a generic N-tone excitation signal in the form of
Vin=
V
冑
N·兺
i=1 N关cos共i· t兲兴, 共2兲
which has been the input power,
Pin兩 =
V2
2 · R0
, 共3兲
the analytical expression of the nonlinear characteristic turns out to be Pout兩1,. . .,N=共R0 2 · a12兲 · Pin +
冉
冋
6 −冉
3 N冊
册
· R0 3 · a1· a3冊
· Pin2 +冉
冋
9 ·冉
1 − 1 2 · N冊
2册
· R04· a32冊
· Pin3. 共4兲 The nonlinear terms of the previous equation are higher when the number of tones is increased, so we can deduce that the amplifier’s AM-AM characteristic becomes more nonlin-ear. On the other hand, the linear term of the amplifier gain is not altered.Let us define the following coefficients:
C2共N兲 = 6 − 共3/N兲,
共5兲 C3共N兲 = 9 · 兵1 − 关1/共2 · N兲兴其2.
In TableIthe values of C2and C3as a function of the input signal’s number of tones are summarized.
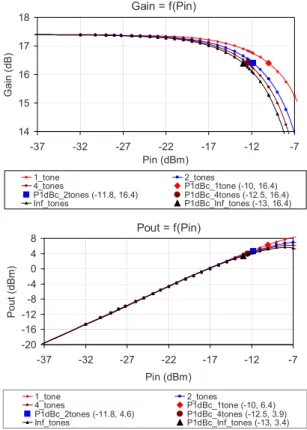
As we have previously mentioned, the paper is focused on one LNA, in particular, the Avago Technologies AMMC-6241, to illustrate the work. The typical one-tone AM-AM characteristic has been measured, obtaining a linear gain of 17.4 dB and a 1 dBc point with⫺10 dBm of input power and 6.4 dBm of output power. The analytical model param-eters fitting the gain and 1 dBc point are R0= 50, a1 = 0.148 262 1, and a3= −2.1535. The nonlinear effects pro-duced by the multitone signals are shown in Fig.2, where the nonlinear characteristics obtained when giving these particu-lar values to R0, a1, and a3can be observed. From this figure, it can be observed that the higher the number of tones of the excitation signal is, the higher the nonlinearity of the ampli-fier appears to be. On the other hand, the 1 dBc tends to a limit point 共Pin= −13 dBm兲 when having a sufficient high
TABLE I. Summary of coefficient values.
N C2 C3 1 3 9/4 2 9/2 81/16 3 5 25/4 4 21/4 441/64 ⬁ 6 9 Pout = f(Pin) -20 -16 -12 -8 -4 0 4 8 -37 -32 -27 -22 -17 -12 -7 Pin (dBm) Pout (d Bm) 1_tone 2_tones 4_tones P1dBc_1tone (-10, 6.4) P1dBc_2tones (-11.8, 4.6) P1dBc_4tones (-12.5, 3.9) Inf_tones P1dBc_Inf_tones (-13, 3.4) Gain = f(Pin) 14 15 16 17 18 -37 -32 -27 -22 -17 -12 -7 Pin (dBm) Ga in (d B ) 1_tone 2_tones 4_tones P1dBc_1tone (-10, 16.4) P1dBc_2tones (-11.8, 16.4) P1dBc_4tones (-12.5, 16.4) Inf_tones P1dBc_Inf_tones (-13, 16.4)
FIG. 2. 共Color online兲 Nonlinear characteristics and 1 dBc points of the analytically modeled amplifier. Diamonds: single-tone excitation. Squares: two-tone excitation. Dots: four-tone excitation. Triangles: infinite-tone exci-tation.
AMPLIFIER R0
R0 VIN IOUT
FIG. 1. Schematic of the amplifier example.
number of tones. This apparent limit in the nonlinear com-pression has to be taken carefully. In the reported simplified development, the different tones are supposed to have phase equal to zero all of them. However, an equivalent “Gaussian-noise signal” has to be composed of several tones with ran-dom phases at different frequencies, covering the bandwidth of interest.
The analytical model of Fig.1has been implemented in the commercial software ADS of Agilent Technologies. In Fig.3the AM-AM characteristics have been achieved simu-lating with such an equivalent Gaussian-noise signal com-posed by 13 tones with random phases and also with the single-tone one. The 1 dBc point has an input power of ⫺15 dBm, which is 2 dB lower that the limit point in Fig.2. The real input signal to a LNA with astronomical applica-tions is a wide-band Gaussian-noise signal that can be con-sidered as a multitone signal composed of an infinite number of tones with random phases, so it would appear to be rea-sonable to expect a similar compression to that in Fig.3.
III. AMMC-6241 SIMULATED AND MEASURED NONLINEAR CHARACTERISTICS
In Sec. II, a simplified analytical model of one of the QUIJOTE radiometer LNAs has been used to predict its non-linear behavior with multitone excitation signals. In this sec-tion a more detailed behavioral model of the LNA is simu-lated to obtain more realistic nonlinear characteristics and also measurement results are shown.
A. AMMC-6241 behavioral modeling
A Wiener type model has been used for the reported LNA.18 This kind of model is suitable for weak or strong nonlinearities with memory. It consists of the series connec-tion of a simplified equivalent electric circuit, reproducing
the small-signal memory of the amplifier, and a memoryless nonlinearity implementing the single tone AM-AM nonlinear characteristic measured up to a high degree of compression. The memoryless block can be implemented by means of spe-cific library elements available in any commercial simulator. The small-signal behavior of the nonlinear block has to ac-complish perfect matching共Sii=0兲 and perfect and bilateral transmission共Sij=1兲, independent of the frequency. By this way, the matching conditions will be determined by the lin-ear filter characterizing the linlin-ear dynamics, affected, in turn, by the nonlinear AM-AM characteristic. The model does not suffer from convergence problems and allows accurate non-linear time-domain simulation, which is essential when the input signal is Gaussian white noise, with continuous spec-tra, as is the case of radiometric receivers. The linear filter is obtained by the application of linear system modeling techniques,19 obtaining an equivalent lumped-element filter with the same frequency response than obtained by measur-ing the关S兴 parameters of the amplifier.
B. Measurement-based model simulation
The previously reported behavioral model is more accu-rate than the analytical one of Sec. II because it fits exactly the measured memoryless nonlinear AM-AM characteristic, and also because it characterizes the linear distortion corre-sponding to the small-signal memory effects. In order to show the differences between both types of models let us introduce the concept of distortion power and P/D ratio for an amplifier. The distortion power is the difference between the output power of a purely linear amplifier and the output power of the corresponding nonlinear amplifier in decibels. On the other hand, the P/D ratio is the ratio between the output power of the nonlinear amplifier and the correspond-ing distortion power in decibels.
Figure 4shows the output power 共triangles兲, the distor-tion power 共squares兲, and the P/D 共diamonds兲 achieved by the simulation of the analytical model 共solid lines兲 and the measurement-based behavioral model 共dashed lines兲 with Gaussian-noise excitation signals, simulated by means of pass-band filtered white-noise signals.12The band of the sig-nals extends from 26 to 36 GHz. In this figure, there can be distinguished three regions. The first region is the smallest -45 -40 -35 -30 -25 -20 -15 -10 -50 -5 -30 -20 -10 0 -40 10 -45 -40 -35 -30 -25 -20 -15 -10 -50 -5 14 15 16 17 13 18 Pin (dBm) Ga in (d B ) Gain = f(Pin) Pin (dBm) Po ut (dB m ) Pout = f(Pin) (-9.7, 16.3) (-15, 16.4) (-9.7, 6.7) (-15, 1.4)
1_tone 13_tones (Random Phases)
FIG. 3. 共Color online兲 Nonlinear characteristics and 1 dBc points of the AMMC-6241 analytical model. Squares: single-tone excitation共31 GHz兲. Dots: 13 tone with random phase excitation signal.
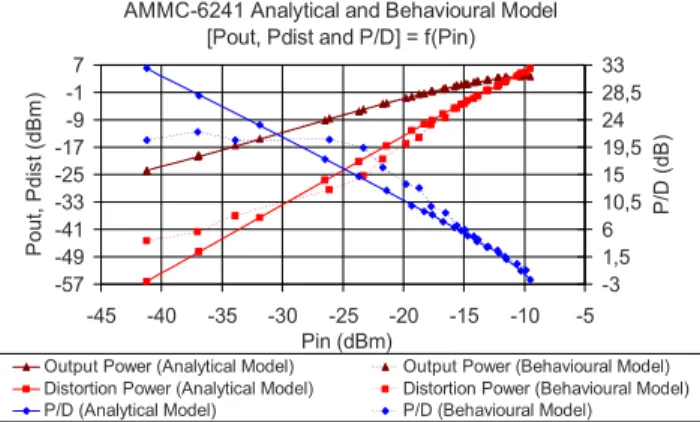
AMMC-6241 Analytical and Behavioural Model [Pout, Pdist and P/D] = f(Pin)
-57 -49 -41 -33 -25 -17 -9 -1 7 -45 -40 -35 -30 -25 -20 -15 -10 -5 Pin (dBm) Po u t, P d is t (d Bm ) -3 1,5 6 10,5 15 19,5 24 28,5 33 P/ D (d B )
Output Power (Analytical Model) Output Power (Behavioural Model) Distortion Power (Analytical Model) Distortion Power (Behavioural Model) P/D (Analytical Model) P/D (Behavioural Model)
FIG. 4.共Color online兲 Output power 共triangles兲, distortion power 共squares兲, and P/D共diamonds兲 achieved by the simulation of the analytical model 共solid lines兲 and the measurement-based behavioral model 共dashed lines兲 with Gaussian-noise excitation signals.
signal region, from⫺42 to ⫺30 dBm of input power, where the analytical model shows lower distortion than the behav-ioral one. This is because the analytical model’s small signal behavior is defined by a real gain with no dependence on frequency, so there is no linear distortion, and the total dis-tortion tends to zero when input power is near zero. Never-theless, the behavioral model characterizes the linear distor-tion, given by the small-signal frequency response of the model, which presents a characteristic proportional to the output power in this smallest-signal region共see graph’s tri-angles and squares兲. In this region it is possible to assume that the amplifier behavior is almost linear. In the second region, from⫺30 to ⫺15 dBm of input power, the behav-ioral model presents lower distortion than the analytical one. This is because the analytical model’s nonlinear behavior is defined only by quadratic and cubic polynomial terms 关see Eq.共3兲兴, while the nonlinear characteristic of the behavioral model fits the measured one with higher-order polynomial terms. These higher-order terms have the effect of smooth nonlinearity and, in consequence, the distortion in the re-ported region of the nonlinear characteristics. Finally, in the third region, from⫺15 to ⫺10 dBm, the distortion generated by both models is very similar, because in this region the cubic polynomial term characterizes quite accurately the nonlinear behavior of the amplifier.
The nonlinear characteristics of the behavioral model, in form of Gain and Pin-Pout, have been also achieved by simulation and compared with the measured ones. The re-sults are compared in Sec. III D.
C. Measurement set-up
The following is devoted to the validation of previous results by measurement of the AMMC-6241 AM-AM and distortion characteristics in the laboratory. The LNA excita-tions have been one and two-tone signals and also filtered Gaussian-noise signals. The reported amplifier is a commer-cial monolithic LNA that is manufactured using a pseudo-morphic high-electron mobility transistor process.
Two different set-ups were employed: the first one using sinusoidal continuous waves as input signals and the second one injecting wide-band noise to the amplifier. A synthesized sweep generator HP83650B was used to provide a single tone stimulus to the amplifier. For the two-tone test an addi-tional synthesized sweep generator was added, combining both signals with a directional coupler in waveguide WR28 with a 3 dB coupling factor. The input signal was monitor-ized on a spectrum analyzer E4446A to fix equal power lev-els in both tones, prior to apply them to the amplifier.
The second set-up was intended to provide a noisy wide-band signal in the operation wide-bandwidth of the amplifier with a power level high enough to allow sweeping the power entering the amplifier using a rotating waveguide attenuator. A R347B noise source with 12 dB of excess noise ratio was used to provide the noisy signal. To reach the required power in the band of interest, two available gain-filtering blocks covering the 26–33 GHz band were cascaded at the source. Power budget calculations were performed to assure that the rotating attenuator placed in-between both blocks prevents nonlinear distortion in the second block. Anyway, both
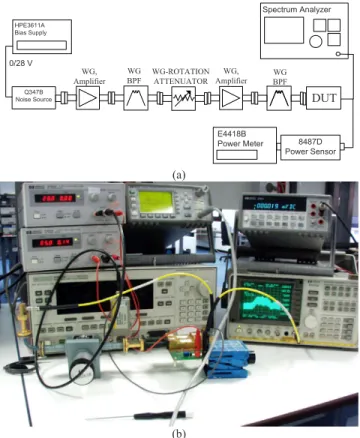
de-vice under test 共DUT兲 input and output signals were mea-sured for each power level, so the DUT nonlinear character-istic is obtained from measurements. An HP-E4418B power meter was used to measure total power without discrimina-tion of frequencies and validate measurements on the spec-trum analyzer, especially with the noisy wide-band signal. Figure5 shows the block diagram共a兲 and a photograph 共b兲 of the measurement set-up to generate a noisy wide-band signal as excitation for the LNA. In Fig.5共b兲it is also pos-sible to appreciate the spectrum of the wide-band noise ex-citation signal.
D. Measurements results
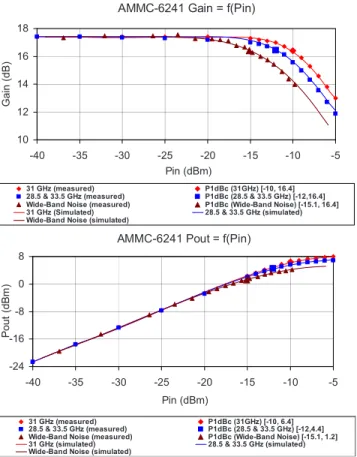
Figure 6 compares the nonlinear characteristics of the LNA measured共triangles, squares, and diamonds兲 and simu-lated 共solid lines兲 using the behavioral model. The results prove the accuracy of the behavioral model. The reported 1 dBc point with Gaussian-noise excitation signals has an input power of ⫺15.1 dBm, which is 5 dB lower than ob-tained with a single-tone signal and corresponds almost ex-actly to the 1 dBc point in Fig.3. Nevertheless, these results do not show clearly the real distortion that is produced when using such excitation signals, so the distortion and power to distortion characteristics have been achieved to clarify this point by means of measurement results. Input and output measured spectra and measured S parameters in linear opera-tion were employed.
Figure 7shows the output power 共triangles兲, the distor-tion power 共squares兲, and the P/D 共diamonds兲 achieved by the measurement共solid lines兲 and the simulation of the
be-0/28 V
Q347B Noise Source
WG,
Amplifier WGBPF WG-ROTATIONATTENUATOR
Spectrum Analyzer HPE3611A Bias Supply WG, Amplifier WGBPF DUT 8487D Power Sensor E4418B Power Meter (a) (b)
FIG. 5. 共Color online兲 Block diagram 共a兲 and photograph 共b兲 of the mea-surement set-up with noisy wide-band excitation signal.
havioral model 共dashed lines兲. Also three reference points have been selected as representatives of the linear operation 共a兲, the nonlinear operation in the 1 dBc point 共b兲, and strongly nonlinear operation共c兲. It can be observed that mea-surement and simulation results are very similar.
Figure 8 shows the measured frequency-spectra of the output power and the distortion power in the reference points in Fig.7. The output spectra have been achieved directly by measurement 关see Fig. 5共b兲兴. Distortion spectra have been achieved indirectly by means of measured linear S
param-eters. We have used as excitation signal the measured input signals, and the distortion spectra have been achieved by subtraction of the linear model’s output spectra, in watts, to the measured one. In共a兲 the output power is ⫺9 dBm and the distortion power is⫺28 dBm. On the other hand, it can be observed how, in the 1 dBc point共b兲, a big part of the output signal 共1.5 dBm兲 is generated by distortion 共⫺3.7 dBm兲, while in the strongly nonlinear operation point the distortion power 共5 dBm兲 is even higher that the output power 共4.2 dBm兲 due to the high compression degree achieved in this point.
Taking into account the reported results, a good design rule to ensure the linearity in the operation of a LNA for astronomical applications is to set the required input back-off, with respect to the single-tone 1 dBc point, to assure that the LNA is operating at power levels where the only distor-tion generated by the amplifier is the amplitude and phase-distortion caused by the linear memory effects, but any
non-AMMC-6241 Gain = f(Pin)
10 12 14 16 18 -40 -35 -30 -25 -20 -15 -10 -5 Pin (dBm) Gain (d B) 31 GHz (measured) P1dBc (31GHz) [-10, 16.4] 28.5 & 33.5 GHz (measured) P1dBc (28.5 & 33.5 GHz) [-12,16.4] Wide-Band Noise (measured) P1dBc (Wide-Band Noise) [-15.1, 16.4] 31 GHz (Simulated) 28.5 & 33.5 GHz (simulated) Wide-Band Noise (simulated)
AMMC-6241 Pout = f(Pin)
-24 -16 -8 0 8 -40 -35 -30 -25 -20 -15 -10 -5 Pin (dBm) Pout (dBm ) 31 GHz (measured) P1dBc (31GHz) [-10, 6.4] 28.5 & 33.5 GHz (measured) P1dBc (28.5 & 33.5 GHz) [-12,4.4] Wide-Band Noise (measured) P1dBc (Wide-Band Noise) [-15.1, 1.2] 31 GHz (simulated) 28.5 & 33.5 GHz (simulated) Wide-Band Noise (simulated)
FIG. 6.共Color online兲 Measured nonlinear characteristics and 1 dBc points
of the AMMC-6241 LNA. Diamonds: single-tone excitation 共31 GHz兲.
Squares: two-tone excitation共28.5 and 33.5 GHz兲. Triangles: filtered Gauss-ian noise.
AMMC-6241 Behavioural Model and Measurements [Pout, Pdist and P/D] = f(Pin)
-57 -49 -41 -33 -25 -17 -9 -1 7 -45 -40 -35 -30 -25 -20 -15 -10 -5 Pin (dBm) P o ut , P di st (d B m ) -3 1,5 6 10,5 15 19,5 24 28,5 33 P/ D (d B )
Output Power (Measured) Output Power (Behavioural Model) Distortion Power (Measured) Distortion Power (Behavioural Model) P/D (Measured) P/D (Behavioural Model)
Ref. Point (a) Ref. Point (b) (c)
FIG. 7.共Color online兲 Output power 共triangles兲, distortion power 共squares兲, and P/D共diamonds兲 achieved by the measurement 共solid lines兲 and the simulation of the behavioral model共dashed lines兲 with Gaussian-noise ex-citation signals. 22 24 26 28 30 32 34 36 38 40 42 20 44 -70 -50 -30 -90 -10 freq, GHz 22 24 26 28 30 32 34 36 38 40 42 20 44 -70 -50 -30 -90 -10 freq, GHz 22 24 26 28 30 32 34 36 38 40 42 20 44 -70 -50 -30 -90 -10 freq GHz (c ) (b ) (a ) Ou tput & D is tor tio n Sp e ct ru m, d B m /RB W O u tp u t & D is to rt ion S pec tr um , d B m /R B W Ou tp ut & D is tor tio n S p e ct rum , d Bm /R BW RBW = 1MHz RBW = 1MHz RBW = 1MHz
FIG. 8. 共Color online兲 Measured output and distortion spectra with a reso-lution bandwidth, RBW= 1 MHz, in the reported reference points.共a兲 Lin-ear operation.共b兲 1 dBc point operation. 共c兲 Strongly nonlinear operation.
linear distortion is produced. These power levels can be identified in Fig.7by the region where the distortion power is linearly proportional to the output power共P/D is almost constant兲. This region has a maximum input power of ap-proximately ⫺25 dBm, so in the reported case, at least a 15 dB input back-off with respect to the single-tone 1 dBc point has to be set. For the AMMC-6241, the expected input power to the QUIJOTE experiment BEM is around ⫺53 dBm, so the linearity is clearly established.
IV. CONCLUSION
This paper shows the effects of wide-band Gaussian-noise excitation signals on the nonlinear behavior of LNAs employed in radiometers and instruments with astronomical applications. The use of multitone excitation signals, as a first approximation to a wide-band signal, and also filtered Gaussian noise has shown that the typical single-tone 1 dBc point is not appropriate as a linearity indicator in the instru-ment designing process.
The work has been focused on a particular LNA used in the BEM for the 31 GHz receiver of the QUIJOTE experi-ment radiometer. Taking into account a Gaussian-noise exci-tation signal in the working band of this receiver, from 26 to 36 GHz, the resulting 1 dBc point has an input power around 5 dB lower than the one corresponding to the single-tone 1 dBc point. In fact, the reported Gaussian-noise 1 dBc point is also optimistic due to the distortion that is added to the output power. Taking into account total distortion power and P/D ratio evaluation, it has been shown how a good design rule to apply in these cases consists of establishing the re-quired input back-off, with respect to the single-tone 1 dBc point, to assure that the LNA is operating at power levels, where the only distortion generated by the amplifier is the linear memory distortion, so P/D has no dependence on input power. In our particular case, this rule makes us set at least a 15 dB input back-off with respect to the single-tone 1 dBc point.
It is also important to note the general applicability of the reported nonlinear study to all kinds of amplifiers and not only to LNAs. In the design processes of current com-munication transmitters and receivers, these effects also have to be taken into account, as they work with wide-band modu-lated signals.
In order to obtain a good idea about the linearity of an overall radio astronomy receiver, the following research line concerns the effects of the reported excitation signals in the nonlinearity of radiometric detectors.
ACKNOWLEDGMENTS
F.J.C. would like to acknowledge the financial support of the Spanish Science and Innovation Ministry 共Project No. AYA2007-68058-C03-02兲 and program “Personal Técnico de Apoyo.” J.P.P. acknowledges the financial support of the Spanish Science and Innovation Ministry 共Project Nos. AYA2007-68058-C03-03 and TEC2008-06874-C03-01兲 and CONSOLIDER-INGENIO 2010 共Project No. CSD2008-00068兲. J.P. would like to acknowledge the financial support of the Spanish Science and Education Ministry共Project No. TEC2006-11077-C02-01兲.
The authors would like to express their gratitude to Dr. Reyes Ruiz for her help with mathematical expressions.
1M. E. Tiuri,IEEE Trans. Antennas Propag.AP-11, 930共1964兲. 2N. Skou, Proceedings of IGARSS, 2002, Vol. 6.
3M. Trier, IEEE IMTC Conference Record, 1993.
4F. Torres, I. Corbella, A. Camps, N. Duffo, M. Vall-llossera, S. Beraza, C.
Gutierrez, and M. Martin-Neira,IEEE Trans. Geosci. Remote Sens.44,
2679共2006兲.
5A. Colliander, L. Ruokokoski, J. Suomela, K. Veijola, J. Kettunen, V.
Kangas, A. Aalto, M. Levander, H. Greus, M. T. Hallikainen, and J. Lahtinen, IEEE Trans. Geosci. Remote Sens. 45, 7共2007兲.
6V. S. Reinhardt, Y. Chi Shih, P. A. Toth, S. C. Reynolds, and A. L.
Berman,IEEE Trans. Microwave Theory Tech.43, 715共1995兲. 7T. Närhi,Electron. Lett.32, 224共1996兲.
8C. A. Hoer, K. C. Roe, and C. M. Allred, IEEE Trans. Instrum. Meas. IM-25, 324共1976兲.
9F. Torres, N. Duffo, I. Corbella, A. Camps, M. Vall-llossera, and L.
Sagués,Electon. Lett.39, 1852共2003兲.
10F. Torres, N. Duffo, C. Gonzalez-Haro, R. Vilaseca, L. Sagues, and M.
Martin-Neira, IEEE IGARSS 2008, 2008, Vol. 2.
11J. R. Piepmeier, P. N. Mohammed, and J. J. Knuble, IEEE Trans. Geosci.
Remote Sens. 46, 2共2008兲.
12F. J. Casas, J. P. Pascual, J. Portilla, M. L. de la Fuente, B. Aja, and E.
Artal, Eighth WSEAS International Conference on SSIP’08, 2008, pp. 107–111.
13G. N. Nkondem, J. Santiago, G. Neveux, D. Barataud, J. Collantes, J.
Portilla, J. Nebus, and A. Mallet, IEEE MTT-S International Microwave Symposium Digest, 2008, pp. 1581–1584.
14J. A. Rubiño-Martín, R. Rebolo, M. Tucci, R. Génova-Santos, S. R.
Hilde-brandt, R. Hoyland, J. M. Herreros, F. Gómez-Reñasco, C. López Cara-ballo, E. Martínez-González, P. Vielva, D. Herranz, F. J. Casas, E. Artal, B. Aja, L. de la Fuente, J. L. Cano, E. Villa, A. Mediavilla, J. P. Pascual, L. Piccirillo, B. Maffei, G. Pisano, R. A. Watson, R. Davis, R. Davies, R. Battye, R. Saunders, K. Grainge, P. Scott, M. Hobson, A. Lasenby, G. Murga, C. Gómez, A. Gómez, J. Ariño, R. Sanquirce, J. Pan, A. Viz-cargüenaga, and B. Etxeita, e-print arXiv:0810.3141v1.
15K. M. Gharaibeh, K. G. Gard, and M. B. Steer, IEEE Radio Wireless
Symposium, 2006, pp. 487–490.
16J. C. Pedro and N. B. de Carvalho,IEEE Trans. Microwave Theory Tech. 47, 2393共1999兲.
17R. J. Westcott, Proc. IEE 114, 726共1967兲.
18K. M. C. Jeruchim, P. Balaban, and K. S. Shanmugan, Simulation of
Communication Systems共Kluwer Academic/Plenum, New York, 2000兲.
19F. J. Casas, J. Portilla, R. Quere, A. Mallet, and J. F. Villemazet,IEEE Trans. Microwave Theory Tech.52, 2262共2004兲.