TRABAJO
FIN DE MAS
TE
R
Y Puertos.
UNIVERSIDAD DE CANTABRIA
On-Site Design and the Implementation
of Laser Scanners and Virtual Reality.
Diseños de Campo Implementando
Escáneres Láser y Realidad Virtual
Author:
Carlos René Vides Caballero
Supervisor:
Prof. João Pedro da Silva Poças Martins, PhD
Co-supervisor:
Fábio Matoseiro Dinis
Universitary Degree:
Master in Construction Research,
Technology and Management in
Europe – Máster en Investigación,
Tecnología y Gestión de la
Construcción en Europa
i
Abstract
The main purpose of this dissertation was to integrate typical project design practices with growing technologies to increase project data accuracy, crew safety, and overall engineering value while reducing time and cost in a streamlined process. Information loss and missing data from the field can result in inefficient designs and potential conflicts during the construction phase. These conflicts often result in costly and preventable change orders, budget inflation and sometimes litigation. Through the implementation of laser scans the accuracy and comprehensiveness of the data can be guaranteed; and through the implementation of virtual reality a natural user interface can be provided to designers without means of visiting the field to experience the existing conditions. This study provides proof of concept for the integration of these new technological tools to the design process. And while laser scanning can be directly implemented and streamlined immediately, virtual really application gaps still need to be addressed before it can be fully implemented in the near future.
ii
Acknowledgements
I would like to extend my most sincere gratitude to all those involved in this dissertation in all capacities.
Firstly, I would like to thank Professor João Pedro da Silva Poças Martins for providing me his guidance, encouragement and the formula for a successful completion of the work.
Secondly, I would also like to express my gratitude to Fábio Matoseiro Dinis for all the instruction on virtual reality scene generation, coding and for all the time and support he provided throughout the development of the models.
Thirdly, I would like to express my appreciation to Luís Sanhudo for teaching me how to use the laser scanner and helping me with the initial point cloud manipulation. I would also like to thank my former colleague from Texas, John Tyler, P.E., for providing the international data to help this project take place, and for his guidance over the years.
Finally, I would like to thank my family for supporting me unconditionally in this challenge as they do with every challenge that comes along.
iii
Table of Contents
Abstract ... i
Acknowledgements... ii
Chapter 1 – Introduction ... 1
Chapter 2 – Literature Review ... 3
2.1 On-Site Design ... 3
2.2 Laser Scanning ... 4
2.3 Building Information Modeling (BIM) ... 6
2.4 Virtual Reality ... 7
2.5 Point Cloud Manipulation ... 8
Chapter 3 – Main Objectives ... 10
Chapter 4. – Resources Used ... 12
4.1 Stationary Laser Scanner ... 12
4.2 Virtual Reality Viewer ... 12
4.3 Point Cloud Inquiry Software ... 12
4.4 Drafting and BIM ... 13
4.5 Virtual Reality ... 13
4.6 Data manipulation and interaction between Laser Scanners, Virtual Reality and BIM ... 14
Chapter 5. – Theoretical Process ... 16
Chapter 6. – Process Implementation... 21
6.1 Laser Scanning ... 21
6.2 Virtual Reality ... 23
Chapter 7. – Case studies ... 29
7.1 Porto Locations ... 29 7.1.1 Porto Location 1 ... 29 7.1.2 Porto Location 2 ... 35 7.1.3 Analysis ... 40 7.2 Texas Locations ... 41 7.2.1 Texas Location 1 ... 42 7.2.2 Texas Location 2 ... 45 7.2.3 Texas Location 3 ... 47 7.3.4 Analysis ... 49 Chapter 8. – Conclusions ... 51 References ... 53
iv
List of Figures
Figure 1 - Technology Integration Benefits ... 2
Figure 2 - Scan Range (Leica Geosystems AG, 2014) ... 5
Figure 3 - Laser Scanner (Leica Geosystems AG, 2014) ... 12
Figure 4 - Revit test model ... 13
Figure 5 - Unity basic scene ... 14
Figure 6 - Unity scene after applying material properties ... 14
Figure 7 - Original process ... 17
Figure 8 - General process proposed ... 17
Figure 9 - Proposed process 1 ... 18
Figure 10 - Proposed process 2 ... 18
Figure 11 - Proposed process 3 ... 19
Figure 12 - Porto location 1 high resolution scan ... 21
Figure 13 -Porto location 1 medium resolution ... 21
Figure 14 - Porto location 1 low resolution scan ... 22
Figure 15 - Porto location 1 - high resolution scan - driveway view ... 22
Figure 16 - Porto location 1 - medium resolution scan - driveway view ... 23
Figure 17 - Texas scan location 1 - point cloud data conversion to vector file ... 23
Figure 18- Texas location 1 - Unity FBX import ... 24
Figure 19 - Prospect OBJ import - overall model views ... 24
Figure 20 - Prospect scene - shadow and sunlight control ... 25
Figure 21 - Prospect scene - callout interface ... 25
Figure 22 - Prospect scene - screen capture interface ... 26
Figure 23 - Prospect scene - Texas location 1 - Strip-mall view ... 26
Figure 24 – Unity scene - initial import ... 27
Figure 25 - Unity scene - after rotation and material properties ... 27
Figure 26 - Unity scene - error in mesh example ... 28
Figure 27 - Unity scene - Texas location 1 – Strip-mall view... 28
Figure 28 - Porto scan locations ... 29
Figure 29 - Porto location 1 - northeast corner ... 30
Figure 30 - Porto location 1 - driveway & sidewalk ... 30
Figure 31 - Porto location 1 - field sketch & proposed crossing design diagram ... 31
Figure 32 - Porto Location 1 - existing conditions diagram (not to scale) ... 31
Figure 33 - Porto Location 1 - existing conditions diagram & ReCap export comparison ... 32
Figure 34 - Porto Location 1 - existing conditions diagram & 3D Reshaper export comparison ... 32
Figure 35 - Porto Location 1 -revised existing conditions diagram (not to scale) ... 33
Figure 36 - Porto Location 1 - Prospect virtual reality scene ... 33
Figure 37 - Porto Location 1 - ReCap measurements ... 34
Figure 38 - Porto Location 1 - ReCap measurements - plan view ... 34
Figure 39 - Porto Location 1 - proposed improvements exhibit (not to scale) ... 35
Figure 40 - Porto Location 2 - courtyard looking east ... 35
Figure 41 - Porto Location 2 - field sketch ... 36
Figure 42 - Porto Location 2 - sketch based existing conditions diagram... 36
v
Figure 44 - Porto Location 2 - courtyard & parking view ... 38
Figure 45 - Porto Location 2 - full courtyard view ... 38
Figure 46 - Porto Location 2 - point cloud measurements - plan view ... 39
Figure 47 - Porto Location 2 - point cloud measurements using 360-degree photograph ... 39
Figure 48 - Porto Location 2 - point cloud based existing conditions diagram ... 40
Figure 49 - Texas scan locations ... 42
Figure 50 - Texas location 1 - Pospect generated virtual reality scene - bus stop view ... 43
Figure 51 - Texas location 1 - Unity generated virtual reality scene - bus stop view ... 43
Figure 52 - Texas location 1 - nothbound facing photograph ... 44
Figure 53 - Texas location 1 - 3D Reshaper measurements ... 44
Figure 54 - Texas location 1 - ReCap measurements ... 45
Figure 55 - Texas location 2 - Unity scene - drainage structure ... 45
Figure 56 - Texas location 2 - northbound facing photograph ... 46
Figure 57 - Texas location 2 - 3D Reshaper measurements ... 46
Figure 58 - Texas location 2 - ReCap measurements ... 47
Figure 59 - Texas location 3 - Unity scene - driveway view ... 47
Figure 60 - Texas location 3 - southbound facing photograph ... 48
Figure 61 - Texas location 3 - 3D Reshaper measurements ... 48
Figure 62 - Texas location 3 - ReCap Measurements ... 49
List of Tables
Table 1 - Process comparison table ... 41Table 2 - Software comparison table ... 49
Appendices
APPENDIX A – Virtual Reality Scenes APPENDIX B – TxDOT Standards
1
On-Site Design and the Implementation of Laser Scanners
and Virtual Reality
Chapter 1 – Introduction
A significant amount of existing infrastructure requires maintenance, upgrades, and retrofits. This is particularly true of public facilities such as sidewalks, intersections, parks, and bridges. Some of these works, especially those that do not require excavation, can be easily redesigned without formal survey, as long as the potential conflict points and obstacles are clearly identified. These redesigns can be quickly carried out in the field, with a simple and efficient approach known as "on-site design.” The advantages of on-site design include the ease of visualization through the experience of actually being in the field, the identification of available space, no information loss between surveying and design, shorter design times, designs are customized to each location, the identification of potential conflict points due to existing obstacles, and the ability to replicate the process in a streamlined fashion. However, this method may rely on non-accurate measurement techniques and on appropriate transfer of information from the field to the office to translate the field notes and designs to digital media. Another disadvantage of on-field design is the travel requirements and time losses by essential personnel. This study shall use the Texas Department of Transportation’s (TxDOT) statewide curb ramp program as the basis for the original on-site design method. Virtual reality scenes created from laser scans of the field conditions of any given site can complement and improve on-field design greatly, and further reduce the overall cost of design and plan production.
Communication is a key aspect of any design and construction project, from the initial concepts of a project to the final stages of construction. Handling information and maintaining relevant information up to date is of utmost importance to any project; missing information and even delay of critical information can result in budget and scheduling blunders that can cost a client inordinate amounts of money. One of the largest issues currently faced in the construction industry is the inappropriate transfer of information from the field to the office, such as poorly processed surveys, missing utility data from the field report, misinterpretation of the field data, and others. Inappropriate transfer of information could lead to redesign of the entire construction works, major schedule delays, litigation, and a damaged relationship with the client. When small projects are faced with this type of situations, the budgets cannot handle the stress and abandonment of the project is a very real possibility. Having a reliable source of data that encompasses the project site and can be revisited as necessary shall provide a great advantage to any construction project. Moreover, it can give designers the ability to experience the field without leaving their design space, effectively minimizing the potential for information and time loss.
Safety for the field crew can be a concern in many situations especially when they are not familiar with the surroundings, safety concerns may include nearby powerlines, traffic, heavy machinery, falling hazards and many more. As the case studies in this dissertation will mostly focus on small design projects on sidewalks and intersection crossings, the chief safety concern will be traffic conditions, when the facilities are located near heavily traveled roadways, it may be necessary to forgo or rush some of the measurements and photographs required at important vantage points. Likewise, some structures on the side of the road may not be safely reachable without special
2
equipment or without spending large amounts of time to safely measure, sketch, and inventory them. Rushed or incomplete fieldwork typically results in loss of information at some capacity, however crew safety shall always take precedence in these situations. The use of laser scanners will greatly benefit the safety aspect of roadside design, as the equipment can be safely placed well outside the travel lanes while the quality and accuracy of the scan remains higher than that of the sketches and measurements of a field crew. Field use of a laser scanner is such a simple task that the field crew may be reduced to one person, leaving the possibility of maintaining other essential personnel in the office.
Finally, even though maintenance is a recognized long-term problem several non-technical reasons delay these works; budget cuts, scheduling conflicts, and politics, for example, downgrade maintenance tasks to the bottom of many priority lists. In many cases, upkeep and repair budgets are earmarked towards structures which have already failed, can no longer satisfy their purpose, manifest evident signs of deterioration or are close to ultimate failure. Infrastructure is growing at such rates that maintenance budgets seem to progressively dilute with time. An appealing solution to keep costs down is to eliminate the conflict potential by applying a low-tech process of designing on the field. A method of information transfer from the field to the office can be developed to minimize costs and conflict potentials for certain maintenance, retrofit, and small construction works. A combination of a low-tech approach with innovative technology can streamline design, plan production, bid quantity estimates, and conflict identification and resolution. Figure 1 illustrates the potential benefits expected from the integration of technologies outlined in this approach. Current literature confirms that these technologies have the potential to work together and fulfill the eager goals of this study. This project will further explore possibility of combining different state of the art technologies.
3
Chapter 2 – Literature Review
This study will focus on the integration of laser scans, building information modeling (BIM), virtual reality, and automated mesh generation to the on-site design process. The integration of new technologies to this approach are expected to yield more robust designs and expand the application of the method towards more complex design endeavors. The following is a literary review of all methods, technologies and techniques expected to be applied and combined in this dissertation.
2.1 On-Site Design
On-site design can be understood as “the incorporation of construction expertise in the design process” (Menches, 2006). As such, it may be implemented in the early project stages as the basis of strategic design decisions or it can also be used as a low-tech/low-budget measure in response to crisis situations (Fredrickson, 1998). Through this method it is possible to incorporate construction and design expertise in the same process. Producing design drawings and specification with a specific site in mind while taking construction knowledge and expertise into consideration, can positively impact efficiency in construction operation. On-site design can be complimented with tools like CAD, databases, digital photographs, GPS points, and geographic information systems (GIS). Hypothetical on-site design layout problems can be addressed through iterative design processes in the office or the field(Cheng, 1996). In their research, Grau et al. identify project performance measures and design activities that assess the impact of on-site design on project performance; a total of 29 performance measures are defined by the authors in the following project areas: cost, quality, schedule, and safety and their study indicates that projects that apply on-site design surpass the project performance measures of those which do not(Grau, 2012).
On-site design can affect and be affected by several factors for instance project characteristics, the activities to be carried out using the on-site design method, and the project performance expected. Project characteristics refer to the nature of the project such as location (international, domestic, etc.), ownership (private owner, public, etc.), source of the funds for the project (charitable foundations, banks, grants, etc.), type (building, roadway, bridges, etc.), execution strategy (design-build, design-bid-(design-build, etc.), scale, fee, type of terrain, incentives, and the role played by each stakeholder (George, 2008). Many activities can be encompassed by the on-site design method in each of the project phases: concept development, preliminary design, detailed design, agency approval, bidding phase, procurement, construction, and project delivery; in most of these phases, on-site design practices may prove valuable in terms of time and cost savings (Wang, 2010). Project performance can only be assessed in a retrospective manner at each project milestone or at its culmination, benchmarks like the final project cost, quality, schedule, and safety performance evaluation may amount to the project team’s response to unpredictable on-site situations, where effectiveness and timeliness are of the essence (Chan, 2001). Surveys show that projects which incorporate on-site design practices are significantly better performing in the quality and safety areas, some improvements in critical schedule compliance, and cost categories can also be observed in said projects; these surveys cite on-site design practices as a direct cause for timely issuing of design documents, effective handling of change orders, value engineering savings, and productivity or value earned during project execution (Grau, 2012).
Typically, on-site design is not an accurate method and it requires field sketches and unreliable measurement methods. However, on-site design tools are being developed to streamline the
4
translation of field data to the office. One such mobile design tool is the "Tablet MR" which compounds a video image displaying the present condition of a site, and a 3-Dimensional Computer Graphics image displaying the proposed design, this system adapts MR (Mixed Reality) technology where a three-dimensional motion sensor and a live camera are unified with a VR (Virtual Reality) image and compounded on live video stream (Fukuda, 2006). This technology is specifically developed to visualize designs on the field in real time, thus taking on-site design sketches to unprecedented technological heights. This technology provides the ability to upload existing and design data to the office from the field, allowing office staff to begin work on final plans without any delay.
The on-site design method may be used for small and repetitive tasks that comprise a project. For example, sidewalk reconstruction and curb ramp implementation. Recently, agencies have started paying more attention to accessibility for those with disabilities, this includes wheelchair accessible and traversable sidewalks and the implementation of truncated domes at street crossings. New sidewalks and intersections are required to provide appropriate facilities for all users, and older infrastructure may not feature these amenities. As agencies strive to improve the entirety of their network for all users, budgets are considered one of the biggest issues for growth and savings in the design phase can help mitigate some of these concerns. Another issue is the potential for conflicts during the construction phase which sometimes lead to change orders, delays, and litigation. This can be minimized by visiting the corridor and noting every potential conflict and possible solution, doing the measurements in place, and determining which design best fits each unique conflict. This approach may then be complemented with sketches, pictures, CAD files, and database entries, which then shall be processed in the office to produce formal design plans and construction quantities. While the advantages of the on-site design method are clear, there are several disadvantages that must be considered before applying it to design. Without formal survey, the design is based on inaccurate measurements, which typically lead to overdesign and over estimation of necessary quantities. Another drawback, is that depending on the location of the facility, travel expenses and delays may increase costs and affect schedules. Additionally, safety concerns must be noted when working on the field, especially when working on facilities located near heavily traveled roadways. Human error may also give way to poor designs difficult to rectify without another field visit, or the office staff may misinterpret the information provided by the field designer. These key drawbacks may be alleviated through the use of laser scanners and virtual reality scenes.
2.2 Laser Scanning
The laser scanner mechanism uses the same principle as sonar, albeit using light waves as opposed to sound waves to carry out its measurements. The light source from the scanner emits laser pulses continuously and their direction is dictated by the rotating body and by the spinning miller, both the horizontal and vertical direction respectively (see Figure 2), the scanner then measures the travel time it takes each beam to return to the origin after it has been reflected form a surface and records the directions and travel times in order to convert them into three-dimensional coordinates once the scan is complete (Chida, 2016). As the points are regularly ordered by the scanner the directions of the laser pulses can be represented by using azimuth and zenith angles, constant sampling interval points are regularly ordered in the angle space in a two-dimensional lattice manner (PTX format for example), also known as a two-dimensional map (Masuda, 2015).
5
FIGURE 2-SCAN RANGE (LEICA GEOSYSTEMS AG,2014)
Laser scanning can be used to determine field conditions of buildings and other structures and create working BIM models. Zeibak -Shini, et al. were able to create a working BIM model form a laser scan of earthquake damaged buildings, using this technique they compared the “as-built” models to the new “as-damaged” models and identified the damaged areas that needed assessment and eventual redesign or reinforcement(2016). Therefore, we can infer that models generated from laser scans provide accurate depictions of the real-time field conditions which shall enhance engineering design capabilities. Laser scan generated BIM models may also be used as “as-built” models by comparing the planned model to the scan generated model, existing research presents a “unified approach for more robust automated comparison of as-built and as-planned cylindrical MEP works”(Bosché, 2015). This method enables recognition of objects that are not built at their “as-planned” locations and provides a clear picture of where the facilities are located including potential future conflict points. When redesigning production systems, laser scanners can help engineers complete the layout planning task, as old 2D plans can’t always be trusted and system changes sometimes go undocumented, using a point cloud to model the real-time on-site layout can mitigate costly and inefficient designs(Lindskog, 2016).
Processing point clouds generated by laser scanners is a tedious and time-consuming process when done manually. Wang & Yong, introduce an automatic and simplified method to create BIM models from point clouds using an automated building envelope recognition algorithm developed to recognize all the components from the laser scan, where each surface is given a unique ID, surface type and geometry(2015). This shows that automated creation of BIM models from laser scans can save significant amounts of time and make the use of laser scan viable for producing BIM models and VR scenes. The ability to reduce the vast amount of data from a point cloud to a workable BIM model is crucial for the application of virtual reality in on-site design. Bosché & Guenet developed an automated method to flatten point clouds and create workable BIM models without the need of copious amounts of time to process the point cloud data(2014). Reducing redundant data in point clouds is particularly important if one is trying to integrate two or more point clouds to create a final product. For example, after progressively scanning the same site in various stages of construction the point clouds can be combined into one file in which the information is combined to produce the best geometric information, while maintaining the file sizes relatively small(Gaoa, 2015). This
6
method may also be used to integrate various point clouds into one virtual reality scene for larger intersections or entire pedestrian corridors and roadways.
2.3 Building Information Modeling (BIM)
Much like computer-aided design (CAD) changed the design, consulting, and construction industries in the past, building information modeling (BIM) has been developing and revolutionizing the engineering field since the early 2000s. BIM offers the opportunity to reinvent current practices associated with construction design and document deliveries and it may be understood an object-oriented computer-aided design, which represents each building element in terms of their geometric shape, their non-geometric attributes (such as a database of material and function), and the relationships between each building element (Eastman, 2011). BIM is therefore a set of technologies with the purpose of enhancing inter-organizational collaboration between various parties in the industry, it improves productivity, minimizes conflicts, and maximizes information sharing between sub-contractors whilst improving design, construction, and maintenance practices (Miettinen, 2014). As such, the BIM concept is a means to improve efficiency and reduce costs during all stages of construction and beyond, while providing a versatile management aid (Succar, 2009).
Along with technical benefits, BIM also offers many other advantages such as: knowledge management, standardization, integration, economic, planning/scheduling, building LCA, risk management, and decision support benefits. Despite all these benefits and major technological advancements in BIM, the industry has not fully adopted BIM, the lack of widespread uptake of BIM can be attributed to several factors including technical risks, management risks, financial risks, and legal risks, namely copyright infringement concerns and cyber security concerns (Chien, 2014). Some users may not possess the server capacity to handle and share large BIM files in real time and the low value to difficulty ratio of BIM in some practices and staff training requirements can also be an issue for smaller companies (Steel, 2012). In spite of these setbacks, the technology continues to advance and while in the foreseeable short-term future most companies will remain “BIM-aware” and “BIM-competent” the industry is moving in the direction of BIM as a collaborative process (Ghaffarianhoseini, 2017).
Large scale construction projects can become extremely complex and require a collaborative environment to successfully integrate various disciplines from the planning stage to the construction stage of the project. Conventional team collaboration may raise certain issues such as poor communication, lack of trust, cultural differences, and uncertainties regarding ownership of intellectual properties (Arayici, 2012). Further issues may include incomplete sets of plans, outdated information, and other inconsistencies that lead to conflicts, and change orders, during the construction stage. These inconsistencies may increase a project’s risk of failing to meet schedules and budgets in final design stages and during construction. Applying a BIM governance framework shall increase the possibility for a successful collaboration with minimal setbacks, for BIM governance frameworks present and summarize factors yielding successful and collaborative BIM approaches (Rezgui, 2013). The framework presented by Alreshidi et al. comprises three key components: “actors and team, data management and information communication technology (ICT), and processes and contracts,” thus revealing the high potential of information sharing technologies in BIM applications, specifically enhancing performance, accessibility, storage, information relevance and timeliness, and scalability(2017).
7
BIM is currently present in architecture, engineering, and construction, it has enjoyed acceptance and diffusion in the industry and is experiencing an expansion of its original intent. While it was originally intended for buildings, BIM is transitioning into the infrastructure domain and it now also encompasses transportation infrastructure (roads, railways, bridges, mass transit hubs), energy infrastructure (power plants, wind turbines, hydroelectric dams, oil & gas storage/distribution), utility infrastructure (electric network, pipelines, water & sewage), recreational infrastructure (parks, amphitheaters, stadiums), and environmental infrastructure (levees, weirs, embankments, water treatment plants) (Cheng, 2016). Buildings are element driven and clash detection is of utmost importance, yet in a highway project clash detection may not justify the time spent modelling the entire project which creates some challenges from the contractor’s perspective especially because providing advanced visualizations may not add much value to the project; the advantages added to highway projects, however, may come from the co-ordination and integration of non-graphic data the model, generating accurate and data rich Project Information Models(Bradley, 2016). Other benefits of including BIM to roadway infrastructure may come in the form of visualization of construction zones and temporary pavement areas throughout the different stages of construction, which would give designers the ability to produce models for traffic control at each stage of the scheduled work.
2.4 Virtual Reality
As virtual reality is a developing technology, its use in the engineering and construction industry is not yet clearly defined, and it hasn’t caught up to the available technological capabilities. In most cases, virtual reality engines are mostly applied as marketing tools in construction projects or as didactic materials in universities advancing the field. Sampaio & Martins, for example, developed VR models that represent bridge construction activities, making it possible to teach students about bridge design, and the various construction phases involved in bridge construction, these models provide an interactive platform where complex ideas (such as construction phasing) can be visualized while providing an understanding of the magnitude of the works, helping students see the precise geometry that the teacher intends to convey(2014). Architectural students also benefit from virtual reality building models. The models can allow students to get more familiar with structural elements and other areas of building design and they also allow the students to visualize abstract representations of components and how they are built to ensure structural stability and aesthetics (Abdelhameed, 2013). Therefore, it follows that an immediate application of virtual reality use in the engineering industry setting may be its use for training purposes, particularly for on-field design capacities. This didactic tool allows managers to train engineers within a predetermined environment without the safety concerns that exist in the field.
There are several virtual reality applications in the design and construction industry to date. Ren et al., for example, make use of virtual reality tools to construct models of the irregular and complicated structures of the Olympic Stadium in Beijin, China, in order to observe and determine how the structure will behave and since this work was a collaboration between various contractors, it was of utmost importance that each contractor could visualize the structure and understand the expectations(2004). A more recent application of virtual tools is its implementation as a supervisory control system aid for tunnel drilling operations, where the proof of concept involved adapting virtual reality tools to real world equipment and testing them on a mockup tunnel boring machine
8
section, the results proved that a real-world test is warranted, and shall follow(David, 2014). Managing advanced teleoperation and supervisory control via virtual reality in real time is a leap forward in drilling technology and in the safety conditions for operators. It follows that the capability of designing, from stationary virtual reality models shall be simpler to implement as a viable option for engineers in the field.
Translating the field experience to the office staff is of utmost importance in any project, failure in the transfer of information may lead to vast deficiencies in designs. Virtual reality scenes are a great way to mitigate issues that arise from not being able to visualize the field conditions or the proposed designs. Motamedi, et al. show how virtual reality models can be used to visualize a signage layout in public spaces that provides efficient provision of information to pedestrians; crowded subway stations in japan were visualized through the use of BIM enabled virtual reality models, clients and managers were able to make the decisions necessary to optimize the placement of information (2017). Proper signage has been shown to help pedestrians vastly when navigating new or confusing areas (Cubukcu, 2003). The efficiency of a signage system is always a challenge for designers as pedestrians generally have different origins and destinations; the complexity of the prediction shall be further compounded by area geometry, natural obstacles, and the nature of the expected crowd (locals or tourists, for example) (Buechner, 2012). Typically, these issues are addressed through trial and error approaches, using virtual reality to test diverse scenarios shall save time, money, and effort in the process of finding the optimal signage layout (USSC, 2003). Studies show that groups of pedestrians searching for a virtual building will find said building much faster in a model with wayfinding guidance signs as opposed to those in a model without any direction or even those in a model with a dynamic map (Cliburn, 2008); this is clearly an innovative application of the technology, as it allows designers to predict human behavior in setting prior to its construction.
This application of virtual reality is similar to the method proposed in this study, as conflicts and misplacement of facilities (in this case signs) will be evident in the virtual reality model. However, this is a depiction of the final design and may only be used to make final changes and visualizations, where on-site design gives the engineer the capability to visualize the area in question prior to carrying out any design efforts, thus making the design process more efficient. The current state of laser scanner and virtual reality technology provides the appropriate tools to enhance accuracy, safety, schedules, and budgets in design and plan production capacities for engineers. The accuracy of the data and the capability to return to the “field” model quickly can eliminate the need for unfeasible change orders and construction delays. The main goals of integrating these technologies include meeting schedules and maintaining high quality design and safety standards. In this project, game engines will be used for the creation of virtual reality scenes. Game engines help with the creation and development of video games by removing complex programing tasks (coding physics, colliders, gravity, and other in-game interaction) and allowing the designer to focus on the game artistic details (introducing game objects such as mountains, trees, buildings, roads etc) (Ward, 2008).
2.5 Point Cloud Manipulation
To seamlessly integrate these technologies, one must understand what the data is comprised of and the ability of each technology to handle and manipulate each piece of data. Specifically, the correlation between laser scanned locations and their translation to a virtual reality environment for
9
user interaction. Laser scanners produce three-dimensional point clouds and virtual reality scene generation engines use three-dimensional surfaces or meshes. It is possible to generate a mesh out of a point cloud, however this is a tedious process if done by hand, as point clouds consist of copious amounts of data. As their name suggests, point clouds consist of thousands (an even millions) of data points, each with information about its own location in a three-dimensional coordinate system; when viewed together these points show the shape of each object scanned at a given location. Higher scan resolutions provide more accurate scans, with sharper and more detailed images. A laser scan set at a resolution of 6.3 mm at a distance of 10 meters, may yield roughly 50 million data points per scan, and most locations require more than one scan to provide accurate depictions faithfully representative of the “as-is” conditions of the site, which results in large files that may not be easily handled by most computers (Chida, 2016). Sorting through and manipulating these datasets by hand will result in a time-consuming endeavor with high potential for information loss. As such, designers must turn to software and techniques that allow automated generation of three-dimensional surfaces.
Recently Building Information Models (BIM) are considered the best solution for storing and managing building life-cycle information including geometry and other data relevant to the managing and maintenance tasks of the facility (Eastman, 2011). However, terrestrial laser scanners (TLS) present an appealing counterpart to BIM in this capacity as they offer accurate three-dimensional “as-built” data to compare with the final design or “as-designed” models (Son, 2015). Large projects often require multiple scans from different locations. Thus, obtaining the entirety of the data as a single dataset in the same frame of reference is a common concern designers face; the accuracy of the data can be determined by the registration process between scans (Bueno, 2017). As the datasets are combined into a final point cloud, its size increases drastically, and the new point cloud must be later reduced in order to be converted into a mesh surface. Some of the typical techniques used for the point cloud reduction include: decimation, simplification, and segmentation. Decimation refers to the automated elimination of redundant points through an automated and typically random process characteristically inherent to software used to manipulate point clouds. Simplification may be thought of as the reduction of unnecessary points on a given surface, for example a rectangular wall may only require four points (one at each corner) to be defined as a single surface, and thus all the remaining points in between may be removed without experiencing a significant loss of information. And lastly, the segmentation process which involves rendering small portions of the point cloud as adjacent surfaces which form a somewhat seamless surface when viewed together. Each of these techniques has its own strengths and weaknesses when generating workable three-dimensional surfaces for virtual reality scenes.
10
Chapter 3 – Main Objectives
The main purpose of this study is to determine whether new technologies can enhance and expedite existing on-site design practices. The typical on-site design practices described in this dissertation involve hand sketches and quick measurements that result in over estimation of quantities for the construction phase of the work. Likewise, if the person on the field does not draw clear sketches with enough information, important data may be lost when transferring the information to digital media in the office, especially if the office personnel has no knowledge of the site and the field personnel is not available to corroborate the digital representations of their field experience. Through errors in data transfer and failed communication, many of the advantages of the on-field design process may be lost, reducing the quality and reliability of the final product. New technologies can be applied to eliminate or mitigate these potential issues, while enhancing the advantages of the on-site design method.
Applying laser scan technology to this method will increase the accuracy of the data one can bring from the field. The time spent setting up the equipment and scanning the site, will be saved on the measuring and sketching phases of the process. The sketches shall not require high levels of detail, since they are backed by a point cloud as accurate as any survey. Thus, the field personnel can focus on providing a tentative design solution while the machine scans the location for the existing condition diagram. Another aim of the project is to eliminate the need for essential design staff to leave the office longer than necessary in order to come up with a solution, while still providing the full picture of all the conflicts and the availability of space. Thus, minimizing the travel expenses and the “dead” time of essential staff, while keeping them out of potentially unsafe conditions.
Another benefit from laser scanning a location is the enhancement of personnel safety in the field. There are many potential safety hazards, especially when the field staff is not familiar with the surroundings, these hazards may include nearby powerlines, heavy traffic, loud machinery, falling hazards, debris, and many more. As the case studies in this dissertation will mostly focus on small design and refurbishment projects on sidewalks and intersection crossings, the main safety concern will be traffic conditions, when measurements are required to take place near or on the travel lanes of a road, the field crew must take measurements while accounting for the existing traffic nearby. The result may be rushed or forgone readings, measurements, and photographs from specific vantage points, such as the middle of the road or at some structures on the side of the road which may not be safely reachable without special equipment or without spending large amounts of time to safely measure, sketch, and inventory them. Rushed or incomplete fieldwork typically results in loss of information at some capacity, however crew safety shall always take precedence in these situations and while all safety measurements shall be met, the potential for accidents still exists. The use of laser scanners shall greatly benefit the safety aspect of roadside design, as the equipment can be safely placed well outside the travel lanes without compromising the quality or accuracy of the information, which shall remain at higher levels than the information of sketches and measurements provided by a field crew. Furthermore, distances and slopes should be more accurate as each point of the various surfaces is surveyed. Laser scans are also expected to reduce the time personnel is expected to remain on the field while providing the possibility to revisit the data from an office desk. Laser scanning is simple enough to be successfully carried out by one operator in the field, effectively reducing the size of field crews to one person, allowing for the possibility of maintaining other essential personnel in the office.
11
The addition of virtual reality scenes to this method shall provide several key advantages. On the one hand, it can bring the field experience to the office giving the staff the ability to experience the field conditions of the distant sites and the ability to visualize key conflicts and the proposed solutions; and on the other hand, it may provide a final test model that shows designers, managers, contractors, and clients what the final construction is expected to look like. Office staff can’t always make it to the field, regardless of the reason, some designers might lose track of the scale of their work and of the conflicts that may occur during the construction stage. Virtual reality scenes can provide a readily available visualization of the existing conditions of any site, helping the designer identify and eliminate potential conflicts at any stage of design. Through virtual reality scenes the designer can visit several sites from any location and at any time, thus saving time, minimizing data loss, and insuring his or her safety. Another advantage of the use of virtual reality is that the original field assessment can be modified by designers with certainty that they are not missing key details otherwise unavailable in notes, pictures, or diagrams. The implementation of virtual reality can serve as quality control for the final design, providing a visualization of the future condition. This may also help clients and contractors as they will be able to see what the final construction should look like. The implementation of this method also provides interesting outsourcing opportunities. While outsourcing is a well-established work method, the idea of bringing the field conditions kilometers away with great detail and accuracy should be enticing to any design company. Moreover, the fast speeds at which field conditions can be gathered and transferred is also a very impressive and appealing quality of these technologies. The accuracy levels of the devices and the gathered data are so reliable that the laser scanner operator is not required to be an experienced designer or engineer. The potentials for savings through the implementation of these technologies and methods is expected to have significantly high ceilings, which cannot be ignored from a management point of view.
Currently, the on-site design process selected in this study is a rather rudimentary method to produce designs and estimate quantities in a fast-tracked fashion. For this reason, the application of on-site design is typically reserved to two-dimensional drawings with simplistic CAD approaches. However, introducing BIM to this method may yield favorable results. Even though BIM is initially more time-consuming than regular CAD, the final models may be easily and accurately quantified for the development of cost estimates. BIM models can be exported to virtual reality engines with relative ease.
12
Chapter 4. – Resources Used
4.1 Stationary Laser Scanner
For this dissertation, we used the Leica Scan Station P20. It is composed of an ultra high-speed laser scanner with pulsed, dual-axis compensated scanning unit; survey grade scanning accuracy; long range and external circular bubble for level indication (Leica Geosystems AG, 2014). The scanner counts with a field of view of 360 degrees of horizontal range and 270 degrees of vertical range (Leica Geosystems AG, 2014).
FIGURE 3-LASER SCANNER (LEICA GEOSYSTEMS AG,2014)
4.2 Virtual Reality Viewer
For this dissertation, we used the Vive HTC available at the Faculdade da Engenharia da Universidade do Porto (FEUP). The Vive HTC counts with an OLED display with a resolution of 2160 by 1200 and a refresh rate of 90 Hz, the field of view encompasses 110 degrees, it counts with built in audio and a built-in microphone as well, it has a tracking area of 15 by 15 feet, and it counts with HDMI, USB 2.0 and USB 3.0 connections (HTC Corporation, 2017). Besides, it counts with the following sensors: accelerometer, gyroscope, Lighthouse laser tracking system, and a front-facing camera (HTC Corporation, 2017).
4.3 Point Cloud Inquiry Software
Five different Point Cloud Inquiry programs were used in this study, they each have measurement and point cloud manipulation capabilities, however they each had specific uses deemed helpful by the author. The programs used were: Leica Cyclone, 3D Reshaper Viewer 2017, ReCap 2017, Pointfuse, and MeshLab.
Leica Cyclone: Cyclone was the first program used on any of the scanned locations in this study. It has an easy user interface and can read BIN, PTX, PTS, XYZ, and FLS file formats (amongst others), it can also export PTX, PTS, and XYZ file formats. Using this software, point clouds can be manipulated in various ways (decimation, simplification) and they can also be accessed for design purses as measurement tools are available in this software. The drawback for this software is that it can only be accessed with a license, and in the same network that the license is available.
13
3D Reshaper Viewer 2017: 3D Reshaper can only read PTS and XYZ files (in the trial version), and can only export to the same file formats. It has the capability for simplification of the point cloud and allows for measurements to take place; the benefits to using this tool, is that it has a very simple user interface and it is available to us anywhere as long as an internet connection is secured.
ReCap 2017: ReCap converts PTX, PTS, FLS, and XYZ files to RCP format. It cannot work on any other format, and it doesn’t export to any other format, however it has the simplest user interface, and Revit can only view point clouds in RCP format. The measurement tools in ReCap are very intuitive and simplification is faster and more user-friendly that in other pieces of software.
Pointfuse: Pointfuse is a relatively new piece of software and it is expected to be one of the most powerful tools in the market once they perfect the final version. It features the ability to import most cloud files available (DP, E57, FLS, FWS, LAS, LAZ, PTS, PTX, and XYZ) and has the capability to convert point clouds and export them to: photo-realistic textured three-dimensional models (OBJ, DAE), three-dimensional vector files (DAE, DXF, FBX, IFC, OBJ, STL), and two-dimensional vector files (DXF). A limited trial license is currently available, and shall be used as part of the case studies in this dissertation.
MeshLab: MeshLab will solely be used in this study for converting PTX files to PLY format.
4.4 Drafting and BIM
AutoCad and Revit were selected in this study for drafting and BIM applications. Their use in this area is very straightforward as the programs shall be used for their intended purposes.
FIGURE 4-REVIT TEST MODEL
4.5 Virtual Reality
Three programs were selected for virtual reality scene generation in this study, the Unity game engine, Revit and Prospect. Unity allows for the designer to develop virtual reality scenes and has the capability to import objects from other programs to incorporate to the scene; in this study, the objects we expect to import will mostly be in FBX format. There is an application for Unity called
14
“Free Point Cloud Viewer Application for Unity” that allows for point clouds to be incorporated into the scene if, and only if, they have been previously converted into PLY format. There is also a paid application for Unity called “Point Cloud Viewer and Tools” that shows promising results in their publicity, however it does not offer a trial version, and as such, this avenue will not be explored in this dissertation. Revit is a BIM software, however there is a plug-in through Prospect which allows for virtual reality interaction as long as the model is in SKP, OBJ, or IUZ format (the IUZ format will not be used in this study).
FIGURE 5-UNITY BASIC SCENE
FIGURE 6-UNITY SCENE AFTER APPLYING MATERIAL PROPERTIES
4.6 Data manipulation and interaction between Laser Scanners, Virtual Reality and BIM
The way that information is transferred and stored in each of these technologies is slightly different, therefore, various software elements use different formats for the same information. Various file extensions were used in this study in order to achieve intercommunication between the software pieces. This is the list of the most common file types encountered in this study followed by a brief explanation of their meaning or how they work:
BIN: The BIN files are imported from the Leica Scan Station into the office for processing, from here they can be manipulated with Cyclone in various ways, Cyclone can work directly with these files combining them in a project, and it can also export to the several different formats mentioned above.
15
PTX: PTX format includes x, y, z coordinates and different color intensities, basically all the information picked up by the scanner.
PTS: PTS files may be thought of as stripped-down version of the PTX files, they are smaller files, but the information loss may be detrimental for virtual reality work.
XYZ: XYZ files are files that retain solely x, y, and z coordinates in plain text format. PLY files are also known as polygon file format files, and they retain a relatively simple description of a point cloud as a list of nominally flat polygons.
RCP: RCP is an Autodesk proprietary format and their products use RCP files to view point clouds. FLS: FaroScene Point Cloud Files or FLS files are the default file type used by Faro laser scanning hardware and software, FLS files retain similar amounts of information as PTX files.
FBX: The Filmbox or FBX file format is, like the RCP file format, proprietary to Autodesk, and FXBs are used to provide interoperability between digital content.
OBJ: OBJ files are geometry definition three-dimensional files often deemed photo-realistic. SKP: SKP files are the typical file extension used by Sketchup.
16
Chapter 5. – Theoretical Process
The main goal of this dissertation is to integrate typical project design practices with new and fast-growing technologies to increase project data accuracy, crew safety, and overall engineering value while reducing time and cost in a streamlined process. To achieve these goals, we expect to integrate laser scanners, virtual reality, and to a lesser extent BIM technology. All these technologies have been previously employed in the industry at some capacity. There is a level of compatibility amongst the various programs and file types these three technologies employ. However, there are still many operational and technical gaps to overcome for a smooth and seamless plan production process to occur in a streamlined fashion. File sizes and formats are the main concerns we expect to encounter and tackle in this study. Another concern are the capabilities of some of the software to handle exported data from other software of devices.
Prior to developing and testing the processes for this study, separate tests were run with the scanner resolution alone. One of the intersections was scanned three different times at three different resolutions each time (high resolution: 3.1 mm at 10 meters with a quality level 3; medium resolution: 6.3 mm at 10 m with a quality level of 3; and low resolution: 12.5 mm at 10 m with a quality level of 2) to provide insight about the laser scanner capabilities and to determine the minimum resolution necessary to provide workable data. These scans shall be tested in the categories of speed, level of detail, workability of the file, ease of transfer and conversion, and accuracy of the picture provided. This assessment is important because it provides a frame of reference for future applications of the technology as a standalone and as part of the main goal of this study. Further, application of this technology may require more or less accurate scans, and as such this assessment can be of help when selecting resolutions.
The original on-site design process selected was based on design practices employed for the “TxDOT Statewide Curb Ramp Design Project” and roughly functions as follows: a roadway with poor sidewalks and pedestrian crossings is selected for improvements, two- to three-person field crews are deployed to the project site. Each crew is provided the following equipment: safety vests, safety helmets, a level (for measuring slope), a tape (for measuring distance), a laser (for measuring height differentials in conjunction with the tape), a laptop with a database (for inputting conflicts and design descriptions), a GPS enhanced digital camera, and papers for existing condition sketches and proposed solution sketches. Note that the laptop is also equipped with drafting software for the crew to sketch existing field conditions at the site as quickly as possible. The field crew is expected to document and photograph all potential conflicts at the site while also drawing field sketches of the existing conditions and the proposed solutions. After a week of data collection, the crews return to the office and transfer the data to be processed by the office staff. Depending the need the field crew can also help processing the field data. The staff in the office can then draft the proposed designs based on pictures, field sketches, and database entries. Communication between field crews and office staff is of utmost importance in this step of the process. Once the designs are drafted, plan sets including quantity estimates for each design location can be finalized and sent out for bid. The tendered project for the entire roadway is then awarded to a construction company and constructed.
17
This process was proven to eliminate many frivolous change orders, schedule delays, and conflicts between the stakeholders (See Figure 7).
Generally, we expect to carry out our process as follows: visit the field and scan the intersection with a laser scanner, come up with notes for a proposed solution, transfer the laser scan data and the notes to the office (in this case a personal laptop computer), produce a virtual reality model of the existing condition, use the laser scan and the virtual reality scene to generate the existing condition diagram, use the scan, virtual reality models, field notes and the existing condition diagram to design the proposed solution, and draft the proposed solution (See Figure 8). The main goal is to provide a streamlined process including accurate laser scans and virtual reality models of the existing condition to confidently produce final designs. In theory, there are three possible specific variations of this process we could engage to successfully arrive at the intended goal. While these three process variations are very similar in theory, they shall use different programs, applications, and file formats; therefore, each of these variations and their results will be assessed separately against the original process to estimate potential time savings and accuracy improvements of the results.
All three processes assume that measurements will mostly take place on the point cloud management software (Cyclone, 3D Reshape, or Pointfuse), with the virtual reality models of the field condition as a support tool, for visualization purposes. It is important to note that the original laser scans carried out for this project were the typical PTX format or converted to PTX from FLS (Faroscene Point Cloud File) file format. As noted before the FLS files are the default extension used by Faro laser scanning hardware and software and PTX files are considered the universal format for point clouds, both file types retain all or most of the information from the original scan (x, y, z coordinates and color intensity being the most crucial to this paper).
FIGURE 8-ORIGINAL PROCESS
FIGURE 7-GENERAL PROCESS PROPOSED
8
18
The first process will be the simplest and fastest and shall work as follows: (1) start with a field visit where an intersection or portion of the corridor will be scanned, and field notes will be developed, (2) data transfer to the office setting (download data from scanner and digitally store notes), (3) transform the imported PTX data files to a Polygon File Format (PLY extension file), (4) import the PLY file to Unity using the Point Cloud Viewer Application, (5) develop existing condition diagram, (6) and finally develop possible solutions and design(See Figure 9).
FIGURE 9-PROPOSED PROCESS 1
The second process will make use of an automatic point cloud to three-dimensional model conversion software named Pointfuse and shall work as follows: (1) start with a field visit where an intersection or portion of the corridor will be scanned, and field notes will be developed, (2) data transfer to the office setting (download data from scanner and digitally store notes), (3) transform the imported PTX data files to a Filmbox file format (FBX extension file), (4) import the FBX file to Unity as an object, (5) develop existing condition diagram, (6) and develop possible solutions and design. Note that in this process PTX files may also be converted to geometry definition files (OBJ extension) and thus we can replace the aforementioned steps following the conversion with steps (5) through (7) of the third process (See Figure 10) or import the OBJ file directly into Unity.
19
The third process will use BIM software, namely Revit, to process the point cloud and shall work as follows: (1) start with a field visit where an intersection or portion of the corridor will be scanned, and field notes will be developed, (2) data transfer to the office setting (download data from scanner and digitally store notes), (3) transform the imported PTX data files to an RCP file format using ReCap, (4) convert the point cloud from RCP to a SKP or a OBJ file (5) view in virtual reality using the Prospect plugin, (6) develop existing condition diagram, (7) and develop possible solutions and design. Note that in this last process, RCP files may also be converted to FBX files using Revit on step (4) and thus we can replace steps (5) through (7) with steps (4) through (6) of the second process. Another possibility is to manually place three-dimensional objects in the Revit model to create the FBX file for Unity (See Figure 11).
FIGURE 11-PROPOSED PROCESS 3
These three processes will be compared to each other and to the typical approach using hand sketches and rough measurements. The top performing process of the three will be selected and be carried out at all available scanned locations to test whether a streamline production system is possible. There are many open challenges and technological gaps we expect to find while executing these processes. As mentioned before file size, software capabilities, and format compatibility are the critical general concerns. Sometimes objects in the foreground can also block important features in the background when scanned, while this is a minor issue and easily fixable by selecting an appropriate scan location or by scanning the area from more than one vantage point, it shall be noted and addressed as necessary. Another open gap, is the capability of software to recognize objects as individual elements in a point cloud as opposed to mere groups of points with similar coordinate and color intensity values. Each process is also expected to present its own unique challenges based on the nature of the selected information handling method.
The main challenge we expect to encounter with the first process is the quality of the virtual reality scenes generated in Unity using point clouds converted to PLY format. This format basically converts the points to polygons giving the point cloud the appearance of a surface mesh. From far away one cannot perceive this effect and the point cloud looks like a clean surface, but upon closer inspection
20
the image seems somewhat blurry, incomplete, or distorted. This is an aesthetics issue rather than a functionality one, therefore this method could successfully be used to for designers to visualize conflicts in the field, but it would not be recommended for marketing purposes or for public consumption.
It is in the second process that we expect to find several technological and logistical issues. File size is expected to be at the center of all potential complications when generating and mesh out of a point cloud. This concern may be addressed through decimation, simplification, and segmentation. When using decimation, programs like Cyclone remove points at random and sometimes it is difficult to gauge what information is being lost through this process, in some cases full objects may be decimated away delivering an incomplete image of the field condition and thus defeating the purpose of the exercise. Addressing the cloud size through simplification is time-consuming, and as points are removed manually user error can also be introduced. This method however gives the designer more control upon what they can remove and show as part of the final model as the sections of the point cloud selected for removal are only the pieces of information deemed irrelevant to the design. Lastly, segmentation refers to rendering the point cloud as a surface in small parts one at the time. The expected result is a full surface mesh of the entire model which in turn creates a file larger than the original point cloud and is a time-consuming endeavor. All three of these methods have their advantages and disadvantages, we recommend that a combination of simplification and segmentation be used for the case studies.
And finally, the challenges we expect to encounter in the third process are analogous to those for the second process, and shall be addressed in the same way, through a combination of simplification and segmentation if possible. It is also noted that manually creating models in Revit and exporting them as FBX files that can imported into Unity as objects is a proven and successful method for creating virtual reality scenes, this however is a time-consuming endeavor. Furthermore, the level of detail required to recreate point cloud data may yield an overly complex product well beyond what is necessary for this process. As such the possibility of recreating the point cloud in Revit is deemed to be too time-consuming and exhaustive to provide positive contributions to the overall goal of the process we propose.
21
Chapter 6. – Process Implementation
The specific ways in which the two key technologies, laser scanning and virtual reality, will be implemented in this method will be described in this section. The feasibility of their implementation and the success level of each technology had to be determined prior to conducting the case studies. The process execution will give us a starting point from which to run the case studies, this section is also expected to dictate initial impact to the overall process.
6.1 Laser Scanning
Before testing the three processes the first task in this study was to compare laser scan resolutions and determine how detailed a scan is necessary for this this work:
FIGURE 12-PORTO LOCATION 1 HIGH RESOLUTION SCAN
22
FIGURE 14-PORTO LOCATION 1 LOW RESOLUTION SCAN
As we can observe in Figures 12 through 14, where blue represents better data quality, the low resolution scan does not appear to have enough data points to accurately determine any features in northern portion of the intersection, and both the high and medium resolution scans paint a complete picture of the field condition, yet the level of detail in the higher resolution scan is far superior. One can observe that the northeast corner of the medium resolution scan depicts lower detail than the rest of the scan, and at lower resolutions this might cause issues for designers in the office. It should be noted that this roadway is rather narrow (approximately 5.75 m) and at a larger distance, the level of detail across the street might not suffice using the medium resolution. In this case, further inspection shows that the level of detail on the medium scanner is sufficient for design purposes (see Figures 15 and 16), however we recommend the high resolution (3.1 mm at 10 meters with a quality level 3.) be used in further scans to avoid any potential information loss. Following this assessment, the implementation of laser scans in all processes is straight forwards and is not expected to cause any problems, as all locations were scanned a 3.1 mm at 10 meters resolution or higher.
23
FIGURE 16-PORTO LOCATION 1- MEDIUM RESOLUTION SCAN - DRIVEWAY VIEW
6.2 Virtual Reality
The implementation of virtual reality scenes proved to be the main setback of the proposed method. Process 1, described in the previous section, was not successful in this study. Unity was unable to read or handle the exported PLY files. While this method has been successful in other cases using the same coding and additional applications, we could not determine the source of the corruption in the files. It is our estimation that the error in this process was inherent to the automated conversion processes attempted and as such we could not continue the test. Therefore, the case studies cannot be completed using this proposed process. Process 3 encountered similar difficulties and while the point cloud was successfully imported into Revit via ReCap, it was not possible to modify the point cloud or export it as a different file format. The key issue encountered was that Revit views point clouds as external references which may only be viewed as an external element and as such could not be modified to meet our needs.
24
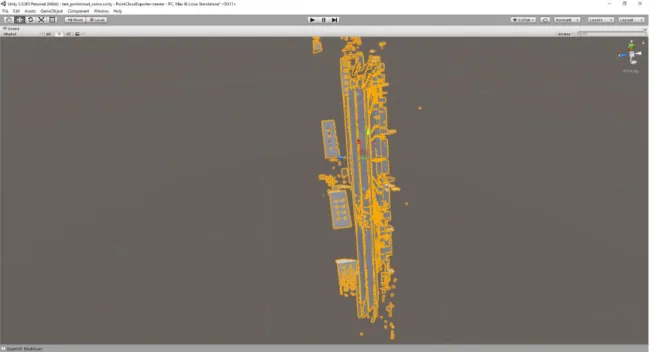
The second process successfully implemented using both Unity and the combination of Prospect and Revit. The file conversions stripped the original point clouds of color data and we were only able to see the scenes in grayscale. We believe this is due to the use of a trial version of Pointfuse to convert point clouds to FBX or OBJ format (Figure 17). The generated FBX vector file shown in Figure 18 depicts a monochromatic version of the scan, where material attributes and grayscale can be added separately to the scene, however the generated FBX file is composed of so many points that it took over two hours to load into Unity and crashed the program when the properties were added, thus failing to be a viable option for the proposed method. OBJ surface files were then exported from Pointfuse and tested in Prospect. The results were promising as we were able to enter monochromatic virtual reality scenes with a degree of material texture. Figure 19 shows overall model views from Prospect scenes.
FIGURE 18-TEXAS LOCATION 1-UNITY FBX IMPORT
25
While the Prospect models are monochromatic, the scenes are still versatile and Prospect provides the viewer with many interface options to help navigate and experience the site. Figures 20 shows the capability to adjust shadows and the sun path for different times of the day and the year. Figure 21 shows the interaction with callouts within the scene, allowing the user to make marks on interesting features or potential conflicts, in this picture we can also observe how Prospect shows the simplified mesh surfaces particularly the rendering of the automobile on the left. Figure 22 boasts Prospect’s ability to take pictures inside the scene and check the pictures saved before. Figure 23 shows the rendering of a strip-mall located at the southeast corner of the scanned location.
FIGURE 20-PROSPECT SCENE - SHADOW AND SUNLIGHT CONTROL