Prospective Studies of Smart Technology Products for Aging Challenges for the Potential Mexican Market in 2030 Edición Única
104
0
0
Texto completo
(2) INSTITUTO TECNOLÓGICO Y DE ESTUDIOS SUPERIORES DE MONTERREY RECTORÍA DE ESCUELAS NACIONALES DE POSGRADO. PROSPECTIVE STUDIES OF SMART TECHNOLOGY P R O D U C T S FOR AGING. C H A L L E N G E S FOR THE POTENTIAL MEXICAN MARKET IN 2030. TESINA PRESENTADA COMO REQUISITO PARCIAL PARA OBTENER EL GRADO ACADÉMICO DE: MAESTRA EN PROSPECTIVA ESTRATÉGICA. POR: ALBA GRACIELA ORTEGA TREVIÑO. MONTERREY, N. L.. MAYO DE 2012.
(3) INSTITUTO TECNOLÓGICO Y DE ESTUDIOS SUPERIORES DE MONTERREY. RECTORÍA DE ESCUELAS NACIONALES DE POSGRADO. PROSPECTIVE STUDIES OF SMART TECHNOLOGY PRODUCTS FOR AGING. CHALLENGES FOR THE POTENTIAL MEXICAN MARKET IN 2030. TESINA PRESENTADA COMO REQUISITO PARCIAL PARA OBTENER EL GRADO ACADÉMICO DE: MAESTRA EN PROSPECTIVA ESTRATÉGICA. POR: ALBA GRACIELA ORTEGA TREVIÑO. MONTERREY, N.L.. MAYO DEL 2012.
(4) INSTITUTO TECNOLÓGICO Y DE ESTUDIOS SUPERIORES DE MONTERREY. RECTORIA DE ESCUELAS NACIONALES DE POSGRADO EGADE BUSINESS SCHOOL Y EGAP GOBIERNO Y POLÍTICA PÚBLICA.. Los miembros del comite de tesina recomendamos que el presente proyecto de tesina presentado por la Lie. Alba Graciela Ortega Treviño sea aceptado como requisito parcial para obtener el grado académico de:. MAESTRA EN PROSPECTIVA ESTRATÉGICA. MAYO 2012. i.
(5) EXECUTIVE SUMMARY. "I'm more interested in the future than in the past, because the future is where I intend to live". Albert. Einstein.. This master thesis will be presented as a part of the academic studies about Prospective strategies at the Graduate School of Government and Public Administration ( E G A P ) . It has the purpose to put in practice concepts and tools learnt during the master's program.. This document describes smart technology products that focus on the elderly people which have mobility problems. T h e s e products are made in highly-developed countries such as Japan, Ireland etc.. The present objective of the study is to s e e the feasibility of these products in the Mexican culture considering the peoples conservative and traditional values. Therefore it w a s necessary to conduct a market research trough surveys and interviews with potential clients. The considered participants for this study are located in Monterrey, Nuevo Leon, Mexico.. This thesis is considered as applied investigation according to the definition from E G A P . In order to fulfill the objectives from the present investigation, it was required to consult expert's opinions from different fields. With their responses the investigation finished giving different possible perspectives for the industry of innovative products toward 2030.. ii.
(6) ACKNOWLEDGMENTS This project gave me the opportunity to grow professionally and personally. However, this investigation contains many hours of effort and dedication not only from my side but also from all the people who were involved and made this project possible. Therefore I would like to thank: God for giving me many blessings and for allowing me to achieve this objective in my life. My family, especially my mother for teaching me faith and for giving me support and strengths to always look further. With love to my husband for all his support, observations, patience and motivation during this project. All my teachers from whose I have learnt in every class and who made it possible to obtain this master degree. My principal advisor, D.Sc. David G u e m e s Castorena, for accepting this investigation project and for his excellent orientation. My faculty advisors, D. S c . Rafael Ernesto Bourguet and M.Sc. Carmen Alicia Moreno Merino for taking this investigation project and for their valuable contribution. My consulted experts, survey respondents and cornerstones in order to realize this investigation.. interviewees. that built one of. the. And Ph.D. Edgar Aragon for giving me the opportunity to be a member of investigation in his research projects, which was such a rewarding and enriching experience.. iii.
(7) TABLE OF CONTENTS EXECUTIVE SUMMARY. ii. ACKNOWLEDGMENTS. iii. LIST OF TABLES. vi. LIST OF FIGURES. vii. 1. INTRODUCTION. 1. 1.1 Product descriptions. 3. 2. PROJECT DESIGN. 7. 2.1 General Objective. 8. 2.2 Question of investigation. 8. 2.3 Hypotheses. 8. 2.4 Methodology (execution plan). 8. 3. THEORETICAL FRAME. 12. 3.1 Scanning. 13. 3.2 Interviews. 13. 3.3 Surveys. 14. 3.4 SWOT Analysis. 14. 3.5 Structural analysis (MICMAC). 15. 3.6 Scenarios. 19. 4. PROJECT IMPLEMENTATION AND ANALYSIS OF RESULTS. 22. 4.1 Scanning. 22. 4.1.1 History of the robot industry. 22. 4.1.2 Leading countries in the field of robotics. 23. 4.1.3 Technology tendencies for service robots. 29. 4.1.4 Potential applications for robots. 30. 4.1.5 Obstacles considered for this type of technology. 32. 4.1.6 Technology developments focused on elderly people. 34. 4.1.7 Socio Cultural analogy: A comparative analysis between Mexican and Japan. 36. 4.1.8 Maslow and the theory of dynamic motivation. 42. 4.1.9 What are the Mexican health necessities and how to adopt smart technology products to those needs?. 43. 4.2 Survey and interview results. 44. iv.
(8) 4.3 SWOT analysis for smart technology products on the Mexican market. 57. 4.4 Structural Analysis (MICMAC). 59. 4.5 Scenarios formulation. 66. 5. CONCLUSIONS. 74. 5.1 Next steps for companies working with prototypes. 78. Bibliography. 81. Appendix A. 83. Appendix B. 88. Appendix C. 89. Appendix D. 91. v.
(9) LIST OF TABLES Table Table Table Table Table Table Table Table Table Table Table. 1. 2. 3. 4.. Product information 4 Scale for structural analysis 17 Hofstede's scale. Elaborated by the author. (Hofstede, G , 2001) 36 Hofstede's evaluation of Mexico and Japan, Elaborated by the author (Hofstede, G , 2001) 38 5 Economic variables comparison between Mexico and Japan. Elaborated by the author 40 6. Interview design. Elaborated by the author 55 7. Interview results, Elaborated by the author 56 8. M I C M A C ' S variables and definition. Elaborated by the author 60 9. Variables classification according to their location inside the map and structural functions. Elaborated by the author 64 10 Uncertainty A . Elaborated by the author 67 11 Uncertainty B. Elaborated by the author 67. VI.
(10) LIST OF FIGURES Figure 1. Guido (picture courtesy of Haptic Ltd) (Mann, 2005) 4 Figure 2. Prototype Walking Assist Device http://world.honda.com/news/2008/c080630Walking-AssistDevice/photo/pages/01 .html 4 Figure 3. Bodyweight Support Assist http://world.honda.com/news/2008/c081107WalkingAssist-Device/photo/pages/01 .html 5 Figure 4. The Honda Humanoid Robot http://www.honda.co.jp/ASIMO/history/asimo/index.html 5 Figure 5. Elaborated by the author. Foresight Diamond which maps the methods considered a s outputs and inputs in this investigation and by its core type of knowledge source. (Georghiou, Cassingena, Keenan, Miles , & Popper, 2008) 11 Figure 6. Influence x dependence chart. Source: Elaborated by the author based on the Future Research Methodology 18 Figure 7. Leading countries in the field of robotics 24 Figure 8. " E v e r l " a Korean woman android 25 Figure 9. Number of robots per 10,000 persons employed in the manufacturing industry in 2003 26 Figure 10. Number of robots per 10, 000 production workers in the motor vehicle industry, 2001 and 2003 26 Figure 11 Robots used per 10,000 employees ( U N E C E , 2000) 28 Figure 12 Ever3 a South Korean performing robot 30 Figure 13 Robovie-ll, a robot shopping helper 31 Figure 14 Robonaut 2 31 Figure 15 Figure 16 A M o M A ' s exposition "Talk to me" Source: http://www.moma.org/visit/ 32 Figure 16 Automatic C a s h box in a German supermarket 33 Figure 17 Mental map about devices for elderly people .Elaborated by the author using the Cmap Tools software 35 Figure 18 The 5D of professor Geert Hofstede. (Hofstede, G , 2001) 39 Figure 19 Maslow's theory. Elaborated by the author 43 Figure 20 Elaborated by the author. (INEGI, 2010) 44 Figure 21 Percentage distribution of population with disabilities per disability type. Elaborated by the author. (INEGI, 2010) 44 Figure 22 Survey questions structure and its distribution per role. Elaborated by the author. 45 Figure 23 Surveys result about gender. Elaborated by the author 47 Figure 24 Surveys results about age. Elaborated by the author 47 Figure 25 Survey results about role. Elaborated by the 47 Figure 26 Survey results about type of discomfort. Elaborated by the author 48 Figure 27 Survey result about relatives. Elaborated by the author 48 Figure 28 Survey result about impact grade. Elaborated by the author 48 Figure 29 Survey result about product awareness. Elaborated by the author 49. vii.
(11) Figure 30 Survey result about product preferences. Elaborated by the author 49 Figure 31 Survey results of preferences of product characteristics. Elaborated by the author 50 Figure 32 Survey results about adaptation process. Elaborated by the author 50 Figure 33 Survey result of type of impact on users. Elaborated by the author 50 Figure 34 Survey results about product vs. relative. Elaborated by the author 51 Figure 35 "Survey result about product versus a nurse. Elaborated by the author 51 Figure 36 Survey results about product vs. auto. Elaborated by the author 52 Figure 37 Survey result about independence vs. security. Elaborated by the author 52 Figure 38 Survey results of principal purchasing motive. Elaborated by the author 53 Figure 39 Survey results of product acceptance. Elaborated by the author 53 Figure 40 S W O T Analysis. Elaborated by the author based on surveys, interviews and the scanning review 57 Figure 41 Matrix of Direct influences (MDI). Elaborated by the author 61 Figure 42 Potential Indirect influences & dependencies. Elaborated by the author using the M I C M A C Software 63 Figure 43 Graphic of potential indirect influences. Elaborated by the author using the M I C M A C software 65 Figure 44 Scenarios for the future of smart technology products. Elaborated by the author. 68. viii.
(12) I. INTRODUCTION The relevance of this investigation emerges from the concern about aging population that many countries around the world will present in next few decades. However, s o m e countries especially in Europe, North America, and Asia have this problem already.. In 2000 the U S C e n s u s Bureau published a report with the 25 oldest populations measured by the percentage of people over 65 years. T h e following countries are those with the highest rate of people in this age: Italy with 18.1%, Greece with 17.3%,. Sweden. with 17.3%, Japan 17.0% and Spain with 16.9% ( U S Census Bureau, 2001).. All of these countries have something in common: In the next two decades they will have a low number of economically active people that cannot afford to pay medical attention services for the elderly. A s far a s we now, the aging megatrend is expected to keep on increasing and the question is: What is the right approach in order to solve this problem?. Japan is a peculiar nation that begun an ambitious project to face the problem of the aging population. through. smart. technology. products. that help older people in keeping. independence on their activities. In 2005, William Mann published an analysis about concepts that refer to technical improvements in order to assure the independency of older people in their daily living activities. (Mann, 2005) such as eating, grooming,. dressing,. toileting, walking and bathing, Instrumental activities of daily living, such as managing homes, managing. ones money, shopping, getting to places using a telephone. ones. and finally. leisure activities which are important activities to increase the life quality of the elderly.. Why is this topic important? It is considered that by 2025 the industry of smart technology products is expected to have a higher market volume than the automotive industry with clients that will pay a s much a s they are willing to pay for a car. It is expected that South Korea will introduce individual robots for domestic use between 2015-2020 (Halal & W o n g , 2011).The global market volumes for these products is evaluated in about $15 billion dollars (Halal & W o n g , 2011). 1.
(13) All these facts have a high relevance for Mexico because this country is about to begin presenting the s a m e problem of aging population within the next 19 years ( C O N A P O , 2012) and it will be important to know if and how these smart technology products will be accepted from Mexican citizens. Health problems, moral and ethical conflicts a s well a s possible fears that people may have regarding this technology are vital factors that have to be investigated during the market analysis.. Some people are concerned about the danger robots could cause against human beings as well as about the creation of unemployment or to s e e how people perceive the interaction with these smart technology products. One reason for this limitation is that human machine communication is complex and according to Everett M. Rogers, one of the attributes of innovation and their rate of adoption is complexity, the degree to which an innovation is perceived a s relatively difficult to understand and use. In other words, would this smart technology be a user-friendly technology for the Mexican senior citizens?. In order to give an answer to those questions with the focus on the cultural aspect, it was necessary to develop a market investigation about potential Mexican clients in order to know their perception about these products. In Mexico the total population is about 112.3 million people from which 5,739, 270 persons (51% female, 4 9 % male) have a physical or mental difficulty to develop daily life activities. (INEGI, 2010).This information points up. that the availability of smart technology products on the Mexican market is of the e s s e n c e and has to be researched in order to mark a difference in people's life quality.. It was necessary to conduct a scanning review about all the technologies and advances regarding products focused on the aging population as well as to search for information related to this subject in books, magazines, and websites. Interviews and surveys were also a significant part of this investigation. Furthermore, questionnaires were applied to people who are potential clients, people with mobility problems, relatives and experts in areas such a s robotics, innovation, medical science, biomedicine and artificial intelligence.. All the gathered information obtained from scanning, surveys and interviews was the basis for the development of a S W O T analysts in order to find out the current position of these 2.
(14) products on the Mexican market and to s e e which are the opportunities and treats for the market entry in Mexico. Finally through several expert consultations the C r o s s - Impact analysis was conducted and the obtained strategic variables helped to develop the scenarios.. In the author's personal point of view this project represented an opportunity to apply prospective tools learned in my master degree in order to visualize how the future can be in the next 20 years a s well as to analyze which are the best choices for the aging population. This thesis brought to the author the experience to share ideas with international and Mexican experts. Furthermore, to contact to people with. mobility. problems was vital since it represented the basis for the investigation of smart technology products in order to analyze how they could improve people's life quality.. 1.1 Product descriptions There exist many prototypes of smart technology products focused on elderly people and many of these products come from highly developed countries. In this academic investigation, the four investigated products were selected because of their innovative design as well as their benefits.. Further selection criteria for choosing these four products were the type of product and the focus on mobility problems. The product's origin is Japan and Europe (Ireland) where the aging tendency has arisen earlier than in the rest of the world. A further criterion is the product support for tasks related to help senior citizens to move easily from one place to another as well as to improve their daily life activities, such as being a reminder for medication etc. However, according to the university regulations this investigation has a limited range which is why only four smart technology products has been selected and studied. The following table shows the key facts of these products.. 3.
(15) Table 1. Product information. 4.
(16) 5.
(17) All these products are just a few examples of all prototypes and products considered a s smart technology products that might be helpful for the elderly to get under control their mobility problems. T h e majority of the products mentioned in this document are made in Japan and three of the investigated products are made by Honda. However, there are also other Japanese and Korean companies that are developing similar products, such as Sony, Sanyo, Mitsubishi, L G etc.. The product launch for this type of products on the Mexican market involves many cultural challenges. Since this kind of product represents a high innovative technology, the degree of acceptance has to be investigated carefully because for any traditional and conservative Mexican, those products will have a significant impact and may require a change in mentality.. 6.
(18) 2. PROJECT DESIGN As it was mentioned in the introduction, this research project is about Mexicans and their opinion over high technology products focused on mobility problems of the aging population. What is pretended to achieve in this investigation is to compile information about culture and perceptions from potential Mexican clients who are in the age of 35-40 years right now, as well a s relatives from senior citizens with immobility syndrome which is defined as the diminished capacity to develop daily life activities because of locomotion decline. This disability can be caused by diseases, such as arthritis (World Health Organization, 2011). Furthermore, people that currently have mobility problems are considered during this investigation a s well.. Final clients for this information will be companies who produce this type of prototypes, since this information will contribute to create a market commercialization strategy which will prepare the products for the launch and will give companies a better understanding of potentials clients. The study was done in Monterrey, Nuevo Leon, Mexico, one of the cities with the highest.level of G D P per capita in the country. (INEGI, 2010). Furthermore, the. results of this investigation will be extrapolated to obtain a general view throughout Mexico in order to visualize the market volume.. Another important factor on this investigation is the culture analysis through a culture analogy between the J a p a n e s e socio culture system and the Mexican one. This step will be carried out in order to analyze the factor of success of these products in J a p a n and to compare the resulting factors with the Mexicans ones in order to understand if these products can be accepted.. Expert opinions from the field of robotics, biomedical solutions, medical science, and marketing were required. Their opinion was consulted using prospective techniques in order to detect tendencies that can help companies during the process of innovations diffusion on the Mexican market. 7.
(19) 2.1 General Objective The general objective of this research is to develop a prospective study in order to investigate the future market for smart technologies products that will help to reduce locomotion problems of Mexicans senior citizens towards 2030.. 2.2 Question of investigation Will this smart technology be a user-friendly and well-accepted technology for the Mexican senior citizens in 2030?. 2.3 Hypotheses The hypotheses for this investigation are the following ones:. a) Many Mexican people still don't know about these innovative assistive products.. b) The Mexican social cultural system is different to the Japanese one which can implicate a difficulty in adapting to this type of assistive technology.. c) Senior citizens in 2030 are people that are currently around 40 years old, which is an important factor to analyze since this new generation of elderly may already have had contact with technological products which may simplify the interaction with smart technology products in the future.. d) Mexican senior citizens will be willing to pay for smart technology products as much as they would pay for a car.. 2.4 Methodology (execution plan) In order to find and analyze information as well as to prove and answer the hypotheses and the question of investigation, the methodology applied to study this problem was the following one: 8.
(20) Phase 1: State of the art of smart technology products worldwide Stage: Diagnostic of the state of the art of smart technology products. Task 1: Scanning: Recompilation of information about advances in technology all over the world, expert opinions referring to the time when this technology will be available and studies about the necessities of the aging population.. Task 1.1: Cultural analogy:. A comparison between the Mexican socio culture vs.. the J a p a n e s e one. A n analysis of success factors related to innovative products.. Task 1.2: Maslow and the theory of dynamic motivation: Understand why Individuals act to satisfy their necessities. Task 1.3:. Mexican health necessities:. Investigation about the number and types. of health problems.. Task 2: Surveys: Application of questionnaires in order to obtain information from experts in the field of robotics and medical science a s well a s Mexican potential customers in the age of 35-40 years, relatives and people with mobility problems. Task 3: Interviews:. Elaboration of interviews for experts in the field of robotics,. biomedical solutions, medical science, and marketing a s well as people with mobility problems, relatives and future potential clients in the age of 35-40 years.. Phase 2: Identification of strategic variables. Task 1: SWOT analysis: Is based on all the information obtained from scanning, surveys and interviews. A S W O T analysis is carried out in order to analyze where these products are situated on a Mexican 9.
(21) market.. This will help companies to consider both, products. limitations and opportunities perceived by Mexicans.. Task 1.1:. Categorization. of variables:. All the information based on people's. perception was consolidated into one single S W O T analysis, however, a lot of answers were repeated, which is why. a categorization was required in order to. summarize similar information into one category.. Task 1.2: Definition of variables: Variables obtained from the S W O T analysis are defined based on information obtained from the respondents a s well as from the scanning results.. Task 2: Structural Analysis. : Identification of strategic variables and classification. through the execution of the M I C M A C S O F T W A R E , based on answers given from experts in the field of robotics, artificial intelligence,. biomedical. solutions,. medical. science,. and. marketing.. Task 2.1: Interpretation, analysis and presentation of the results obtained.. Phase 3: Development of scenarios.. Task 1:. Scenarios. writing: Elaboration of three possible futures toward 2030. which reflect the possible environment that these products may have in Mexico in order to be accepted and incorporated in the daily life activities of the Mexican people.. 10.
(22) In the figure 5 are shown the inputs and outputs of this investigation in order to obtain relevant information in each of the phases mentioned before. Furthermore, the figure 5 shows the order in which this investigation follows each phase in order to achieve the final phase which is Scenarios writing.. Figure 5. Elaborated by the author. F o r e s i g h t D i a m o n d w h i c h m a p s t h e m e t h o d s c o n s i d e r e d as o u t p u t s a n d i n p u t s in t h i s i n v e s t i g a t i o n a n d by its c o r e t y p e o f k n o w l e d g e s o u r c e . ( G e o r g h i o u , C a s s i n g e n a , K e e n a n , M i l e s , & P o p p e r , 2 0 0 8 ). 11.
(23) 3. THEORETICAL FRAME The theoretical frame for this thesis was proposed in order to find out which information has to be selected and how the gathered information has to be analyzed. T h e following methods are taking from series of prospective and marketing tools that share a common objective which is the elaboration of scenarios at the end.. The concept of prospective studies emerged in France in the nineteen fifties. Their origin was caused due to the concerns about the elaboration of plans that would help to conceive a reconstruction for the country a s well as the industrial development. During this investigation several tendencies were taking into account, such as social aspects and economics.. The importance of prospective studies is the generation of feasible futures in order to make possible the establishment of values and rules of decision making which allow achieving the most desirable future. (Miklos, 2003). First of all, prospective studies are considered as a n act of imagination. Then a reflective process is taking place and finally all expectations, whishes, interests and society capacities will be summarized in order to obtain the most desirable time to come.. The most important objectives that prospective strategies have are the following ones: 1. Generate alternative visions of desirable futures. 2. Provide motivation to move people to an action. 3. Promote relevant information focused under a long term. 4. Elaborate alternative scenarios which represent possible futures. 5. Establish values and rules of decision making in order to obtain the desirable future.. Since the prospective is a collection of interests and expectations, several tools of market research were needed in order to understand the way Mexican people feel about having 12.
(24) these possible alternative technologies. Furthermore with the prospective side was possible to concentrate visions recovered from potential clients as well as expert's opinions.. Moreover, a theoretical frame was required in order to deeply analyze all the concepts and tendencies about technology focused on elderly. Finally, a timeline showed how all this technology started many years ago.. The following section shows each of the method applied in order to fulfill the project objectives.. 3.1 Scanning Scanning is sometimes called an exploration tool which is a helpful method in order to gather more detailed information related to the investigation. This information can be gathered using in different sources such as books, magazines, internet sites, reports, journals etc. (Georghiou, Cassingena, Keenan, Miles , & Popper, 2008). The scanning method contributes to find relevant concepts, declarations and facts etc. that help to determine a better understanding of the system being studied. This means that in your own eyes you can go into depth and picture the past and present of the system and then you can start designing the future, which is not yet written.. 3.2 Interviews Interviews are considered to be a qualitative, intense and open technique based on the conversation. The objective is to know values, attitudes and individual actions through a speech being carried on. (Georghiou, Cassingena, Keenan, Miles , & Popper, 2008). The qualitative interview provides a social lecture through the language reconstruction on which the interviewees express their thoughts, conscious and not couscous wishes and for that this makes it an invaluable technique for the social process analysis and identity formation. (Tarres, 2008) 13.
(25) Generally the results obtained are considered comprehensive; however it is not possible to generalize them for the entire population. The results are not quantitative but in exchange they provide richness and depth in aspects of individuals in the social, cultural and psychological field. (Tarres, 2008). There exist three types of interviews: T h e structured, semi-structured and not structured. Briefly, the structured are the closed interviews, the semi-structured are the interviews considered in the middle, they don't have a rigid order to follow but they do contain a guide of specific questions to be considered. Finally the not structured are the ones with no order and can be compared to a normal conversation. (Tarres, 2008). 3.3 Surveys Surveys are considered as a quantitative method through the collection of questions applied to a specific sample of the population. The sample has certain characteristics that make it eligible. This tool is applied in order to know the opinion, perception and feelings of people about determined facts. (Georghiou, Cassingena, Keenan, Miles , & Popper, 2008). At the end all answers from survey respondents can be analyzed trough frequencies which allow to create graphics and to apply an extrapolation of the results to the rest of the total target population.. 3.4 SWOT Analysis A SWOT analysis is considered a s a vital tool helping to analyze and consolidate the perceptions received from previous phases of the investigation, such as scanning, Interviews and surveys. With the S W O T analysis the author was able to join the Mexican perceptions of the products obtained from respondents and to do a classification of driven forces such a s opportunities, treats, strengths and weakness in the Mexican market.. 14.
(26) The S W O T analysis is an analytical tool that shows within their four quadrants the information of the studied system and its own environment. While studying the information, based on the scanning, interviews and surveys, the results make possible to obtain relevant ideas over the problem studied. The S W O T analysis enables a diagnostic of the actual situation. (Georghiou, Cassingena, Keenan, Miles , & Popper, 2008). 3.5 Structural analysis (MICMAC) The structural analysis is considered to be one of the most used tools in studies about the future and its development, besides the scenario method. This tool has been used since the late 1960's. J a y Forrester, who is considered as the creator of this method, applied the method in his works about models of industrial dynamics and the urban dynamics. (The Millennium Project, 2011). The purpose of this tool was the necessity of taking into account qualitative. and. quantitative variables at the s a m e time and therefore matrices and charts were developed. This technique was applied in cases of an iron and steel company and an air transport company among others. Since the middle of the 1980's the number of applications for this method increased in different domains, such as business and society-related topics. This tool has the objective to link up ideas. It allows having a description of the studied system through a matrix which links the elements (variables & factors) among them. By analyzing their relations, this method empathizes in the variables that are essential to the system's evolution. This means that the web of the elements found in the system represent the key of its dynamics. T h e structural analysis possesses three phases which are the following ones: 1. Inventory of variables/. factors. This phase is considered the most important one out of the three stages, because here are listed the joint of variables that characterized the system. In the present case, they will be Smart technologies products and their environment in the Mexican market. This means that internal and external variables are taken into account. In this phase it is highly 15.
(27) recommendable to have information obtained from interviews or simple conversations with people involved inside the system. At the end of this exercise, theoretically it is recommended to have a list no longer than 70 to 80 variables.. Furthermore variables explained in detail are highly recommended as well b e c a u s e this allows to homologue the language being used among the people involved in a survey or interview. This effect simplifies the analysis and the possible relations among variables.. 2. The description of relationships between variables.. What is pretended to achieve is the creation of the web between variables. This means under the s y s t e m ' s definition that a variable only exist because of its relation with the rest of the variables. In order to build this relation, this method makes use of a matrix with double entrance or direct relation.. In order to start building this relation it is necessary to begin with one question: Is there any direct influence to the relation between variable i over variable j? In case the answer is no, then it is written a 0 which means a null relation. In a contrary case if there is a direct relation you ask what type of relation does it has. Weak (1), moderate (2), strong (3), potential (4). A strong relation is used when the relation between two variables is considered to be significant; when the relation s e e m s to be in a medium level then it is qualified as moderate. If the relation is just a little almost irrelevant then it is qualified as weak. Finally when there is no relation then the influence is qualified as null. A potential relation is the one who does not exist in the present time but it may occur in the future.. The description of the relationships is done through letters which indicate which type of relation does the expert think should be between certain variables. However, each letter represents a numerical value once each relation is introduced in the M I C M A C software. In the following table are shown the numerical values for each letter.. 16.
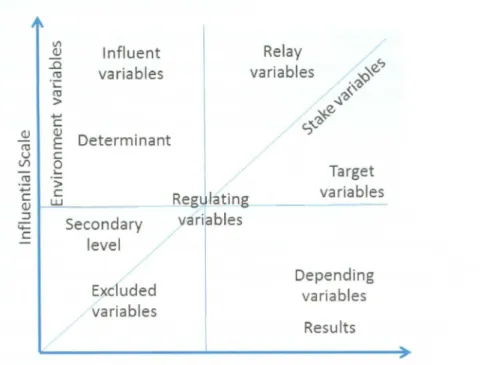
(28) Table 2. Scale for structural analysis. Source: Elaborated by the author based o n the d o c u m e n t Future Research M e t h o d o l o g y .. INFLUENCE. LETTER. NUMERIC VALUE. Null. N. 0. Weak. W. 1. Moderate. M. 2. Strong. S. 3. Potential. P. 4. 3. Identification of essential variables. This last stage is about the identification of essential variables which represent the key factors about global dynamics of the Smart Technologies products. This phase is developed through using M I C M A C software. It is required to introduce the numerical values of the influences given from the expert's opinions into the software.. (The. Millennium Project, 2011). Once all the numerical influences were introduced in the software, as a result a chart is projected which contains the variables that characterize the studied system. T h e position that the variables take inside the chart (see figure 6), let us determine categories for the variables. T h e s e variables can be classified as following:. 17.
(29) Figure 6. Influence x d e p e n d e n c e chart. S o u r c e : E l a b o r a t e d by t h e a u t h o r based on the Future Research M e t h o d o l o g y. •. Determinant dependent. or influent. variables:. They are all together very influent and little. (The Millennium Project, 2011). This means that most of the entire. system has a dependency on these variables located in the upper-left frame of the perception chart (see figure 6). Determinant or influent variables determine the system but the system can't control them. Therefore these type of variables act as an inertia points. •. Relay Variables:. T h e s e variables are very influent, very dependent are situated in. the north-east frame of the chart (see figure 6). Their nature is to be instable since any action on them has consequences on the other influent variables, like a boomerang effect which can either increase or decrease the initial impulse. It is necessary to distinguish inside their group (see figure 6): -Stake. variables. are located around the diagonal which will have an. opportunity to stimulate the interest of major actors, due to their unstable character these variables are considered as a potential fracture points. 18.
(30) -Target variables, which are situated under the diagonal on the middle-right site are considered to be more dependent than influent. They can represent objectives for the systems in its entireness instead being only consequences. •. Depending variables, or rather, result variables. These variables, located in the bottom right site of the chart are considered influent and very dependent at the s a m e time (see figure 6).They are sensitive to the evolution of influent variables and or relay variables. Therefore they are considered to be exit variables from the system.. •. Autonomous or excluded variables, which are little influent and little dependent at the s a m e time. T h e s e variables are located in the bottom left of the chart and almost do not appear on the line in the system. At this group of variables can be found (see figure 6): -Disconnected. variables which are situated near the axis's origin whose. evolution can be considered out of the systems dynamics. -Secondary. levers which have more influence rather than dependency.. -Variables concerned are located in the bottom-left frame, just above the diagonal, and can be used a s secondary acting variables or as application points for possible measures. (The Millennium Project, 2011). •. Regulating variables: T h e s e variables are situated in the center of the system (see figure 6). Therefore they can successively act now as secondary levers, a s weak objectives or a s secondary stakes. (The Millennium Project, 2011). 3.6 Scenarios The term scenario has its origins from the dramatic arts. In the theater environment a scenario refers to the outline of a play or to the summary or set of directions for the sequence of action. Herman Kahn is considered to be the father of scenarios for future research and policy analysis. Furthermore he introduced the term into the military planning and strategic studies in the 1950s. (The Millennium Project, 2011). 19.
(31) A scenario is a story that connects the present to the future through the cause-effect principle. Therefore a scenario illustrates key decisions, events and consequences through the narrative. Since we cannot predict the future precisely, most planners and futurist disagrees with the idea of only having a single picture of the future. Instead they argue that several sets of scenarios should be used within the planning. The purpose of doing scenarios is to explore, create, and test consistent and alternative future environments in order to encompass in a long vision the set of future conditions that may be facing the user. By knowing that, these scenarios can help to generate long-term policies, strategies, and plans which contribute to have the desired time to come.. Furthermore scenarios are used for innovation development because scenarios describe future life conditions and in specific fields of consumption scenarios are used to generate new product ideas.. Scenarios have been developed and utilized to categorize what is unknown and what should be known before taking decisions as well as to comprehend the importance of uncertainties. Moreover, scenarios shall illustrate what is possible and what is impossible as well as analyze what strategies could work within a range of possible scenarios. Furthermore, they help to convert the future in something more real for decision makers. Besides that, they force new thinking and decisions and help to learn how to be prepared for future risks and discover new opportunities. (The Millennium Project, 2011). There exist three phases in order to develop scenarios according to the Future group:. 1. Preparation: Define the scenario space. All starts with the definition of the domain of interest. By giving a clear statement of the domain analysis list of the key driving forces for the future domains. Define a large number of alternative futures is often neither necessary nor desirable. T h e final selection of futures will present a range of opportunities and challenges but should be small, in numbers four to five selections are considered ideal.. 20.
(32) 2. Development: At this point it is important to define the key measures. T h e s e measures are for example: economic growth, legislative, environment, technology diffusion and proliferation, capability or competitive etc. E a c h scenario will include projections with the same measures already selected. Moreover, it is necessary to define the events, which appear in each scenario. T h e events can build scenarios in order to change chains of causality that lead from present to the future. T h e probability for each event may change in every scenario. Depending on where these events are placed in the scenarios chart. Project the key measures, this projection can be done through a Trend Impact Analysis. This helps to project each measure through using time series (numerical historical data). In this project this won't be necessary since the key measures are related to qualitative data.. Preparation" of descriptions, at this point many chains of causality may become apparent and this is when a narrative is required in order to describe the behavior seen over the time through future possible events.. 3. Reporting and utilization: The best documentation for scenarios is based on charts and narratives describing future possible histories which are represented by each scenario. It is recommended to write a top-line summary which helps giving readers a quick view of what is going to be seen in each scenario. It is recommendable to show a contrast between the alternative worlds being generated and how the proposed strategies may differ from one scenario to another due to different circumstances.. 21.
(33) 4. PROJECT IMPLEMENTATION AND ANALYSIS OF RESULTS In this section is shown how e a c h method was designed and implemented in this investigation a s well a s the results obtained from each of them.. 4.1 Scanning In prospective studies it is substantial to begin studying the state of the art of the system that is investigated in order to obtain insight about it. Therefore a use of the scanning method was helpful to have a general overview of what is happening worldwide around smart technologies focused on aging. T h e following analysis will begin from the point of origin where everything started.. 4.1.1 History of the robot industry. According to. the. Robot. Institute of America (1979). a. robot. is defined. as: "A. reprogrammable, multifunctional manipulator designed to move material, parts, tools, or specialized devices through various programmed motions for the performance of a variety of tasks" (Robotics Research Group The University of Texas at Austin, 2012).. The history of the robotic industry begun in 1962 when the first commercial robot was deployed and the robotic industry got developed in various areas such as in the industry sector, for military operations, for surgical applications a s well as for the domestic use. Going back in time in history the concept of robotics was found in the early 1500 by Hans Bullman. (Mann, 2005). However according to Oxford English Dictionary the robot term. was introduced and made popular by one of the most famous writers of C z e c h language in 20th century, his name was Karel Capek. He used the word robot in his play R . U . R (Rossum's Universal Robots) in 1920. Karel sent a letter to the Oxford English Dictionary in which he named Josef Capek, his brother, as the original inventor of this term because he said he got the idea from him (Oxford English Dictionary, 2012).. There exist evidences that Hans Bullman designed in the early 16th century an android that simulated people playing an instrument. ( B B C N E W S , 2001). Later on in 1737 22.
(34) Jacques V a u c a n s o n created a robot that can play an instrument and a mechanical duck that could eat, drink and paddle in the water (Mann, 2005).. In 1942 Isaac A s i m o v coined the term "robotics" in a science fiction short story called "Roundaround" in which he introduced the three laws of robotic:. 1) A robot may not injure a human being or through inaction, allow a human being to c o m e to harm 2) A robot must obey the orders giving it by human beings; except where such orders would conflict with the first law. 3) A robot must protect its own existing a s long as such protect does not conflict with First and S e c o n d Law (Mann, 2005). Now as technology advances, developers and researches started to study social issues in robot design with sensing systems and new elaborate independent decision making abilities. (Mann, 2005). O n e of the reasons why we don't have many personal service. robots in the present is due to changing environments in which personal robots must operate and this is only possible through the robust sensors, software and computer power (Mann, 2005). However industrial robotic is expanding rapidly because of their fixed environment on which they operate every day and the same that happened to industrial robots is expected to happen to smart technology devices (Mann, 2005).. 4.1.2 Leading countries in the field of robotics According to information obtained from the International Federation of Robotics, the leading countries on robotics in 2003 were Japan, Germany, Republic of Korea and Italy. (IFA, 2003), as shown in figure 7.. 23.
(35) Figure 7. Leading countries in the field of robotics Source: (United Nations E c o n o m i c C o m m i s s i o n for Europe, 2004). This tendency s e e m s to remain constant because in 2011 J a p a n announced its plan to install a million industrial robots by 2025. The current market volume is about U S D 6.7 billion and will increase to U S D 67 billion in 2025. (Halal & W o n g , 2011). In 2002, already 18.5% of the J a p a n e s e population was 65 and older; this percentage is expected to increase to 28.7% until 2025. Therefore J a p a n is exploring many options to help control both the shrinking work force and the expansion of the elder population such as amending immigration policies in order to allow more foreign workers as well as the investment in humanoid-companion robot to improve the human care for the elderly population. J a p a n has an extraordinary investment in robotics which is noticed by the abundance of robotic devices that are being developed and marketed (Mann, 2005).. Considering those facts it is important to mention J a p a n ' s companies that have already been working with robotic devices in their daily business such as Matsushita Electrics Robotic Bear, Mitsubishi's household robot, S o n y entertainment robot dog and Honda's humanoid assistant robot (Mann, 2005).. 24.
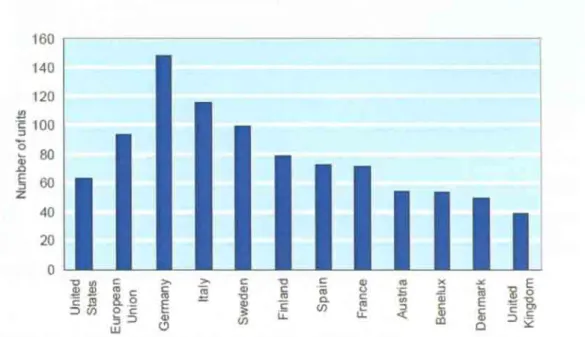
(36) South Korea planned to deploy robotic teachers in 8000 preschools and kinder gardens by 2013. The U S military spent over $831 million on robots in 2009* which is anticipating to be $9.7 billion by 2016.. (Halal & W o n g , 2011). Koreans introduced E v e r l a female android robot with silicon skin that feels humans, a face that interprets. emotions. (Korean Institute for. industrial. Technology, K I T E C H ) . The Ever 1 is developed to provide. information. in. department. stores. and. museums or read stories to children capable for education and entertainment as seeing in figure 8.. F i g u r e 8. " E v e r l " a K o r e a n w o m a n android Source: http://www.technovelgy.com/ct. In Germany the Institute Fraunhofer developed a "Care-o-bot",. a. home. robot. that. sees. in. three. dimensions, it has a hand with three fingers and an arm with 7 degrees of freedom. Nitta Corp is developing a 5 fingered robot hand and U S C is developing a robot building machine that lays concrete walls as programmed, eventually constructing an entire building. Ecobot has been developed to power itself by caching houseflies for energy.. In England some of the advancements done from Gordon's University are the evolved and more sophisticated brains. In the United States, the MIT has developed a "Mind reader", a system for analyzing facial patterns into basis emotions of fear, happiness, anger etc. (Mann, 2005). There exist two types of robotics: The ones for service and the ones for manufacturing (IFA, 2003). According to the United Nations Economic Commission, the European robots are mainly used in two fields: Manufacturing and motor vehicle production. But there exists a considerable difference between the numbers of robots used in each field. S e e figure 9 (United Nations E c o n o m i c Commission for Europe, 2004).. 25.
(37) Figure 9. N u m b e r of robots per 10,000 persons e m p l o y e d in the manufacturing industry in 2003.. In this figure it is possible to s e e the principal countries that incorporate robots in their productions lines which are Germany, Italy, S w e d e n , Spain etc. For example in Spain the welding and plastic molding is the principal application area for robotics. (United Nations Economic C o m m i s s i o n for Europe, 2004).. The motor vehicle industry is the largest user of robots followed by the second largest branch which is chemical and the metal products industry. Furthermore, other countries stand out (see figure 10), just a s J a p a n , Italy, Germany and France. (United Nations. Economic C o m m i s s i o n for Europe, 2004).. 26.
(38) A survey named World Robotics 2000 conducted by the United Nations Economic Commission for Europe ( U N E C E ) in cooperation with the International Federation of Robotics (IFR) provided the following information: In the year 2003 the total quantity of robots that were used in the industry sector was 742,500 robots worldwide. The major quantity is attributed to J a p a n which owns 402,000. T h e second largest user are the United States with 92,900 followed by Germany with 81,200, Italy with 35,000 and Republic of Korea with 33,700. This quantity grew over the following three years and according to the U N E C E the worldwide quantity was 862,000 in 2006 whereupon each prior mentioned country maintained the s a m e place.. In compliance with the information from the U N E C E , the mayor evolutionary progress took place between 1998 and 1999 when the world market for industrial robots grew by 15% and which w a s principally caused due to the skyrocketing sales increase in the United States with 3 8 % , in the European Union with 16%, in Japan with a moderate 5%, and the Republic of Korea with an extraordinary market growth of about 70%.. Probably the reader of this thesis may ask itself the s a m e the author did: Why do these countries invest in robots?. According to the U N E C E the growth in robot investment is. based on the fast price decrease of robots and the tremendous improvements done of the robotic performance which opens a whole range of new possible applications. Just to visualize this effect, an average robot sold in 1999 would have cost only 2 0 % of what a robot would have cost in 1990.. The installation of robots is a long-term investment which initially requires mayor financial effort, however, these investments will also generate long-term profits and when another economic crisis takes place, those investments might help to compensate the consequences of economic depressions, especially in the automotive industry. The. competitiveness of robot users can be greatly enhanced. The increase of. manufacturing productivity recorded in many countries for the last years is because of a. 27.
(39) higher share of investments in robotics, IT, and other intelligent use of production factors.. The number of robots for manufacturing has a constant increase per employee as shown in the following figure 11.. Figure 11 Robots used per 10,000 e m p l o y e e s (UNECE, 2000). In the manufacturing industry the automotive sector is the one who covers the mayor number of robots per employee according to U N E C E . For the automotive production in Japan there is one robot for every 6 production workers. For all other above mentioned countries, the relation is the following: Italy 1/13, Germany 1/14, and the U.S. with 1/16.. This information gives us a general overview about the manufacturing industry. T h e development of the service robot sector can be described a s follows: The records from the U N E C E stipulate that at the end of 1999 there w a s a minimum quantity of 6,600 units of service robots. From this quantity 5 0 % will be for domestic functions, 1 4 % underwater robots, 1 2 % medical robots, 6% cleaning robots and all other types of robots sum in total 2 3 % .. 28.
(40) In 2000-2003 the overall market for domestic robots was forecasted to be more than 300,000 units which lead to the beginning of a new age of the service robot market. O n this market it is forecasted that small robots at reasonable prices are entering a large number of houses a s a domestic support. After this general overview about the robotic industry, its key facts and distinctions, at this step it is necessary to point out, that this investigation will only focus on service robots providing assistance for humans.. 4.1.3 Technology tendencies for service robots One of the principle ideas presented in the Smart Robots Report by Dr. William E. Halal and A n n W o n g is that Smart Robots are expected to create a new era of affordable and convenient robotic helpers which will be possible due to computer power,. artificial. intelligence and enabling technologies.. When is expected to have this technology available? This question has been investigated by 130 experts around the world that form part of the TechCast Organization. This Organization is a Virtual Think Tank of Technology Revolution created by. Professor. William E. Halal and his associates at the George Washington University and the George Mason University. The team of experts concluded that by 2027 the world is expected to have in IT and Artificial Intelligence powerful technical capabilities with 6 0 % of probability (Halal & Marien, 2011).. According to the Smart Robots Report by William E. Hallal (2011), today in the U S there are 5 workers for every senior citizen and by 2020 the ratio will decrease to 3 for 1. In the case of J a p a n this situation is even worse; there will be only 2 workers for 1 senior citizen.. Hans Moravec, a robotic researcher from the Carnegie Mellon University, thinks that robots can learn to make decision by 2020. And by 2025 it is expected to have a bigger market volume for robots than for the automotive industry, with a possible global volume of about U S D 15 billion (Halal & W o n g , 2011).. 29.
(41) 4.1.4 P o t e n t i a l a p p l i c a t i o n s f o r r o b o t s Because of their benefits, the robots' potential use will be concentrated in the following areas:. Industry: Although 1.3 million dumb robots are already working in factories, the new equipment is expected to have intelligent agents inside. For instance, the R2 (a robot developed by N A S A ) will help G M build more sophisticated and safer cars, and Toyota is introducing smart robots to do complex tasks. Toyota expects to replace all production workers with robots, reducing costs to match the competition from China.. Health care: The sector is gearing up to have robots care for millions of patients being able to take temperatures, draw blood, plug a personal role as companions for elderly, providing comfort reminding them to take medication and altering authorities if needed. In Japan 1,000 .robotic baby seals are in use at hospitals, nursing homes, and families. Robot makers see huge needs because of aging societies and the shortage of caregivers.. Military: Various types of robotic weapons are being developed by 56 nations the most important development after the atomic bomb. The U.S. now has 7,000. unmanned. aircrafts and at least 10,000 ground vehicles and robot soldiers are coming; 3 0 % of all military vehicles will soon be unmanned. One example is the B E A R Battled Extraction Assist Robot.. Entertainment:. A South Korean performing robot, E v e R -. 3, was developed by the Korean Institute of. Industrial. Technology, and starred in various dramas that attracted a high number of spectators. It can simulate a total of 16 facial. expressions. without. ever. forgetting. lines.. S e e figure 12.. Figure 12 Ever3 a South Korean performing robot S o u r c e : P h o t o t a k e n f r o m a p e r f o r m i n g in a K o r e a n m u s i c a l in S e o u l o n F e b r u a r y 18, 2009. http://www.boston.com/bigpicture/2010/03/robots_part_iii.html. 30.
(42) Toys: T h e s e are the types of robotic products that are now available in the market like Aibo, the robot dog. Furthermore, Playmate Corp. is introducing "Amazing A m a n d a " , a doll that talks and interacts in a child-like manner. Besides that, Parrot Corp. is bringing out the AR.Drone, a W i - F i helicopter with dual cameras and augmented-reality video streaming that can be controlled by iPhone or iPod Touch.. Household:. KIST ( K O R E A N. INSTITUTE O F S C I E N C I E A N D T E C H N O L O G Y ). has. developed a housemaid robot Mahru2 that turns on the microwave, ovens, washings machines and toasters. Moreover Twendy (made in Japan) is a result of 10 years of research by W a s e d University and is intended to be a practical model for release by 2015.. Another example is a robot named "Robovie-H". It was developed by the J a p a n e s e robotics research institution A T R . It helps during the shopping moving across the store. The robot greets the shopper at the entrance of the store, follows him to the shelves while holding a grocery basket and helps reminding the shopper which are the items on a shopping list that were introduce beforehand by the client in a specialized mobile device as shown in figure 13.. 31.
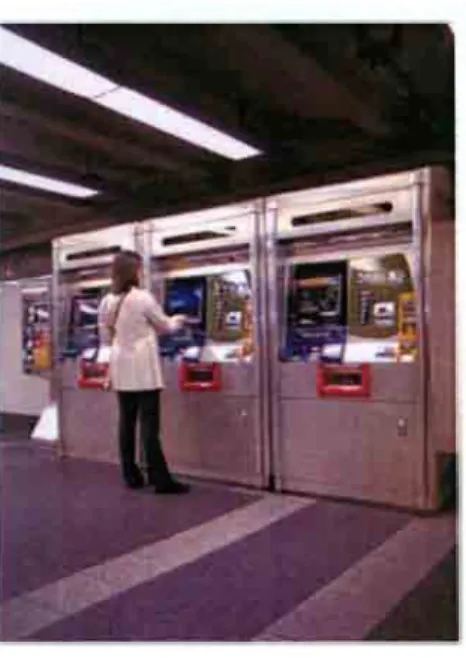
(43) Space: J a p a n announced plans to build a $2.2 billion Moon Base operated by robots by 2020. N A S A and G M have built the first space android (robot) called Robonaut2 (R2) that will assist astronauts, see figure 14.. Hazardous:. N A S A , the U.S. Navy and university researchers demonstrated the first robotic. underwater vehicle powered entirely by temperature differences in the ocean. Furthermore robots are useful to handle explosives, work in tunnels, find and repair leaks in d e e p - s e a oil wells and to secure caves in Iraq and Afghanistan.. Farming:. Vision Robotics designed a robot, Snippy, to cut back 400 acres of grapevines. per s e a s o n , at around half the cost of manual labor. Farmers associations in California are investing millions of dollars to develop a robotic fruit picker. MIT has developed a gardener robot that can water plants and use an arm to pick fruits. Denmark has developed a robot that locates and destroys weeds, eliminating the use of herbicides.. 4.1.5 O b s t a c l e s c o n s i d e r e d for this t y p e of t e c h n o l o g y There are obstacles being considered in this type of technology. For example: High sophisticated robots. technology. required. acute. is necessary because sensory. devices,. smart speech. recognition, navigation and artificial intelligence systems that are yet beyond of the state of the art (Halal & W o n g , 2011). Furthermore. human machine communication. is. complex. Due to natural give and take communication with people, robots have to understand and developed complex accurate facial clues.. In order to sensitize people about how a communication with a machine is becoming more frequent, recent events have been taking place such as artistic expositions in Figure 15 Figure 16 A M o M A s exposition " T a l k to me" S o u r c e : http://www.moma.org/visit/ calendar/exhibitions/1080. 32.
(44) MoMA, a M u s e u m of Modern Arts placed in New York, presented from July 24 to November 7 of 2011, this exhibition was called "Talk to me". The author exhibited 194 compilations ranging from video games over robot toys to a robot city metro card machine, see figure 15. Antonielle, the author, says that "it is no longer just a relationship with an object, it is a dialog" (The Museum of Modern Art, 2011).. Some people are concerned about the danger posed by robots against human beings, and that they can create unemployment. One author thinks humanoid robots will replace jobs in areas such as fast-food service, housecleaning and retail. (Halal & W o n g , 2011).. In figure 16 is presented a cash guard machine used in a German supermarket where the cashier man-is excluded from one step of the process. The clients put their items on the band as shown on the right side of the photo. Then the machine summarizes the. final. account. and. clients. are. required to introduce their 5, 10, 20 and 50 bill in the area showed on the left side of the photo. Finally, the cash guard gives the change and shopping is finished as shown in figure 16. Figure 16 A u t o m a t i c Cash box in a G e r m a n s u p e r m a r k e t Source: A u t h o r ' s p e r s o n a l p i c t u r e t a k e n in 2 0 1 0 .. The last possible threat considered are moral and ethical conflicts Robots can pose. If a war robot kills innocent people due to a software glitch, who will be the responsible- the software developer or the faulty robot? (Halal & W o n g , 2011; Halal & W o n g , 2011; Halal & Wong, 2011).. 33.
(45) 4.1.6 Technology developments focused on elderly people. The Administration of Aging in the United States of America reported in year 2000 that 41.9% of non-institutionalized Americans with 65 years and more present a type of disability. T h e most frequent disability with 28.6% among elder Americans relates to mobility and movement a s substantial limitation in walking, climbing stairs etc.. (Mann,. 2005). Therefore, there are developments underway for the next generation of assistive technology to support independence in almost all the daily life activities. Before advertising this type of technology, it is important to consider the consumer perspective on Assistive Technology with high- technology devices. The following mental map shown in figure 17 explains briefly the areas in which smart devices are being developed.. 34.
(46) F i g u r e 17 M e n t a l map about devices for elderly people . E l a b o r a t e d by t h e a u t h o r u s i n g t h e C m a p T o o l s s o f t w a r e. 35.
(47) 4.1.7 Socio Cultural analogy: A comparative analysis between Mexican and Japan. In the present investigation one vital fact to consider is the cultural impact on business. This relates to the understanding of the similarities and differences between the Mexican culture and J a p a n e s e one. T h e s e prototypes come from Japan; therefore these products respond to the needs that J a p a n e s e have and also to their cultural ideology regarding high technological devices for mobility which is different from the Mexican one.. In order to have a cultural comparative analysis between Mexico and Japan, the consulted author the Dutch anthropologist Geert Hofstede investigates the relation between national cultures. Hofstede has developed five national cultural dimensions in more than 70 countries in order to identify the cultural patterns of each society.. The scales used to evaluate each dimension are 6 starting from 1-20 up to 101-120 in blocks of twenty and e a c h dimension is measured in high level or low level (see table 3).. T a b l e 3. Hofstede's scale. Elaborated b y the author. (Hofstede, G , 2001). 1-20. 21-40. 41-60. 61-80. 81-100. 101-120. The following example shows how the scale works. One of the Hofstede dimensions evaluates Masculinity vs. Feminism in countries. Therefore, in this dimension Mexico obtained 69 out of 120; this means Mexico has a high level of Masculinity.. The five dimensions studied by Hofstede are:. >. Power distance: It represents inequality defined from the less powerful members from a society, organizations and institutions and the powerful ones. It suggests that a society's level of inequality is approved by the followers a s much as by the leaders. Example: Germany obtained a 35 on the Power of distance scale and this is because Germany does not have a large gap between the wealthiest and the poorest. Besides that they believe in equality of each citizen (Hofstede, G , 2001).. 36.
(48) >. Individualism vs. collectivism:. It measures the degree to which individuals are. integrated in groups such a s the collectivist side. S o m e societies are integrated into strong cohesive groups and often extended families. However there are societies that prefer the individualist side where relations between individuals are loose because people stress on personal achievements and individual rights. A typical example of an individual country is G e r m a n y with a relative high score on individualism (67) where people tend to have more loose relationships than countries where exists a high collectivism such a s Guatemala (The sixth on the scale) where people have large extended families (Hofstede, G , 2001).. >. Masculinity vs. feminism: It refers to the distribution of roles where masculine values include assertiveness, material success, self-centeredness, power, strength,. and. individual achievements. In contrast the feminism values are the modest ones. Besides that, the focus is on the occupation of jobs, which for men are traditionally areas like engineering. A n example is Japan considered by Hofstede as the most masculine and Sweden a s the most feminine one (Hofstede, G , 2001).. >. Uncertainty avoidance: It refers to society's tolerance for uncertainty and ambiguity. This point describes how members of certain culture tend to feel either uncomfortable or comfortable. in unknown, surprising situations. S o m e cultures try to reduce the. possibility of such situations trough security measures. A typical example of this dimension is Germany with a high uncertainty avoidance (65) compared to Singapore with a position of 8. G e r m a n s don't like to take risks and that is why they plan everything carefully (Hofstede, 2001).. >. Long-term orientation vs. short-term orientation: The purpose of this indicator is to distinguish the difference in thinking between the East and West. This dimension was developed in China to understand the influence of the confusion teaching on the east. Long term orientation refers to persistence, ordering relationships by status and sense of shame. However short term orientation describes personal steadiness and stability,. 37.
(49) protecting your face, respect tradition, reciprocation of greetings, favors etc. (Hofstede, G , 2001).. Hofstede's evaluation of Mexico and Japan The following overview (table 4) shows the final results obtained from professor Hofstede for each dimension evaluated for Mexico and J a p a n . This table includes each evaluation and a briefly explanation. Furthermore figure 18 shows a comparative chart. Table 4. H o f s t e d e ' s evaluation of M e x i c o and Japan, Elaborated by the author (Hofstede, G ,. 2001). 38.
(50) According. to. the. information. revealed. by Professor. Hofstede; the two dimensions, where Japan and Mexico seem. to. be. close,. are. uncertainty. individuals vs. collectivism (see. avoidance. in table. 4 the. and two. dimensions in bold). W h y is this relevant? B e c a u s e this dimensions let us know the level of commitment that an individual might have to a member group such as his family. Besides that, the uncertainty avoidance shows that Japan. is focusing. on. the. technology. for. tomorrow. because in its culture the uncertainty is not well received. The same applies for Mexico because Mexicans do not Figure 18 The 5D of professor Geert Hofstede. •(Hofstede, G , 2001) Source:. http://geert-hofstede.com/mexico.html. accept change very easily and are very risk adverse. This additional information helps to analyze the perception of this. new. technology. by. Mexican people.. One of the principal differences between both countries is the power of distance. In J a p a n does not exist a high level of inequalities among its population, however, Mexico has a high level of inequality of power and wealth within the society. This makes a difference when talking about life quality of citizens in Mexico. Not every member of the population might have a c c e s s to the same opportunities such as education, livelihood, employment, health services etc. This last dimension points out why this type of technology won't be accessible for all Mexicans.. The following table 5 shows a comparison between J a p a n and Mexico regarding relevant economic and demographic key figures:. 39.
(51) T a b l e 5 Economic variables comparison b e t w e e n M e x i c o a n d Japan. Elaborated by the a u t h o r .. Economic & demographic variables Total population Income per capita % of people with 65 years and over % of people with physical or mental disability.. Mexico. Japan. 112.3 million (INEGI, 2010) $9,123 dollar (The World Bank, 2012) 10.1% (INEGI, 2010) 5.1% Motor disability 58.3% (INEGI, 2010). 126,475,664 million (Index Mundi, 2011) $42,831 dollars (The World Bank, 2012) 22.9% (DINF, 2009) 4.3% Motor disability 5 6 . 5 % (DINF, 2009). The information illustrates that Japan has a significantly higher income per resident. This means that, despite of a similar population, the Japanese market for smart technology devices might be larger since there are more potential clients that are able to acquire these costintensive products.. Furthermore, already today there might be a significantly higher demand of smart technology devices since J a p a n doubles the percentage of people within 65 years and older. However, there are common characteristics among both countries which are the very similar percentage of people with physical or mental disability as well as the most frequent disability (motor disability) which is slightly above 5 0 % in both countries.. A national value survey applied in Mexico talks about what unifies and splits Mexicans; what are the Mexican values, worries and aspirations. This survey was elaborated by Banamex and Fundacion de Este P a i s (Banamex, 2010). The purpose is to demonstrate that the values nature that predominates in each society can help to explain a lot of its potential and development.. When people were asked about what will be the principal objective for Mexico in the next 10 years, the answer was that 5 6 % considered a strong economy that offers jobs and good salaries. T h e second most important objective with 3 1 % was a social security system that guarantees a health services for everybody (Abitia, 1989). 40.
(52) Taking in to account the expert knowledge of Hofstede gathered in 2001, it is important to mention the discrepancy between the results being analyzed in the National Value Survey which s a y s that 7 3 % of the Mexicans interviewed considered that Mexicans in general tend to work alone for they own benefit and the 2 6 % said that Mexican tend to work un groups. (Banamex, 2010) This creates a question mark in order to understand why Hofstede evaluates Mexico with a high collectivism culture at Position 30 (Hofstede, G , 2001).. Furthermore the biggest proud that Mexican have is to be a Mexican and the second one refers to Mexican customs and traditions (Banamex, 2010). Moreover for Mexicans the principal reason of being successful (61%) is due to its own effort and dedication and 2 7 % think that the principal reason is their family (Banamex, 2010).. Related to s o m e changes in life that might come true in a near future, Mexicans were required to determine whether the change is good or bad. The first change is related to more emphasis of development of technology (80%) (Banamex, 2010). The 8 1 % of Mexicans said that is not possible to trust people with blind eyes and this is probably a consequence of the violence and crime rate that have increased in the country. (Banamex, 2010). 66% of Mexicans s e e this a s a problem that can only be solved when everyone participates with effort and sacrifice. High socioeconomic levels are the one who share more this idea compared to the low socio economic levels (Abitia, 1989).. Family is being defined a s an indispensable institution for the development of humans being. Furthermore it constitutes a social unity of big cohesion and solidarity on which a lot of necesseties and objectives can be satisfied. Family is the center of a social system that is why one receives feedback form the other. (Abitia, 1989). Nowadays familiy has been presenting. some changes particularly in the role of women, their activities tend to be more specific as well as specialized in order to achieve more equality, dignity and freedom in areas such a s politics and emoloyment. (Abitia, 1989). 41.
(53) W h e n talking about the culture 5 2 % of the Mexicans prefer the secure way and 2 3 % like to take risks. In general the Mexican population considers itself a s conservative in a average of 6.4 points where scale 1 refers to liberal and 10 refers to conservative. (Banamex, 2010).. Moreover, 4 5 % of the interviewed people said that they like to live more than 80 years and 2 8 % like to live until the age of 71 to 80 years (Banamex, 2010).. All this information is relevant to identify conduct pattern values, which allow determining differences and similarities between individuals, groups, cultures and nations. Every election is determined by personal interest or due necessity perceptions and community requirements.. 4.1.8 Maslow and the theory of dynamic motivation. W h e n referring to personal necessities, Maslow's theory contributes to understand why individuals act in order to satisfy their needs. Furthermore it helps to understand the values of dynamic in terms of socio-economic-cultural variables and the level of satisfaction or dissatisfaction obtained of the necessities associated in the different levels (Abitia, 1989).. The assumptions of Dynamic motivation of Maslow 1. Motivation is a n individual process, in which necessities have an influence over perceptions, values, attitudes and conduct (Abitia, 1989). 2. The necessities that explain human motivations present a hierarchy order; the more intense are the lower ones, s e e figure 19 (Abitia, 1989). 3. W h e n a necessities group is satisfied, it stops motivating and the individual will try to satisfy the next level always in ascent order (Abitia, 1989).. 42.
(54) 4.1.9 W h a t are the M e x i c a n health n e c e s s i t i e s a n d h o w to a d o p t s m a r t products to t h o s e n e e d s ?. technology. In Mexico the total number of population is 112.3 million from which 5,739, 270 persons (51% female,49% male) have a physical or mental difficulty to develop daily life activities (INEGI, 2010). Considering this information it is important to reveal how many people per age group have incidences in this category. In figure 20 the analysis showed that 40.7% belongs to people in the age of 60-84. The second group has 32.8% which represents people in the age of 30-59 years s e e figure 20 (INEGI, 2010).. 43.
(55) In figure 21 regarding the most frequent types of disabilities, statistics show that more than the half of the declared limitations referred to mobility which represents 58.3%. The most common c a u s e of having mobility problems is due to natural diseases which have the highest frequency. The second reason is due to aging followed by the third one which is accidents (INEGI, 2010).. Figure 20 Elaborated by the a u t h o r . (INEGI, 2010). Figure 21 Percentage distribution of p o p u l a t i o n with disabilities per disability t y p e . Elaborated by the a u t h o r . (INEGI, 2010). 4.2 S u r v e y a n d interview results All the information recovered until this moment of the investigation came from many secondary sources. However, for transparent research results it was necessary to obtain firsthand information which is why the author applied surveys and interviews.. 44.
Figure


+7


Documento similar
K) is the Banach space of continuous functions from Vq to K , equipped with the supremum norm.. be a finite or infinite sequence of elements
Government policy varies between nations and this guidance sets out the need for balanced decision-making about ways of working, and the ongoing safety considerations
No obstante, como esta enfermedad afecta a cada persona de manera diferente, no todas las opciones de cuidado y tratamiento pueden ser apropiadas para cada individuo.. La forma
The expansionary monetary policy measures have had a negative impact on net interest margins both via the reduction in interest rates and –less powerfully- the flattening of the
Jointly estimate this entry game with several outcome equations (fees/rates, credit limits) for bank accounts, credit cards and lines of credit. Use simulation methods to
In our sample, 2890 deals were issued by less reputable underwriters (i.e. a weighted syndication underwriting reputation share below the share of the 7 th largest underwriter
The program is based on the following pillars: (a) students become the main agents of their learning by constructing their own knowledge; (b) the teacher must be the guide to
Finally, experiments with solar [17–34], atmospheric [35–45], reactor [46–50], and long-baseline accelerator [51–59] neutrinos indicate that neutrino flavor change through
