TítuloChronic neural adaptation induced by long term resistance training in humans
9
0
0
Texto completo
(2) interosseous after 4 weeks of RT for the index finger abductor (Carroll et al. 2002) and for the biceps brachii (BB; Jensen et al. 2005). These studies have reported absence of corticospinal changes suggesting changes in the functional properties of the spinal cord (Carroll et al. 2002) and questioning the neural adaptation in relation to RT (Jensen et al. 2005). However, it is still not clear whether there is a cumulative or sustained neural adaptation to RT, implying a role for CNS beyond the initial periods of training, or whether this adaptation is only temporary. The purpose of the present study was to examine whether the magnitude of the BB responses to TMS during background muscle activation differs between a RT group, which has been training for more than 2 years, and a non-training (NT) group that has never participated in RT. We speculated that the longterm practices of RT might induce changes in the CNS resulting in a different response to TMS at several forces of background muscle activation, in comparison with subjects who have not been training. Methods Subjects Ten young males [mean age 19 ± (S.D) 3 years] composed the NT group and ten other males the RT group (mean age 20±4 years). A questionnaire was given to each participating subject to determine his or her level of physical activity. None of the subjects in the NT group had previously participated in systematic RT, and their daily activity (work, hobbies) did not include any kind of strong muscle contraction. The subjects of the RT group had more than 2 years experience in RT, such as body-building. Body-building is a sport discipline in which the subjects train their muscles by lifting weight. All of the subjects of the RT group performed four sessions a week; each session is one-and-half-hour long. In these four sessions they train muscles of trunk, legs and arms. The range of the intensity and repetition used in each exercise was 60–95% and 14 - 2, respectively. The number of series for each muscle was between 6 and 12. Two days before the experimental session all subjects in RT group stopped their routine training. All subjects gave informed consent before participation in the study. The ethic committee of Universty of A Coruña, Spain, approved the experimental procedures. Mechanical recordings Subjects were seated in a chair facing an oscilloscope, with the dominant arm comfortably supported, the forearm in a supine position with the wrists placed in a wrist cuff designed for the study that was connected to a force transducer (Muscle Lab Bosco System PFMA 3010e, Ergotest Technology a.s. Norway). The elbow was flexed at ~90° and remained constant throughout each experimental session. The shoulders and torso were securely clamped to the back of the chair. During the experiment, subjects pushed upward against the wrist cuff to generate isometric elbow flexion force. The force signal was displayed on the oscilloscope and recorded on a personal computer. Transcranial magnetic stimulation Bipolar electromyographic (EMG) recordings from biceps and triceps of both arms were obtained from pairs of disposable surface electrodes placed over the bellies of the muscle. The diameter of each electrode was 1 cm and the distance between two electrodes within a pair was 3 cm. The EMG signals were amplified, high-pass filtered at 50 Hz and low-pass filtered at 500 Hz. Motor-evoked potentials (MEPs) were elicited via a MagStim Rapid system (The MagStim Company Ltd, UK) with a figure of eight coil (diameter of each loop 90 mm). For TMS, the stimulating coil was oriented so that the axis of intersection between the two loops was placed tangentially to the scalp with the handle pointing backward and laterally at approximately 45° away from the midline to induce posterior to anterior current flow across the primary motor cortex. The stimulator intensity was defined in relation to the active motor threshold (AMT) as the minimum single pulse intensity required to produce an MEP greater than 200 μV on more than five out of ten trials from the contralateral BB while the subject was maintaining a voluntary contraction of 10% of maximum using visual feedback. The BB hot spot was established through a mapping procedure using a cap with a coordinate system marked on it and marked with a blue wax pencil by drawing a semilunar line following the anterior bifurcation of the coil and a straight line indicating the orientation of the coil handle. This procedure was used to minimize the error in the coil position during the experiment. The intensity used varied from 38 to 46% of stimulator output and there was no significant difference between groups in this parameter..
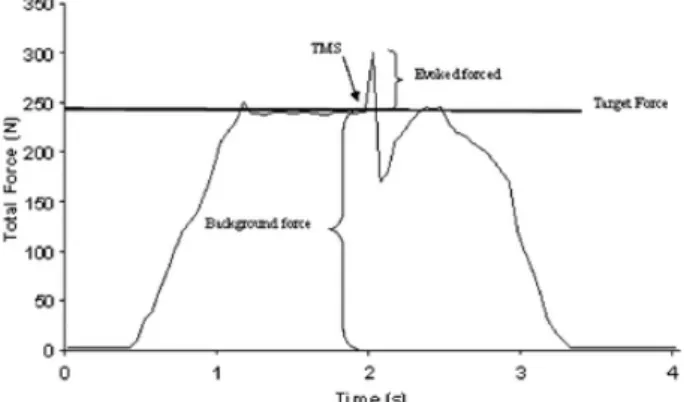
(3) Experimental protocol Each experimental session began with a warm up procedure consisting of several movements of flexion and extension of the elbow with light resistance (free weight). To familiarize the subjects with the protocol several trials in which the subjects were asked to keep an isometric contraction for 5 s at low intensity were conducted. The subjects then performed three trials of MVC with the elbow flexor and extensor muscles. The subjects could observe their performance on an oscilloscope and were exhorted to maximize the force during each MVC trial. Subjects were given a rest period of 3 min between each MVC. For the elbow flexor muscles the maximal force exerted by the subject during these three trials was used as the MVC force for the remainder of the experimental session. Voluntary isometric contractions were performed with the elbow flexor muscles at nine target force levels: 10, 20, 30, 40, 50, 60, 70, 80 and 90% of MVC. For each trial, the target force and the force exerted by the subject were displayed on a digital oscilloscope. The subject was required to match the exerted force with the target force and maintain a steady force for 2–3 s. When the force stabilized at the target level, the experimenter applied stimulation at intensity of 100% stimulator output unexpectedly. At all times, the coil was handled by one experimenter trying to keep the coil in the same position throughout the trials. The intensity of stimulus remained constant throughout the protocol. The subjects performed two trials of each target force in the following order, 10-90-20-80-30-70-40-60-50%, with 3 min rest between trails to avoid fatigue. All trials that displayed EMG activity in the opposite limb were excluded from further analysis. Data analysis Evoked force The TMS stimulus induces an increase in the background force followed by a transient reduction. The differentia between the total force induced by TMS and the mean peak force during the 50 ms before the TMS stimulus was used to quantify the evoked force (Fig. 1). The evoked force by the magnetic stimulation was identified and measured off-line with the oscilloscope cursors and with the digital software of the force transducer (Muscle Lab Bosco System). To facilitate comparisons between the different levels of muscle contraction (target force) and between groups (NT vs RT) the evoked force was normalized to the MVC performed (normalized evoked force = evoked force/MVC x 100).. Fig. 1. The effect of TMS during a typical trial. During the trial, the subject was asked to reach and maintain the target force. TMS was applied when the background force was stabilized around the target force. MEP amplitude and latency The peak amplitude of the full-wave rectified MEPs, the area of the full-wave rectified MEPs and the root mean square (r.m.s.) of the EMG signal from 50 ms before the onset of MEP were obtained (Biometrics datalog P3X8, Biometrics Ltd, UK) for biceps and triceps. After verifying that the results based upon the integral and amplitude of the full-wave rectified MEPs were comparable, we subsequently reported the MEP size as the maximum peak of the full-wave rectified MEPs. For each subject, MEP size was normalized to the mean area of the rectified EMG during MVC of each muscle (Taylor et al. 1997). In addition, the response latency of biceps MEP was measured from the first stimulus pulse to the peak of the MEP..
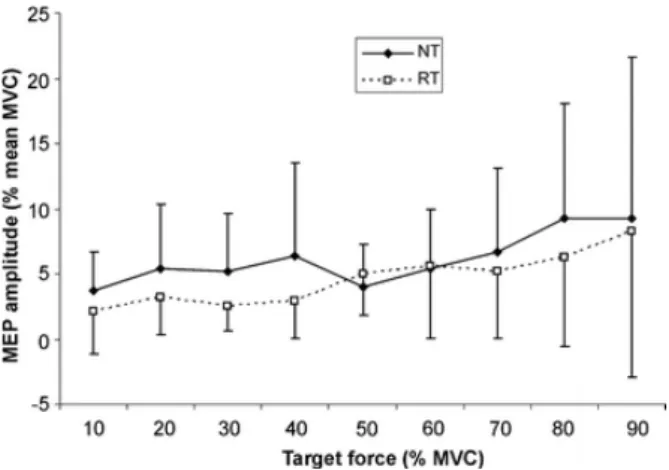
(4) Statistical analysis Repeated-measures analysis of variance (ANOVA) was performed with target force as the intrasubject factor and group (NT vs RT) as the inter-subject factor. Post hoc t-test was made for multiple comparisons. The difference in MVC between the groups was compared using the independent samples ttest. The level of significance was set at P<0.05. Results The maximal voluntary contraction for the BB muscle of the RT group (386.8±25.8 N, range 357.8–444.3 N) was significantly larger (t = 7.3, P < 0.001) than NT group (278.4±38.7 N, range 216.4–343.4 N) by 38%. At the end of the experimental session MVC was reduced by 2% in the RT group and increased by 1% in the NT group without significant change. Evoked force Figure 2 demonstrates how the magnitude of the evoked normalized force in both groups increases at 30% of MVC and then decreases up to 90% of MVC. The shape of the evoked normalized force was similar in both groups with the third-order polynomial regression equations being the most appropriate curve-fitting method (r 2 = 0.95 for NT group and r 2 = 0.96 for RT).. Fig. 2. Comparison of the evoked force (normalized to MVC) at different levels of target force between RT and NT groups. The solid line shows the polynomial regression for the NT group (y = 0.094x 3 – 1.6503x 2 + 7.084x + 2.451; R 2 = 0.9562) and the discontinuous line shows the polynomial regression for the RT group (y = 0.0737x 3 – 1.2762x 2 + 5.431x + 1.1429; R 2 = 0.9659). The ANOVA showed a significant main effect for the target force (F = 42.0, P < 0.001) and group (F = 8.3, P < 0.01). *Post-hoc analysis showed significant differences between 30–70% of MVC (P <0.05). The ANOVA showed a significant main effect for the target force (F = 42.0, P < 0.001) and group (F = 8.3, P < 0.01). The evoked force at each target force was always higher in the NT group and the posthoc analysis showed significant differences at 30 (t = 2.405, P = 0.027), 40 (t = 2.559, P = 0.02), 50 (t = 2.108, P = 0.007), 60 (t = 2.108, P = 0.049) and 70% (t = 3.58, P <0.005) of MVC between groups. At 90% of MVC, in nine out of ten RT subjects there was an absence in the evoked force, while this absence occurred in only five of ten NT subjects. In one NT subject and two RT subjects this absence started at 80% of MVC. MEP amplitude and latency There was no significant difference in the threshold required to evoke an MEP at 10% of voluntary contraction between the two groups. Figure 3 shows the amplitude of the MEP normalized relative to the MVC for the BB muscle for the target force. The maximum facilitation of the MEP was at 20% in the RT group and at 40% in the NT group. However, the difference between the groups was not significant and only the target level showed a significant effect in both groups (F = 8.8, P < 0.001). Similar results were.
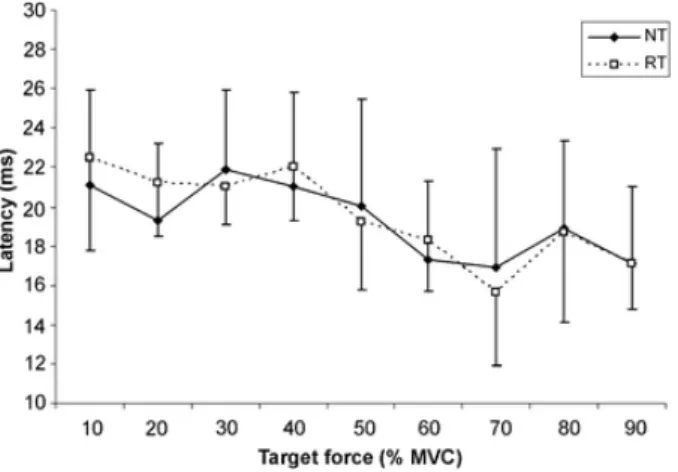
(5) obtained when the MEP size was expressed as a proportion of the r.m.s EMG activity during the 50 ms prior to the stimulus (data not reported).. Fig. 3. Comparison of the MEP amplitude (normalized to MVC) for the BB in both groups, RT and NT. There was a significant difference in the target force without a significant difference between the groups. The latency of the MEP, measured from the first stimulus pulse to the peak of the MEP, shows a tendency to decrease as the target force increased (Fig. 4). This diminution of the latency was significant for both groups (F = 7.9, P < 0.001), without a significant effect between the two groups.. Fig. 4- Comparison of MEP latency (measure at maximum peak of MEP) for the BB in both groups, RT and NT. The latency diminished significantly in both groups (P<0.05) with increasing target force. There was no significant difference between the groups. The intensity of the stimulator used also evoked a response in the antagonist muscle (triceps brachii). Figure 5 show the amplitude of the MEP for the triceps muscle normalized to the amplitude of the triceps MVC for different target forces. The triceps MEP increased with an increase of the target force in the BB (F= 2.5, P = 0.012) and reached the maximum value at 90% MVC (9±12 and 8±11% for the RT and NT groups, respectively). No significant difference was found between the two groups..
(6) Fig. 5 . Comparison of MEP amplitude (normalized to MVC) for the triceps brachii in both groups, RT and NT. The amplitude decreased significantly in both groups (P<0.05) with increasing target force. There was no significant difference between the groups. Discussion The purpose of this study was to determine if the evoked force induced by a TMS at different levels of voluntary contraction was different between a group of young males without experience in RT and a group of young males who participated in systematic RT. This is the first study that evaluated the longterm (over years) adaptation in response to RT in a proximal muscle of the upper limb, using TMS. The main finding of this study is the higher voluntary activation in the RT group in comparison with the control group at several intensities of the MVC. RT group versus NT group As expected, maximal voluntary force was significantly higher in the RT group compared with the NT group. The values of the evoked force in the NT group normalized to the MVC were similar to those reported for BB (Todd et al. 2003) and slightly lower for flexor digitorum superficialis (Danion et al. 2003). To date only a few studies have evaluated the effect of resistance training using TMS. Carroll et al. (2002) showed that after 4 weeks of RT for the index finger abductor the magnitude of the evoked responses to transcranial magnetic and electrical stimulation was reduced for a given absolute level of torque or EMG activity following resistance, and this difference was significant at 40, 50 and 60% of MVC. The authors suggest that RT altered the organization of the CNS such that a corticospinal input of a given magnitude activated fewer motoneurons during muscle contraction than were recruited prior to training. Jensen et al. (2005) also reported a significant decrease in the TMS-response for the BB after 4 weeks of RT; but in this study there was not correlation between decrease in MEP and increase in muscle strength. This way the authors suggest that RT is not accompanied by similar changes in corticospinal excitability. Unfortunately most studies that examine the chronic neural adaptation to RT are limited to brief periods of training (4–12 weeks) or only measure the excitability of spinal motoneurons (Enoka 1997; Enoka and Fuglevand 2001). Our results support and extend the findings of Jensen et al. (2005) for a long-term practice of RT. In our study, between 30 and 70% of MVC, there was a significant difference in the evoked force between the RT group compared with the NT group. However, any significant difference was shown for the MEP amplitude or latency between groups. Regardless of this absence of significant difference in the MEP amplitude, for over 20% of MVC the amplitude of the MEP was always lower for the RT group than that for the NT group. This supports the proposition that for a specific target force the response induced by TMS is lower for the RT group as compared with controls. On the other hand the significant decrease in MEP latency with increasing target force in both groups could perhaps be explained by a change in the interval between the arrival of the initial impulse volley to the spinal motoneuron pool and the initiation of motoneuron discharge (Rothwell et al. 1987). Thus, a lower temporal summation of successive excitatory impulses is required for a motoneuron in a background contraction state or there is a recruitment of faster conduction of motor units as the level of contraction increases (Calancie et al. 1987). In any case the size of the MEP does not correlate with the evoked force (Kiers et al. 1995) and as such any significant changes of the MEP should be interpreted with caution. The evoked force may be a more accurate and reproducible measure of total cortical output (Reid at al. 2002)..
(7) Which are the reasons to explain the difference in the evoked force between both groups? The active threshold TMS intensity used in our study was not significantly different between the two groups and thus can be excluded as a possible reason for this difference. Although effects of motor training and skill acquisitions over changes in the human sensoriomotor representation have been demonstrated from studies with TMS (Pascual-Leone et al. 1994, 1995), the nature of these tasks were more complex than the exercises performed by the RT subjects in the present study and could explain the absence of differences in the active threshold between the two groups. Another possible explanation for the difference in the evoked force between the groups could be the behavior of the antagonist muscles (triceps brachii) during the target force trials. There is evidence to suggest that after RT there is a reduction in the level of coactivation between agonist and antagonist muscles (Carolan and Carafelli 1992). Thus, the TMS could evoke a response in the antagonist muscles and affect the evoked force in the two different groups (Todd et al. 2003). However, in our subjects the response of the triceps to TMS was similar for both groups, so that the triceps MEP increased with an increase in the target force. Regardless of the significant difference in the evoked force between groups our findings also showed an increase in the evoked force from 10 to 30% of MVC and a progressive decrease over the 30% of MVC for both groups. This behavior in the evoked force is in partial agreement with Todd et al. (2003). These authors show a linear relationship between twitch amplitude (evoked force) and target force from 50 to 100% of MVC in response to TMS. In the present study we used a greater number of levels of contraction, with a third-order polynomial response curve between the evoked force and the level of contraction. This is in line with another study that used a twitch interpolation technique (De Serres and Enoka 1998). Our results show that limitations of the regression strategy used to extrapolate the MVC must be considered, since not all subjects present a good fit. Overall, nine of our subjects from the RT group and five from the NT group showed an absence of an evoked force at higher levels of contraction. This absence or decrease in the evoked force have also been documented using the twitch interpolation technique (De Serres and Enoka 1998) and would be attributed to an unloading of the muscle spindles, after hyperpolarization of the motoneurons, or inhibition of motoneurons by Renshaw cells and Ib afferents (Merton 1954). What is the origin of the evoked force induced by TMS? In order to use the evoked force as a reproducible measure of cortical output, it is necessary to discuss the origin of the evoked force induced by TMS. The gradation of force in isometric contractions depends on the modulation of the number of motor units activated and the discharge rate (Person and Kudina 1972). Since the neural contributions to force production could be the recruitment of motor units, discharge rates of motor units and motor unit synchronization, the evoked force induced by TMS should be considered with these parameters in mind. The TMS could excite virtually all motoneurons supplying the target muscle (Magistris et al. 1998), thus the force evoked would be, in part, the result of the motor units recruited non-voluntarily. It is known that for the BB muscles, almost all of the motoneurons are recruited at levels of contraction of around 90% of MVC (Kukulka and Clamann 1981; De Luca et al. 1982). Thus, the fact that in our subjects there was a decrease in the evoked force at high levels of contraction seems to indicate that this is due to the higher voluntary recruitment of motor units. However, if the force evoked by TMS is only the result of the activation of motor units recruited non-voluntarily, it would be difficult to explain how a TMS- evoked force can be produced in hand muscles (Danion et al. 2003) where all the motor units are recruited at 50% of MVC (Kukulka and Clamann 1981; De Luca et al. 1982). One limitation of our study was that the influence of synergist muscles on the evoked force was not assessed and thus it is not possible to assume that the muscles acting around a joint increase their force linearly and at equal rates (Buchanan et al. 1986, 1989). On the other hand, the intrinsic firing properties of motor units could affect their response to a given level of excitatory drive. It was recognized that the increase in their rate of discharge might have a significant effect on the force exerted by the motor unit (Enoka and Fuglevand 2001). Brief intervals (5–55 ms) between successive action potentials might enhance motor unit force during submaximal contractions (Zajac and Young 1980; Garland and Griffin 1999). It is well known that magnetic stimulation produces direct (D) and indirect (I) volleys in descending pathways (Ziemann and Rothwell 2000), with a delay between D- and I-waves of latency from 0.75 to 1.34 ms (Rosenthal et al. 1967). The increase of evoked force by cortical electrical stimulation was attributed to summation of twitch forces resulting from double or multiple firing of single units with interspike intervals of approximately 5 ms (Day et al. 1987). However, other studies showed that there was no increment in force when the brief interval preceded higher frequency (Macefield et al. 1996) and the inclusion of additional short intervals in a train of stimuli did not lead to further enhancement of the force (Thomas et al. 1999). Regarding the relation between motor unit.
(8) synchronization and the force exerted, it is still unclear whether higher motor unit synchronization contributes to the production of additional force. In any case the transcranial stimulation generates a phase cancellation of the action potentials caused by the desynchronization occurring within the corticospinal tract or at the spinal cell level (Magistris et al. 1998). It can therefore be concluded that the evoked force induced by TMS is a combination between the number of motoneurons recruited and their rate of discharge, and any change in this parameter may be the result of an adaptation of both of these mechanisms. Thus, the lower evoked force in the RT group as compared with the controls may be as a result of an adaptation of both of these mechanisms. We propose that long-term RT leads to activation of more voluntary motor units and/or higher discharge rates. However, an enhancement of muscle activation as a result of increase in motor unit recruitment and/or firing patterns after RT is merely a speculation in view of the lack of experimental data (Van Cutsem et al. 1998). More studies using TMS over the cortex motor in combination with twitch interpolation technique and techniques that measure spinal changes would contribute to a better understanding of the neural adaptation induced by RT. In summary, the long-term RT induced a smaller evoked force by TMS than in subjects who were not trained, indicating an adaptation in the CNS to RT. This adaptation was sustained over a long period of RT. Therefore, this neural adaptation permits a higher voluntary adaptation at several intensities of the MVC. Acknowledgements. This work was supported by a Xunta de Galicia Grant (PGIDIT02BTF13701PR). We wish to thank Prof. John Rothwell for his suggestions and Noa Fogelson for the revision of the manuscript.. References Aagaard P, Simonen EB, Andersen JL, Magnusson P, Dyhre-Poulsen P (2002) Neural adaptation to resistance training: changes in evoked V-wave and H-reflex responses. J Appl Physiol 92:2309–2318 Belanger AY, McComas AJ (1981) Extent of motor unit activation during effort. J Appl Physiol 51:1131–1135 Bellemare F, Woods JJ, Johansson R, Bigland-Ritchie B (1983) Motor-unit discharge rates in maximal voluntary contractions of three human muscles. J Neurophysiol 50:1380–1392 Buchanan TS, Rovai GP, Rymer WZ (1989) Strategies for muscle activation during isometric torque generation at the human elbow. J Neurophysiol 62:1201–1212 Buchanan TS, Almdale DP, Lewis JL, Rymer WZ (1986) Characteristics of synergic relations during isometric contractions of human elbow muscles. J Neurophysiol 56:1225–1241 Calancie B, Nordin M, Wallin U, Hagbarth KE (1987) Motor-unit responses in human wrist flexor and extensor muscles to transcranial cortical stimuli. J Neurophysiol 58:1168–1185 Carolan B, Carafelli E (1992) Adaptations in coactivation isometric resistance training. J Appl Physiol 73:911–917 Carroll TJ, Riek S, Carson RG (2002) The sites of neural adaptation induced by resistance training in humans. J Physiol 544:641–652 Danion F, Latash ML, Li S (2003) Finger interactions studied with transcranial magnetic stimulation during multifinger force production tasks. Clin Neurophysiol 114:1445–1455 Day BL, Rothwell JC, Thompson PD, Dick JP, Cowan JM, Berardelli A, et al (1987) Motor cortex stimulation in intact man. 2. Multiple descending volleys. Brain 110:1191–1209 De Luca CJ, LeFever RS, McCue MP, Xenakis AP (1982) Behaviour of human motor units in different muscles during linearly varying contractions. J Physiol 329:113–128 De Serres SJ, Enoka RM (1998) Older adults can maximally activate the biceps brachii muscle by voluntary command. J Appl Physiol 84:284–291 Enoka RM (1997) Neural adaptations with chronic physical activity. J Biomech 30:447–455 Enoka RM, Fuglevand AJ (2001) Motor unit physiology: some unresolved issues. Muscle Nerve 24:4–17 Gandevia SC, Allen GM, McKenzie DK (1995) Central fatigue. Critical issues, quantification and practical implications. Adv Exp Med Biol 384:281–294 Garland SJ, Griffin L (1999) Motor unit double discharges: statistical anomaly or functional entity? Can J Appl Physiol 24:113–130 Hakkinen K, Komi PV (1983) Electromyographic changes during strength training and detraining. Med Sci Sport Exerc 15:455–460 Jensen JL, Marstrand PC, Nielsen JB (2005) Motor skill training and strength training are associated with different plastic changes in the central nervous system. J Appl Physiol 99:1558–1568 Kiers L, Clouston P, Chiappa KH, Cros D (1995) Assessment of cortical motor output: compound muscle action potential versus twitch force recording. Electroencephalogr Clin Neurophysiol 97:131–139 Kukulka CG, Clamann HP (1981) Comparison of the recruitment and discharge properties of motor units in human brachial biceps and adductor pollicis during isometric contractions. Brain Res 19:45–55.
(9) Macefield VG, Fuglevand AJ, Bigland-Ritchie B (1996) Contractile properties of single motor units in human toe extensors assessed by intraneural motor axon stimulation. J Neurophysiol 75:2509–2519 Magistris MR, Rosler KM, Truffert A, Myers JP (1998) Transcranial stimulation excites virtually all motoneurons supplying the target muscle. A demonstration and a method improving the study of motor evoked potentials. Brain 121:437–450 Merton PA (1954) Voluntary strength and fatigue. J Physiol 123:553–564 Pascual-Leone A, Grafman J, Hallett M (1994) Modulation of cortical motor output maps during development of implicit and explicit knowledge. Science 263:1287–1289 Pascual-Leone A, Nguyet D, Cohen LG, Brasil-Neto JP, Cammarota A, Hallett M (1995) Modulation of muscle responses evoked by transcranial magnetic stimulation during the acquisition of new fine motor skills. J Neurophysiol 74:1037–1045 Person RS, Kudina LP (1972) Discharge frequency and discharge pattern of human motor units during voluntary contraction of muscle. Electroencephalogr Clin Neurophysiol 32:471–483 Reid A, Chiappa KH, Cors D (2002) Motor threshold, facilitation and the silent period in cortical magnetic stimulation. In: Pascual-Leone A, Davey NJ, Rothwell JC, Wassermann EM, Puri BK (eds) Handbook of transcranial magnetic stimulation. Arnold, London, pp 97–111 Rosenthal J, Waller HJ, Amassian VE (1967) An analysis of the activation of motor cortical neurons by surface stimulation. J Neurophysiol 30:844–858 Rothwell JC, Day BL, Thompson PD, Dick JP, Marsden CD (1987) Some experiences of techniques for stimulation of the human cerebral motor cortex through the scalp. Neurosurgery 20:156–163 Rutherford OM, Jones DA (1986) The role of learning and coordination in strength training. Eur J Appl Physiol 55:100–105 Sale DG (1988) Neural adaptation to resistance training. Med Sci Sport Exerc 20:S135–S145 Taylor JL, Allen GM, Butler JE, Gandevia SC (1997) Effect of contraction strength on responses in biceps brachii and adductor pollicis to transcranial magnetic stimulation. Exp Brain Res 117:472–478 Thomas CK, Johansson RS, Bigland-Ritchie B (1999) Pattern of pulses that maximize force output from single human thenar motor units. J Neurophysiol 82:3188–3195 Todd G, Taylor JL, Gandevia SC (2003) Measurement of voluntary activation of fresh and fatigued human muscles using transcranial magnetic stimulation. J Physiol 551:661–671 Van Cutsem M, Duchateau J, Hainaut K (1998) Changes in single motor unit behaviour contribute to the increase in contraction speed after dynamic training in humans. J Physiol 513:295–305 Yue GH, Ranganathan VK, Siemionow V, Liu JZ, Sahgal V (2000) Evidence of inability to fully activate human limb muscle. Muscle Nerve 23:376–384 Zajac FE, Young JL (1980) Properties of stimulus trains producing maximum tension-time area per pulse from single motor units in medial gastrocnemiu muscle of the cat. J Neurophysiol 43:1206–1220 Zehr EP, Sale DG (1994) Ballistic movement: muscle activation and neuromuscular adaptation. Can J Appl Physiol 19:363–378 Ziemann U, Rothwell JC (2000) I-waves in motor cortex. J Clin Neurophysiol 17:397–405.
(10)
Figure

Documento similar