Assessing the impact of project based learning in engineering courses by using multiple correspondence analysis
13
0
0
Texto completo
(2) Ingeniería y Competitividad, Volumen 15, No. 2, p. 77 - 89 (2013). 1. Introduction Different methods exist to evaluate the impact of new educational approaches or didactic strategies on education. Techniques from qualitative research methods like semi-structured or structured interviews, storytelling, and participant observation offer outstanding tools to collect data on aspects related to the use of a new pedagogical or educational approach. However, in engineering education it is common to use quantitative methods to collect data; usually, surveys are designed for observing the impact of the new educational approaches or didactic strategies applied in the courses. These surveys seek to know the advantages and disadvantages of the new teaching practices and to evaluate the effectiveness of these approaches on student learning. The data obtained from responses to the survey was analyzed by using statistical analyses and the researcher must face the challenge to choose the more suitable one. Currently, one of the educational approaches in engineering education most frequently used throughout the world is Project-Based Learning (PBL). This is an interesting approach for engineering education because it introduces a real professional challenge into a learning environment to facilitate learning the concepts and developing diverse skills. In (Kolmos et al., 2008), the authors cite different references to demonstrate the effectiveness of PBL on student learning in aspects like: promoting deep approaches of learning instead of surface approach; improving active learning; developing the criticality of learners; improving self-directed learning capability; increasing the consideration of interdisciplinary knowledge and skills; developing management, collaboration, and communication skills, developing professional identity and responsibility development; and improving the meaningfulness of learning. Several contributions in engineering education exploit the PBL benefits; some contributions focus on designing a curriculum for a specific program and others are devoted to applying PBL in particular subjects.. 78. The PBL has been widely used in diverse engineering subjects; there are examples in circuits analysis, Costa et al. (2007); digital signal processing, Jill (2006) and Nelson (2006); instrumentation and measurement, Mukhopadhyay (2007); digital and analog electronic circuits, Nerguizian & Rafaf (2006), Northern (2007) and Perera (2002); electrical power systems, Hosseinzadeh & Hesamzadeh (2012); etc. Some contributions for control system education have been developed at Instituto Tecnológico de Estudios Superiores de Monterrey in México, Morales-Menendez et al. (2006); Cork Institute of Technology in Ireland, O’Mahony (2008); Universidad de los Andes, Duque et al. (2003) and Universidad del Valle, Colombia, Fernández-Samacá et al. (2012). Project-Based Learning research covers different topics like: management of change when a PBL approach is implemented, de Graaff &Kolmos (2007); PBL models, methods for its study, PBL practices, PBL effectiveness and the impact assessment of PBL approaches, Du et al., (2009). In order to contribute to PBL research on engineering education, this paper is focused on showing an experience about the evaluation of a Project-Based Learning approach by using multivariate statistical analysis. As in other approaches, the impact of PBL on student learning can be evaluated through surveys seeking to know the opinions of stakeholders about aspects regarding its application. Related papers present results based on showing the answers to open questions to know students’ opinions, reflections on teaching practices, or percentages or frequencies with which an answer option has been selected; Costa et al., (2007) and Hosseinzadeh & Hesamzadeh (2012) present interesting examples of these kinds of analyses. Otherwise, this paper shows the application of multiple correspondence analyses and hierarchical clustering method to analyze the information from a survey applied in courses using Traditional Education and the proposed Project-Based Learning approach. The survey stresses on knowing the students’.
(3) Ingeniería y Competitividad, Volumen 15, No. 2, p. 77 - 89 (2013). opinions about the development of transversal skills upon which the PBL approach is centered (teamwork, problem solving, self-learning, and communication abilities). The results obtained are consistent with those reported in previous publications by using other statistical methods, Fernández-Samacá et al., (2012). The advantage of using multivariate statistical analysis is that it allows knowing not only the influence of the variables involved in the development of transversal skills, as in the statistical methods used previously, but also the correlation among these research variables. Moreover, it facilitates the interpretation of data, about the correlation of variables studied from graphical information. Although this proposed assessment is not conclusive about the effectiveness of the proposed PBL approach because it is constrained by the specific context, this assessment gives references, views, experiences, and observations that allow understanding the advantage of PBL in engineering education. The rest of the paper is organized as follows: the second section describes the PBL approach. The third section presents the multivariable statistical analysis of the survey data. Finally, the paper presents some concluding remarks.. 2. PBL approach for control courses This section presents briefly the PBL approach developed for control engineering courses of the Electronics Engineering Program at Universidad del Valle in Cali, Colombia; a complete description can be consulted in Fernández-Samacá et al., (2012). The approach was introduced by taking as reference the model known as ‘PBL alignment of elements in the curriculum’, proposed in Kolmos et al., (2009). In this model, the elements of curriculum are organized in holistic manner so that the change in an element will affect the others. The model comprises seven dimensions, which are: objectives and knowledge; types of problems, projects and lectures; progression, size and duration; student’s learning; academic staff and facilitation; space and organization; and assessment and evaluation.. 2.1 Objectives and knowledge The PBL approach was conducted in the two control courses (Control I and Control II) of the Electronics Engineering program at Universidad del Valle. The courses are developed in 16week semesters during the third year of the program. The course objectives are modeling system; analyzing the model in time domain and frequency; designing and RST and PID controllers by using classical control theory like the location of poles, analysis of root locus and frequency response and designing controllers and state observers for systems described by state space. This PBL approach also includes as a course objective, the development of transversal skills such as teamwork, self-learning, communication skills and problem solving. 2.2 Types of problems, projects and lectures The problems are proposed by teachers at the beginning of the semester from three aspects: a context, a variable, and a control target. Problems can be of two types: the local context, in the control of a variable of local industry, and the control of a laboratory prototype. In the first ones, students reflect on cases of the professional field and in the second one, students perform in-depth analysis of a known case study (benchmarks). The project aims to solve a problem approach and it is developed in stages over two semesters. In each course of control, four stages are related to objectives and knowledge (Figure 1). In this approach, the topics are taught according to the project. In the lectures, the teacher answers questions, explains some difficulty issues, guides the development of hands-on sessions to learn theoretical concepts, and develops exercise sessions. The hands-on sessions are focused on encouraging students to understand knowledge in a fun way, Fernández-Samacá & Ramírez (2011), by using a game in the classroom. In the lab, students carry out training practices that satisfy the project requirements.. 79.
(4) Ingeniería y Competitividad, Volumen 15, No. 2, p. 77 - 89 (2013). 2.3 Progression, size and duration Students spend 108 hours per semester on activities related to the project; these hours correspond to 56% of the activities in the courses and, in turn, the course corresponds to 20% of the total time of each semester. In the proposed PBL approach, Fernández-Samacá et al., (2012), the project is developed by teams of three or four students. Each student team participates in four different projects (Figure 1). 2.4 Student’s learning There are two types of learning outcomes. The first one refers to control learning and the second one to the development of transversal skills, Fernandez-Samaca et al., (2011). About control learning, during the first course, students describe the system’s components; get the system model; apply their knowledge of differential equations, difference equations, block algebra, transfer function and state space; simulate and analyze the model (also in real time) and, finally, students tune PID controllers. During the second course, students analyze the system in the frequency domain, design analogue and digital controllers. using several methods, study structures as feedforward and cascade control, and design observers and controllers. Regarding transversal skills, the PBL approach focuses on teamwork, selflearning, problem solving, and communication skills. Other generic skills like decision making, time and information management, and selfcriticism also are promoted from the project work. 2.5 Academic staff and facilitation The academic staff comprises two teachers for each level, one for the theory and another for the laboratory. Moreover, each student team has collaboration from an expert on the subject of the problem, who acts as a consultant in the project development. Some speakers are invited to explain specific issues. 2.6 Space and organization The PBL approach uses the traditional education resources available at the University. Students have spaces like: library, laboratories, information technology rooms with specialized software and access to simulation tools and emulation. So far, no group rooms are available in the University.. Figure 1. PBL approach for linear control courses including the dimensions of Kolmos’s model.. 80.
(5) Ingeniería y Competitividad, Volumen 15, No. 2, p. 77 - 89 (2013). For experimental activities, student teams use prototype plants, pilot plants of other laboratories and real-time simulation. Students also use a specialized platform to solve problems; this platform has tools for remote experimentation and emulation of models with hardware in loop, Ramírez et al., (2008). The academic activities are managed via the virtual campus using Moodle. 2.7 Assessment and evaluation The course evaluation was designed, by taking into account three aspects: who is evaluating, who is being evaluated, and what is being evaluated (the evaluation focus). Figure 1 shows an example of the evaluation matrix used in the theoretical course. In this course, the teacher uses quizzes, practical exams, and project progress to assess knowledge and technical skills. The rotation of the project stages among teams allows using peerassessment activities, which are related to the project progress that involves oral presentations and written reports.. 3. Multivariate statistical analysis of the survey data This section summarizes results of the survey data from the student responses. Taking into account that each responder answers several questions, related to different qualitative variables, the data corresponds to a multivariate structure. A common statistical technique to analyze qualitative and multivariate data is the Multiple Correspondence Analysis (MCA). The MCA is used to analyze a set of observations described by a set of variables, each variable has different levels and each level can be coded as binary variable, Abdi and Valentin (2007). The MCA is a Principal Components Analysis (PCA), which can be applied to qualitative data (Burt matrix). The PCA aims at reducing a space multivariate orthogonal coordinate system to a low-dimensional space in which the relationships of variable dependence and independence are presented as points in the space. Thus, PCA generates new variables that have information contained in the data and. neglects the variables that contribute little to the study of the problem. The PCA does not need a probability distribution. . Another statistical technique to analyze multivariate data is the clustering method, which seeks to locate the individuals according to the variables that identify them. In this method, the individuals are grouped into clusters with the following characteristics: i) the cluster must be homogenous, this means individuals in a specific cluster must be very similar to each other and ii) the cluster must be well separated, this means two individuals belonging to two different clusters cannot be more similar to each other than two individuals belonging to the same cluster, Diaz (2002). 3.1 Student survey The instrument to evaluate the impact of the PBL approach developed was designed from the questionnaire Universidad del Valle uses to evaluate teacher performance and development of courses and a survey used to assess the impact of PBL, Alcober et al., (2003); it also takes into account documents about competencies of engineers in Colombia, ACOFI (2005), and the criteria of the Accreditation Board for Engineering and Technology, ABET (2008). A preliminary instrument was adjusted according to the results of pilot tests carried out at the beginning of the research. The reliability of the survey was assessed by using Cronbach’s Alpha coefficient, Ledesma (2004), from data of pilot tests. The queries of the survey were classified according to the four transversal skills on which this study was focused. This survey was applied to students in Control I and Control II courses. The queries for teamwork are: the course helps me to acquire skills for working in a team (QT1) and skills for working in interdisciplinary teams (QT2); the teacher timely guides my team in the solution of conflicts, problems, and difficulties (QT3) and encourages members of my team to improve and organize their presentations (QT4); my contribution for the teamwork was good (QT5) and. 81.
(6) Ingeniería y Competitividad, Volumen 15, No. 2, p. 77 - 89 (2013). I participated actively in the team meetings (QT6) and contributed in the team discussions (QT7). In problem solving the following queries were used: the course helps me to acquire the capability to work per projects (QP1), capability to apply the knowledge in the practice (QP2), capability to solve engineering problems (QP3), ability and attitude to research (QP4), ability to manage information (QP5), capability to manage time (QP6), capability to adapt myself to new situations (QP7), quality compromise(QP8), attitude to develop actions to improve the living conditions of the population (QP9); the course includes activities that involve the economic analysis of solutions (QP10); the teacher designs academic activities that stimulate my ability to analyze and solve problems (QP11) and I asked questions that encourage understanding of concepts (QP12). For self-learning the queries are: the course helps me to acquire capability for working by myself (QS1); teacher orients students on how to choose and properly use learning resources (QS2); I consulted extra bibliography and documentation by myself (QS3) and I was responsible with assigned tasks (QS4). Finally, the queries for communication skills are: the course helps me to acquire capability to communicate effectively with others (QC1) and capability to communicate with experts from other disciplines (QC2); the course uses resources in a different language from the native language (QC3); the teacher encourages members of my team to improve and organize their presentations (QC4) and I paid attention to presentations by my class mates (QC5). For self-learning, the queries are: the course helps me to acquire the capability to work by myself (QS1); the teacher guides students on how to choose and properly use learning resources (QS2); I consulted extra bibliography and documentation by myself (QS3), and I was responsible for assigned tasks (QS4). Finally, the queries for communication skills are: the course helps me to acquire capability to communicate effectively with others (QC1) and the capability to. 82. communicate with experts from other disciplines (QC2); the course uses resources in a different language from the native language (QC3); the teacher encourages members of my team to improve and organize their presentations (QC4), and I paid attention to presentations by my class mates (QC5). To observe the impact of the PBL approach, the survey was answered by 141 students from Control I courses, corresponding to six semesters; three courses used Traditional Education (TE) and four the PBL approach designed. In Control II courses, the survey was answered by 124 students from five semesters; three courses used traditional teaching and three used the PBL approach designed. Each course level was analyzed separately. 3.2 Multiple correspondence analysis According to Salvador Figueras (2003), the Multiple Correspondence Analysis allows the construction of a Cartesian diagram based on the association among the analyzed variables in which the different categories of variables are represented together. In this diagram, the proximity among the points is related to the level of correlation among categories. The analysis takes into account all queries presented previously and their different categories or modalities. Queries are considered variables; the categories correspond to the different response options of the survey. In this instance, there are six modalities. The first five ones match the scale used by the students to fill out the survey, which ranges from 1 to 5, indicating the compliance level of each query (1 = No compliance (P), 2 = Low (B), 3 = Medium (M), 4 = High (A), and 5 = Excellent level of compliance (E)), and the last one, 6 = (N), indicates that query was not answered. The educational approach was included as a variable with two categories, Traditional Education (TE) and Project Based Learning (PBL). The multivariate space size depends on the number of variables and their modalities (number of queries multiplied by the number of.
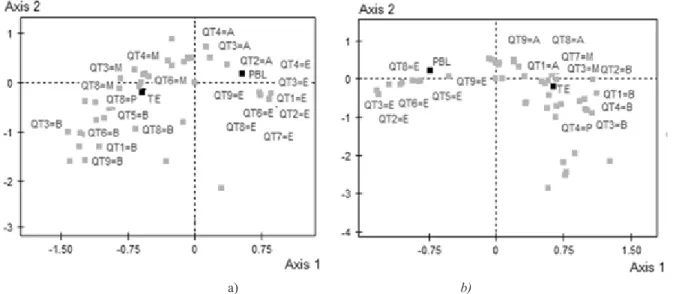
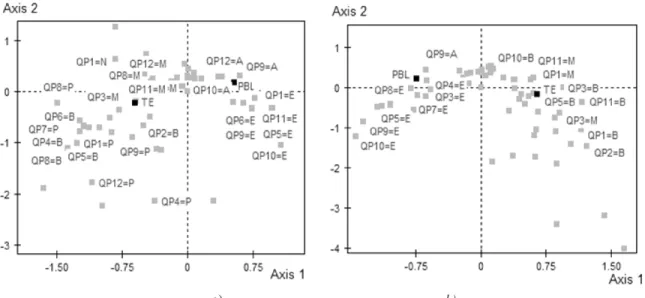
(7) Ingeniería y Competitividad, Volumen 15, No. 2, p. 77 - 89 (2013). categories), this means the size of the space is 380 ((63 queries * 6 categories) + (educational approach * 2 categories) = 380). Because the multivariate space of the analysis is a cloud of points (n individuals = consulted students) in a space in the order of p (380, all variables and categories), the space in the order of 380 is reduced through the multiple correlation analysis to a lowdimension space; for this instance, a space in the order of 3. The reduction of space means that axes of the diagram have contributions from all variables and their modalities, the contributions measure the importance of each variable in the construction of axes. Although the scale that appears in graphs allows knowing the value of the coordinates of each response in the new axes, it is the proximity among points that defines the association among different variables. Figure 2 displays the results for teamwork skill; this shows that the categories associated to higher scores are nearer to the PBL approach and the low scores are near to the Educational Approach, in the first two axes of the reduced space of multiple correspondence analysis. This means that according to student perceptions, the PBL approach is more correlated to better teamwork than TE. Results show that responses given by. a). students to queries related to problem solving, selflearning, and communication abilities had similar behavior. Figure 3 shows that for the problem solving skill, the responses with compliance level ‘Excellent’ (category E) are closer to PBL, while those related to low compliance level (Category B) are closer to TE. Results presented herein were obtained by using SPAD version 4.5. 3.3 Cluster analysis Statistical clustering methods allow defining types or clusters of individuals with similar characteristics; in this instance, the classification establishes clusters of students according to the responses they gave to survey queries. The dendrograms shown in Figure 4 have the overall classification obtained for each control level. A partition was chosen on each dendrogram corresponding to a classification of individuals into three clusters. Groups were made up by taking into account the statistical coefficient Vtest, which is defined as the probability that a response modality has a certain frequency within the group, starting from the null hypothesis that the total frequency of this modality is randomly distributed among all groups of the classification, Monroy and Guillermo (2002).. b). Figure 2. Teamwork. a) Control I courses, b) Control II courses. 83.
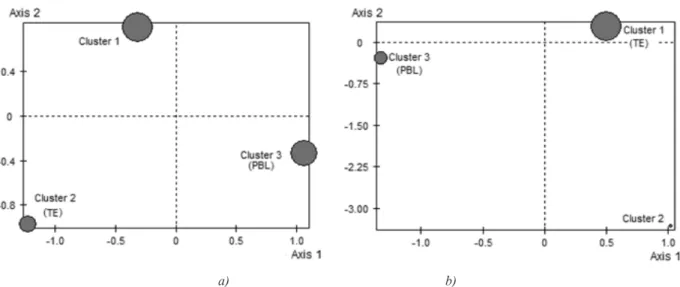
(8) Ingeniería y Competitividad, Volumen 15, No. 2, p. 77 - 89 (2013). a). b). Figure 3. Problem solving. a) Control I courses, b) Control II courses. For Control I courses, the first cluster corresponds to 41.84% of individuals, the second to 21.28%, and the third to 36.88%. For Control II courses, the first cluster comprises 68.55% of the individuals; the second one corresponds to 3.23%, and the third to 28.3%. Figure 4 shows that in Control II most individuals are represented in two clusters.. a). b) Figure 4. Dendrogram. a) Control I courses, b) Control II courses. 84. Figure 5 presents the distribution of the groups for each of the levels of control courses regarding the contribution these groups have on two of the three axes that make up a reduced multivariate space obtained by means of the principal component analysis that, according to Chahouki (2011), “reduces data dimensionality by performing a covariance analysis among factors”. Given that the educational approach was included as an extra variable with two categories; two clusters were characterized to include the modalities of the educational approach variable. Tables 1 and 2 have the classification of variables in clusters for Control I and Control II, respectively. Regarding the Control I course, Table 1 shows that in the first cluster, there are individuals who evaluated queries with scores 3 and 4 and they were not associated to a particular educational approach. In cluster 2 there are individuals who answered queries with scores 2 and 3 and were associated to the traditional.
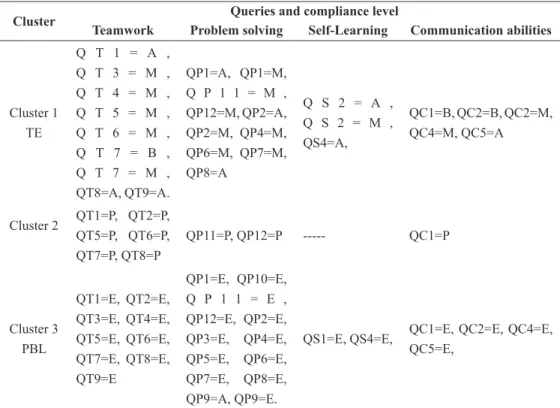
(9) Ingeniería y Competitividad, Volumen 15, No. 2, p. 77 - 89 (2013). a). b). Figure 5. Clusters. a) Control I courses, b) Control II courses. education approach (TE) (Table 1). Finally, cluster 3 is comprised of students who responded with scores 4 and 5 and were associated to PBL. Note that the higher scores are associated to PBL. Table 2 has clusters for Control II courses; the first cluster has individuals who graded queries with scores 2, 3, and 4 and were associated to TE. Cluster 2 comprises. a very small percentage of the population; this cluster has individuals who responded to queries with option 1 (‘noncompliance’), these students were not associated to any educational approach. Finally, cluster 3 is made up of students who responded with level of compliance 5 and were associated to PBL.. Table 1. Clusters for Control I courses Cluster. Queries and compliance level Teamwork. Problem solving. Self-Learning. Communication abilities. Cluster 1. QT1=A QT2=M QT3=A QT4=A QT4=M QT5=A QT6=A QT7=A QT8=A QT9=A. QP1=A QP4=A QP5=A QP8=A QP9=M QP11=A. QS1=A QS2=A QS3=A QS4=A. QC1=A QC4=A QC4=M QC5=A. Cluster 2 TE. QT2=B QT3=B QT3=M QT4=B QT5=B QT6=B QT7=B QT9=B. QP1=B QP4=B QP4=M QP6=B QP11=B QP11=M QP12=B. QS2=B QS2=M QS3=M. QC2=B QC4=B QC5=B. QT1=E QT2=E QT3=E QT4=E QT5=E QT6=E QT7=E QT8=E QT9=E. QP1=E QP2=E QP3=E QP4=E QP5=E QP6=E QP7=E QP8=E QP9=A QP9=E QP11=E. QS1=E QS2=E QS3=E QS4=E. QC1=E QC2=E QC4=E QC5=E. Cluster 3 PBL. The variables included in Table had a Vtest>2.3.. 85.
(10) Ingeniería y Competitividad, Volumen 15, No. 2, p. 77 - 89 (2013). Table 2. Clusters for Control II courses Cluster. Cluster 1 TE. Cluster 2. Cluster 3 PBL. Teamwork. Queries and compliance level Problem solving Self-Learning Communication abilities. Q T 1 = A , Q T 3 = M , Q T 4 = M , Q T 5 = M , Q T 6 = M , Q T 7 = B , Q T 7 = M , QT8=A, QT9=A.. QP1=A, QP1=M, Q P 1 1 = M , QP12=M, QP2=A, QP2=M, QP4=M, QP6=M, QP7=M, QP8=A. Q S 2 = A , Q S 2 = M , QS4=A,. QC1=B, QC2=B, QC2=M, QC4=M, QC5=A. QT1=P, QT2=P, QT5=P, QT6=P, QT7=P, QT8=P. QP11=P, QP12=P. -----. QC1=P. QT1=E, QT3=E, QT5=E, QT7=E, QT9=E. QP1=E, QP10=E, Q P 1 1 = E , QP12=E, QP2=E, QP3=E, QP4=E, QP5=E, QP6=E, QP7=E, QP8=E, QP9=A, QP9=E.. QS1=E, QS4=E,. QC1=E, QC2=E, QC4=E, QC5=E,. QT2=E, QT4=E, QT6=E, QT8=E,. The variables included in Table had a Vtest>2.3.. The results shown in the multiple correlation analysis and cluster analysis indicate a relationship between the educational approach and compliance level given by students as response to survey queries. The graphs obtained for the first two axes, in the multiple correlation analysis, show that modalities, with higher compliance levels in the rating scale, are closer to the PBL modality of the educational approach variable. Likewise, in cluster analysis, it is observed as for the Control I courses the high scores (cluster 3) are within the same cluster in which the PBL educational approach is, and low scores (cluster 2) are grouped with the traditional educational approach. In Control II, the clustering includes ‘Excellent’ level compliance and the PBL approach together, but in this case, some queries scored with ‘High’ (A) level compliance were grouped with the TE approach. The results obtained are consistent with those reported in previous publications by using other statistical methods, Fernández-Samacá et al., (2012); however, it is worth noting that the. 86. multivariate statistical analysis allows knowing not only the impact of the PBL on the development of transversal skills but also the relationship among the variables involved because it considers all variables simultaneously. Other techniques to evaluate the impact of PBL have been used. For example, the authors have compared students’ performance in both courses; the results obtained show that students have better performance in PBL courses, their grades are more homogenous, and the distribution of the grades is in a higher rating. Likewise, the overall score average for each aspect evaluated was greater in PBL courses, Fernández-Samacá et al., (2012).. 4. Concluding remarks The PBL approaches seek, among other things, to encourage development of generic competencies; therefore, knowing how the competencies relate to each other and how the educational approach.
(11) Ingeniería y Competitividad, Volumen 15, No. 2, p. 77 - 89 (2013). determines the development of these competencies is important to assess the impact of the approaches designed. The multivariate statistical analysis allows observing the relationships among the different variables involved in the research scope and their correlation from graphical information in which points corresponding to ‘excellent’ and ‘high’ level of compliance are nearer to the PBL approach. This means that according to student perceptions, the PBL approach is more correlated to better teamwork than TE. Results show that responses given by students to queries related to problem solving, self-learning, and communication abilities had similar behavior. Cluster analysis is a way of grouping individuals according to their responses; this allows inferring the usefulness of an approach and its impact on student learning by observing how the responses related to greater scores are grouped with the educational approach in which the analysis is focused. The multivariate analysis of data from the survey indicates that individuals who scored queries with excellent level of compliance and the PBL educational approach were grouped in the same cluster. This means that according to students’ opinions, the designed PBL approach strengthens the development of the transversal skills better than the traditional education. The proposed PBL approach facilitates student understanding of control concepts because this approach provides extra academic spaces like new evaluation activities, games in tutoring sessions, expert consultancy, and use of web-based support resources (emulation and simulation). These academic spaces encourage development of diverse transversal competencies; for example, public presentation, delivery of written reports, and assessment activities enhance communication abilities; the project work enhances teamwork and problem solving skills and peer- and selfassessment favors critical thinking. Currently, the Industrial Control Research Group at Universidad del Valle and the Signal Processing Research Group at Universidad Pedagógica y. Tecnológica de Colombia developed a project aimed at designing a PBL environment for control system education in which it is necessary to evaluate several aspects related to support resources, didactic strategies, knowledge, and skills; the multivariate statistical analysis is a good choice to evaluate the correlation among these aspects and the impact of the designed PBL on the academic performance of students through the elements involved in the proposed learning environment.. 5. References Abdi, H. & Valentin, D. (2007). Multiple correspondence analysis. Encyclopedia of measurement and statistics, 651-657. Accreditation Board for Engineering and Technology, ABET. (2008). Criteria for Accrediting Engineering Programs. Baltimore, United States. Asociación Colombiana de Facultades de Ingeniería, ACOFI. (2005). Marco de Fundamentación Conceptual y Especificaciones de Prueba ECAES. Capitulo 5. Definición y Caracterización de Competencias y Componentes del ECAES en Ingeniería. Alcober, J., Ruiz, S. & Valero, M. (2003). Evaluación de la implantación del aprendizaje basado en proyectos en la EPSC (2001-2003). Chahouki, M. A. Z. (2011). Multivariate Analysis Techniques in Environmental Science. In: DAR, I. A. (editor) , Earth and Environmental Sciences. Rijeka, Croatia: InTech Europe., (Chapter 23). Costa, L. R. J., Honkala, M. & Lehtovuori, A. (2007). Applying the Problem-Based Learning Approach to Teach Elementary Circuit Analysis. IEEE Transactions 50, 41-48. De Graaff, E. & Kolmos, A. (eds.). (2007). Managment of Change: Implementation of Problem-Based and Project-Based Learning in Engineering. Rotterdam/Taipei: Sense Publishers.. 87.
(12) Ingeniería y Competitividad, Volumen 15, No. 2, p. 77 - 89 (2013). Díaz, L. (2002). Estadítica Multivariada: Inferencia y Métodos. Universidad Nacional de Colombia. Du, X. Y., De Graaff, E. & Kolmos, A. E. (eds.). (2009). Research on PBL Practice in Engineering Education. Rotterdam/Boston/Taipei: Sense Publishers. Duque, M., Osorio, L. A., Gauthier, A. and Jimenez, F. (2003). Active learning environments for automatic control courses. In: International Conference on Engineering Education, Valencia, Spain. Fernandez-Samaca, L., Nielsen, K., Ramirez, J. M. & Kolmos, A. (2011). Comparison of PBL Curricula within Control Engineering Education. International Journal of Engineering Education 27 (4), 1362-1373. Fernández-Samacá, L. & Ramírez, J. M. (2011). Learning control concepts in a fun way. Intenational Journal of Engineeirng Education 27 (1), 187-199. Fernández-Samacá, L., Ramírez, J. M. & OrozcoGutiérrez, M. L. (2012). Project-based learning approach for control system courses. Sba: Controle & Automação Sociedade Brasileira de Automatica 23 (1), 94-107. Hosseinzadeh, N. & Hesamzadeh, M. R. (2012). Application of Project-Based Learning (PBL) to the Teaching of Electrical Power Systems Engineering. IEEE Transactions 55, 495-501. Jill, K. N. (2006). Using Project-Based Assignments in a Graduate-Level Digital Signal Processing Course. 12th - Signal Processing Education Workshop, p. 135-140. Kolmos, A., De Graaff, E. & Du, X. Y. (2009). Diversity of PBL- PBL learning principles and models In: Du, X. Y., De Graaff, E. & Kolmos, A. (eds.) Research on PBL Practice in Engineering Education. Rotterdam/Boston/Taipei: Sense Publishers.. 88. Kolmos, A., Du, X. Y., Holgaard, J. E. & Jensen, L. P. (eds.) (2008). Facilitation in a PBL enviroment. Aalborg: UNESCO Chair in Problem Based Learning in Engineering Education. Aalborg University. Ledesma, R. (2004). AlphaCI: un programa de cálculo de intervalos de confianza para el coeficiente alfa de Cronbach. Psico-USF 9, 31-37. Monroy, L. & Guillermo, L. (2002). Estadística multivariada: Inferencia y métodos. Universidad Nacional. Panamericana Formas e Impresos SA. Morales-Menendez, R., Chavez, I. Y. S., Cadena, M. R. and Garza, L. E. (2006). Control engineering education at Monterrey Tech. In: CHAVEZ, I. Y. S., ed. American Control Conference. Mukhopadhyay, S. C. (2007). SMPC: A Problem Based Approach to Enhance Student’s Learning on Instrumentation and Measurements. Instrumentation and Measurement Technology Conference Proceedings, p. 1-6. Nelson, J. K. (2005). Work in Progress: ProjectBased Assignments for a Graduate-Level Digital Signal Processing Course. Frontiers in Education Conference, 36th Annual, p. 6-7. Nerguizian, V. & Rafaf, M. (2006). E-learning Project Based Approach for analog electronic circuits. E-Learning in Industrial Electronics. In: 1ST IEEE International Conference, p. 181-184. Northern, J. (2007). Project-Based Learning For a Digital Circuits Design Sequence. In: Region 5 Technical Conference, IEEE, p. 358-362. O’mahony, T. (2008). Project-based learning in control engineering. In: International Signals and Systems Conference (ISSC), 208. IET Irish, p. 72-77. Perera, W. R. (2002). Redesigning a traditional digital electronics course for a practically oriented mechatronics degree. IEEE International Conference on Industrial Technology (ICIT). IEEE International Conference on vol. 2, p. 1190-1193..
(13) Ingeniería y Competitividad, Volumen 15, No. 2, p. 77 - 89 (2013). Ramírez, J., Caicedo, E. L., H., Pinedo, C., Bacca, E. & Ramos, C. (2008). A platform for signals and systems internet-based education. In: INTED Conference, Valencia, España.. Salvador Figueras, M. (2003). Análisis de Correspondencias [Accessed 06 de abril 2010], http://www.5campus.com/leccion/ correspondencias. 89.
(14)
Figure

+2
Documento similar