UNIVERSIDAD DE ESPECIALIDADES ESPIRITU SANTO FACULTAD DE ECONOMIA
AN IN-DEPTH ANALYSIS OF INVESTMENT IN THE BUILDING & CONSTRUCTION INDUSTRY OF ECUADOR
TRABAJO DE TITULACIÓN QUE SE PRESENTA COMO REQUISITO
PREVIO A OPTAR EL GRADO DE INGENIERO EN CIENCIAS EMPRESARIALES
NOMBRE DEL ESTUDIANTE:
PEDRO ALEJANDRO CARGUA SANCHEZ
NOMBRE DEL TUTOR: ING. BILLY ANDRADE G., MBA
An in-depth analysis of investment in the building & construction industry of Ecuador
Pedro Cargua Sanchez1, Billy Andrade Garcia2
1Estudiante de la Facultad de Economia con Mension en Negocios Internacionales y Estudiante de Ingenieria civil - Universidad Espíritu Santo – Ecuador,
[email protected], Facultad de Estudios Internacionales Edificio P, Universidad Espiritu Santo, Km 2.5 Via Puntilla Samborondon.
2Master Business Administration – Universidad Espíritu Santo – Ecuador, [email protected], Facultad de Estudios Internacionales Edificio P, Universidad
Espiritu Santo, Km 2.5 Via Puntilla Samborondon.
ABSTRACT
1 INTRODUCTION
The main purpose of this research is to discuss the importance of the construction sector in the economy of Ecuador, if it received more state support to develop a joint work and benefit all sectors that are related to this important activity. But, it has to touch important reasons to make the construction sector one of the strengths of the economy such as to determine the influence of each province in the economy of Ecuador in the construction sector, examine the benefits that could have the construction sector if the government contribution would include and the progress that would establish the sectors that are related to building new construction processes to innovate.
Because the growth of the economy in the third quarter of 2014 was 4.7%, 1.1 points higher than the growth recorded in the second quarter of that year. Moreover, in December 2014 the national unemployment stood at 4.12%, while full employment and underemployment nationwide showed levels of 42.8% and 50.9%, respectively. Thus, not only it has reduced unemployment but it has also improved the quality of employment compared to previous years. Improvements in the workplace have been accompanied by a reduction in poverty, which in December 2014 reached a level of 27.3%, while extreme poverty stood at 11.2%. (Economica, 2014).
The construction industry is undoubtedly one of the main engines for economic and social development of a country because it creates linkages with much of the commercial and industrial sectors of society.
2 buildings; and the second, who is called the real estate industry, includes the construction of housing and buildings (Naveda, 2013).
Based on these two installments, in the subsequent edition we estimates and present possible scenarios in the sector for the coming years. Although the expectation of the construction sector pointed to an increase of at least 10% this year, 2015 did not start with an encouraging outlook for the effects of falling oil prices. Placing less and less confidence credits for long-term debt by the citizens are some of the effects of concern to the union, according to Enrique Pita García, president of the Chamber of Construction of Guayaquil.
This production segment achieved growth in the third quarter of last year from 9.1% compared to the same period of 2013. One of its segments, real estate, will close 2014 with a growth of 8.5%, a figure above expectations which started this year, says Jaime Rumbea, director of the Association of Real Estate Housing of Ecuador. "It was a year of recovery after the 2013 mortgage loans of Biess (Bank Affiliate) fell; we recover USD 600 million, "he explains. 2015 raises an adverse scenario and the sector will slow, adds Hermel Flores, president of the Chamber of Construction Industry of Ecuador.
The Chamber considers, however, that public works can still drive the sector. This is because, according to Flores, hydroelectric enter a final phase of construction. Investment is also expected in the millennium schools and medical units, driven by Chinese credits earned earlier this year (AENOR, 2015).
3 LITERATURE REVIEW
Building sector in Ecuador
Construction accounted for 9.2% of total GDP in 2010. An Ecuadorian percentage represents a decrease from the 10% rate recorded in 2009, representing the fourth consecutive year of reducing the weight of brick on the set of the economy. The percentage contribution of the construction sector in GDP and returned to stand at 2003 levels, when it stood at 9%, according to the management of large construction companies.
The contribution rate of 9.2% in 2010 for the construction is also almost two points lower than the peak of 10.8% to the construction activity contributed to the national economy in 2006, in the 'boom' of the sector (MUNDO, 2011). By subsectors highlights the decline recorded by the construction of major infrastructure, 13.5% and the first to experience this activity in twelve years. The housing development activity moderated its contraction in contrast to 9.3%.
Consequently, the construction sector accounted for 67% of the sector last year, compared to 33% that led to the civil works, which thus gained on infrastructure projects for the first time since 1997. The current crisis in the sector is mainly reflected in employment. Busy construction now represent 9.3% of the total compared to the rate of 13.8% which meant in 2007, in the boom in the sector (MUNDO, 2011).
4 out that the construction industry had an increase of 9.9 percent, justified in a rebound of 7.4 percent in the execution of buildings and 12 percent for civil works.
The emitted hypothesis is denoted by H0 and called null hypothesis, which is the one that this research want to reject because the province might have a different in the investment on the construction. On the other side, the opposite hypothesis is denoted by H1 and is called alternative hypothesis, which accept that the provinces have a difference between them.
Construction in other countries
Colombia has a huge influence of the construction in the economy. Dane director, Mauricio Perfetti del Corral, pointed out that the construction industry had an increase of 9.9 percent, justified in a rebound of 7.4 percent in the execution of buildings and 12 percent for civil works.
"The 9.9 percent growth of the construction sector GDP is a good figure, but it should improve," said the president of the firm Ospinas Andres Arango, who added that the results seen in buildings and civil works realize that this sector of the economy became "the consent of the Government" and a generator of employment (2014, 2015). In turn, the president of the Colombian Chamber of Construction (Camacol), Sandra Forero said that the sector is generating 1.4 million jobs and also made clear that this would grow 9.7 percent in 2015.
5 In turn, the president of the Colombian Chamber of Construction (Camacol), Sandra Forero said that the sector is generating 1.4 million jobs and also made clear that this would grow 9.7 percent in 2015.
And in Argentina, the investment rate (gross domestic fixed investment (IBIF) / GDP) represents the average propensity to invest in an economy. The greater the proportion of investment on aggregate demand, further expansion is the productive capacity of the economy or potential output, thus more likely to sustain this growth in the long term. Moreover, by multiplying effect, the growth of investment can increase aggregate demand and thereby increase output growth in the short term.
In the version constant price, this variable is approximated increasing production capacity of an economy; while at current prices, measures the relative cost effort or money you need to spend the economy to achieve the physical volume of investment. This distinction is important because it introduces a clear distinction between the impact of investment on aggregate supply and total savings needed to finance it, a distinction that originates in shaping the relative prices of capital goods and their correlation with the real exchange rate. For example, in a context of increase (decrease) in the relative prices of capital goods, the investment effort can be increased (reduced) to generate the same physical volume of investment (DANE).
6 evaluate the effect of the investment on the productive capacity of a country over time, achieved with evaluating the investment rate at constant prices, since it is assumed that this would not be influenced by changes in relative prices (Coremberg, 2006).
According to INDEC figures for 2004, the stock of buildings is an asset that has increased participation in gross domestic fixed investment: 60%, with the remaining 40% in durable production equipment. The latter in turn is divided into machinery and equipment with 27% and transport 13% of the total. The imported durable equipment involved in 57% of the total investments in durable equipment. The breakdown by origin of the machinery and equipment is as follows: imported participates in 15% of the total investment, 55% of the total investment in machinery, while the foreign origin of investments in transport equipment consuming 8% of total gross domestic investment, 60% of all transport equipment investment.
Tools of Analysis Anova
7 Tukey
Tukey method used ANOVA to create confidence intervals for all differences in pairs between the average levels of the factors while controlling the error rate per family you specify. It is important to consider the family error rate when multiple comparisons are made because the probability of making a type I error for a number of comparisons is greater than the error rate for any individual comparison. To offset this increased error rate, Tukey method adjusts the level of confidence of each individual interval, so that the resulting level of confidence simultaneously is equal to a specific value. It will be used to classify provinces according the amount of investment.
Non-Parametric Test
An alternative in solving problems are nonparametric or distribution-free methods, which are not as numerous or severe cases and are applicable to any variable, in particular the nominal or ordinal type as well as various distributions. Most of these tests do not require assumptions about the shape of the population distribution. n accept non-normal distributions variables should not necessarily be measured in an interval or ratio level can be analyzed nominal or ordinal data n Yes nonparametric data analysis interval or reason like, these should be summarized discrete category. The variables should be categorical.
METHODOLOGY
8 will be tabulated. In order to identify the influence of economic factors between the Ecuadorian provinces with the level of construction due to balanced public investment in this sector over the royal government. The analysis of the variables is applied transversely and hopefully with low estimation error because of which comes from the sample and the fact that the universe to investigate is considered active sector. In this case it proceeds to perform the analysis only database obtained from INEC, where the principals variables will be the number of constructions by province and amounts invested in each of the works.
Also, the variables will be grouped per years in order to make a comparison between the variation of the total amounts of the construction and total amounts made during the 2010-2014. On the other hand, It will be specified the trends of the constructors in Ecuador in the structure and the materials that they used to use, showing in a characterization chart. And with a Duncan analysis the provinces are going to be classified in tree categories such as the one’s which more investment, medium investment and the lower investment had; in order to verified which are the main provinces that have a huge influence of this important investment.
9 AZUAY 5 314162387 278381422.2 124495956.7 BOLIVAR 5 51562275.2 72435099.33 32393961.21 CAÑAR 5 41171094.6 9699850.435 4337904.989 CARCHI 5 23050772.6 10101785.36 4517655.75 COTOPAXI 5 200848237.4 330161390.8 147652662.7 CHIMBORAZO 4 37899871.25 15959239.48 7979619.741 EL ORO 5 55309859.4 1527015.74 682902.199 ESMERALDAS 5 13598850.2 8760618.945 3917867.897 GUAYAS 5 1658302474 1600730777 715868566.4 IMBABURA 5 157813211.8 146603263.8 65562972.72 LOJA 5 278443804.4 406879597.3 181962087.6 LOS RIOS 5 35629730 8306154.142 3714625.058 MANABI 5 319060805.6 352614371 157693940.7 MORONA 5 16136342.2 3018600.558 1349959.209 NAPO 5 11989483.2 2613832.756 1168941.545 PASTAZA 5 7552615.8 704461.813 315044.9 PICHINCHA 4 751261783 122093959 61046979.49 TUNGURAHUA 4 118579636.8 17669817.33 8834908.663 ZAMORA 5 20252760.4 8527213.03 3813485.599 GALAPAGOS 5 12428982.2 4472540.661 2000180.99 SUCUMBIOS 5 23007642.4 14033811.44 6276111.272 ORELLANA 5 16555743.8 8292496.581 3708517.211 SANTO
DOMINGO 5 42789874 16117398.71 7207919.826 SANTA ELENA 5 115507037.4 183856687.2 82223210.15 Total 117 176981496.4 479767140 44354487.79 Table #1.a: Description of provinces
10 CAÑAR 5 29127139.53 53215049.67 32964215 56713811 CARCHI 5 10507749.41 35593795.79 16989486 40532424 COTOPAXI 5 -209101275.2 610797750 42276740 8.00E+08 CHIMBORAZO 4 12505159.89 63294582.61 28344164 61577296 EL ORO 5 53413818.93 57205899.87 53697626 56812224 ESMERALDAS 5 2721105.05 24476595.35 614600 23338830 GUAYAS 5 -329267303.4 3645872251 5.00E+08 4.00E+09 IMBABURA 5 -24218782.89 339845206.5 71888314 4.00E+08 LOJA 5 -226763943.2 783651552 95551113 1.00E+09 LOS RIOS 5 25316277.44 45943182.56 28924055 46813263 MANABI 5 -118767764.1 756889375.3 1.00E+08 9.00E+08 MORONA 5 12388254.56 19884429.84 11967611 19946339 NAPO 5 8743981.17 15234985.23 9065790 15637730 PASTAZA 5 6677910.93 8427320.67 6512194 8501175 PICHINCHA 4 556983048.7 945540517.3 6.00E+08 9.00E+08 TUNGURAHUA 4 90463014.32 146696259.2 1.00E+08 1.00E+08 ZAMORA 5 9664826.98 30840693.82 12125758 34339241 GALAPAGOS 5 6875589.48 17982374.92 9328842 19502998 SUCUMBIOS 5 5582363.98 40432920.82 9840859 45763530 ORELLANA 5 6259249.34 26852238.26 8354675 29418172 SAN. DOMINGO 5 22777480.28 62802267.72 28412852 62130817 SANTA ELENA 5 -112781192 343795266.8 19461871 4.00E+08 Total 117 89131844.58 264831148.2 614600 4.00E+09 Table #1.b: Description of provinces
In the table 1.a and 1.b its illustrated the means that are going to be compared between the investment across the construction sector of the provinces of Ecuador at 95% of confidence interval of each mean, giving the lower bound and the upper bound of each province.
11 Figure #1: Normality of variables
In the figure #1 its demonstrated by Histogram, Q-Q plot and Box plot how with the normal vale of the date base taken from INEC shows a huge frequency in the histogram an de Q-Q plot has not the normal form such as an ‘S’ in the figure. This is because the information has values really high. So, in order to manage correctly this information the best solution to get a good result its better to delete the outliers.
Homogeneity of variances
Test of Homogeneity of Variances Total building sum
Levene Statistic df1 df2 Sig.
4.937 23 93 0
Table #2: Test of Homogeneity of Variances
Testing assumptions to perform Anova procedure, the Levene’s test for homogeneity variances.
H0: σ2
12 The Levene’s test p-value = 0, demonstrate that at least one variance within the provinces is different and therefore Anova procedure cannot be applied. And unless Anova it might be applied non-parametric tests for independent samples, Figure #3 shows the result of this.
It was attempted to normalize the variable values by reducing outliers, but the assumptions for homogeneity of variances was not satisfied anyway. Then it should proceed to use a non-parametric analysis for independent variables, where the null hypothesis is the same as ANOVA test.
Non-Parametric test
Figure #2: Non-parametrical test for independent samples
13 Figure #3: Classification of the provinces according the level of investment private and public in construction.
In this figure is demonstrating that the null hypothesis is rejected because at least one o f the means compared are different from them.
Finding significant differences Tukey
Multiple Comparisons Dependent Variable: Total_building_m
PROVINCIA (J) Difference (I-Mean
HSD AZUAY 4559.80948 1250.96394 0.067 -125.5637 9245.1826 BOLIVAR 4822.40121* 1250.96394 0.036 137.0281 9507.7743 CAÑAR 4834.29863* 1250.96394 0.035 148.9255 9519.6718 CARCHI 4851.08578* 1250.96394 0.034 165.7126 9536.4589 COTOPAXI 4676.7193 1250.96394 0.051 -8.6538 9362.0924 CHIMBORAZ
O 3681.69987 1250.96394 0.352 -1003.6733 8367.073 EL ORO 4817.79522* 1250.96394 0.036 132.4221 9503.1684 ESMERALDA
14 GALAPAGOS 4861.95386* 1250.96394 0.033 176.5807 9547.327 SUCUMBIOS 4848.93211* 1250.96394 0.034 163.559 9534.3052 ORELLANA 4857.32828* 1250.96394 0.033 171.9551 9542.7014
SANTO DOMINGO DE LOS TSACHILAS
4829.01268* 1250.96394 0.035 143.6396 9514.3858
SANTA
ELENA 4759.07554* 1250.96394 0.042 73.7024 9444.4487 Table #4: Tukey comparison of total building in millions.
The table #4 represents a comparison of Pichincha province with other provinces of Ecuador, since this is really unlike investment in construction it is unlike than the others. In this case the significant difference of P >0.05 as shown in the table value has a difference with: Tungurahua, Manabi, Loja, Guayas, Cotopaxi, y Azuay.
15 TSACHILAS
BOLIVAR 51.7988
EL ORO 56.4048
SANTA ELENA 115.1245
IMBABURA 167.735
COTOPAXI 197.4807 197.4807
LOJA 278.2955 278.2955
MANABI 314.1061 314.1061
AZUAY 314.3906 314.3906
CHIMBORAZO 1192.5002 1192.5002 TUNGURAHUA 1208.1957 1208.1957
GUAYAS 1671.2082 1671.2082
PICHINCHA 4874.2
Sig. 1 0.051
Table #5: Tukey Analysis
In the table #5 the Tukey analysis shows that the provinces classified into two sectors where it might also assume Pichincha as a single sector since the difference of investment building area is too high compared with low and medium level. Cotopaxi, Loja, Manabí, Azuay, Chimborazo, Tungurahua and Guayas are located in the second group is that of the medium investment and therefore other provinces covers a low investment compared to the two aforementioned groups.
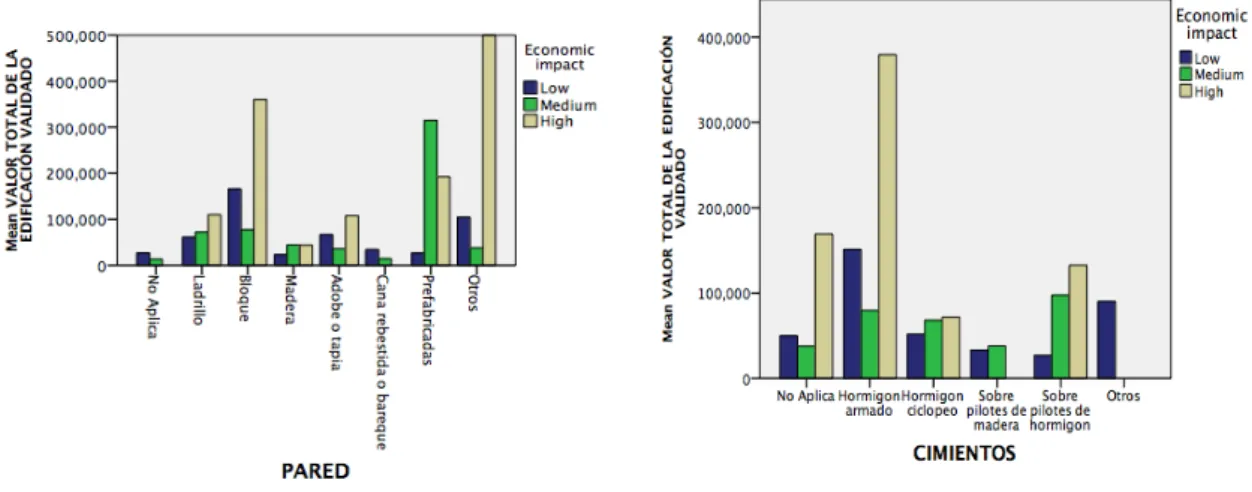
16 Figure #4: Characterization of structure and drape classified according the amount of money invested per provinces in construction.
Based on the results of Tukey it was characterized the type of structure and Time Slider among those that stand out is the reinforced concrete and metal structures. These materials despite their high cost in the market are the most recommended to build in Ecuador since the materials are seismic resistant and our country is in a highly seismic area.
Figure #5: Characterization of structure and drape classified according the amount of money invested per provinces in construction.
17 Table #6: Characterization by type of property
Figure #4: Building property comparison about private and public investment in the last 5 years.
18 relevant income for the economy every year and it is not based on the public investment.
CONCLUSION
During the last 5 years, the construction in Ecuador has grown considerably. As was showed, not all provinces have the same amount of investment in this sector but excel the most important as Pichincha, Guayas, Azuay and Manabí that according to the results shown by tukey in SPSS, are the provinces with the highest investment in this sector taking into account the private and public buildings. Certainly helps the development of the country because of this sector depend many providers of materials.
In Ecuador the construction in the private and public sector is the main sector that makes up the GDP, represented in 2013 the 9.90% stake. Other major sectors include services, Wholesale and retail and Manufacturing. It is very important to analyze the inflation because higher prices generated great uncertainty about the economic stability of the country, which affects the construction of infrastructure at the public level. The rise in prices of building materials limited budgets for creation of roads, schools, hospitals and increasingly make the less dynamic development and public works and the creation of centers and adequate space is difficult to improve quality of life of rural populations.
19 a large decrease in real estate investment because people are afraid to borrow mortgages that are not sure they can afford. On the other hand, banking limits the possibilities of access to credit and filters to people who actually have a credit profile increasingly higher incomes. Thus, rising prices of real estate, the demand is terribly affected and homes, offices and other goods will not be seen more as a profitable and safe investment.
And as a result Figure # 4, The main element that will impact on the economic stage of construction this year is a drop in gross fixed capital formation (investment in construction, machinery, equipment, etc.), which has been shrinking since 2011, the biggest drop since the Ecuadorian economy was dollarized. This is due mainly to a decline in public investment, which directly impacts the construction sector, which according to INEC grow this year 0%. Private investment, key in a resort like the year 2015, could also be affected after the president of Ecuador referred to the project to raise the Inheritance Tax to business sectors that creates uncertainty and discourages investment and family business.
21 REFERENCES
2014, L. c. (marzo de 2015). Portafolio. Obtenido de http://www.portafolio.co/economia/pib-colombia-2014-3
AENOR. (February de 2015). Construcción, sector clave para levantar la economía
ecuatoriana en este 2015 Este contenido ha sido publicado originalmente por Revista Líderes en la siguiente dirección: http://www.revistalideres.ec/lideres/construccion-sector-clave-economia-ecuador.html. Si está pensando en hacer uso del mismo, por favor, cite la fuente y haga un enlace hacia la nota original de donde usted ha tomado este contenido.
ElComercio.com. Obtenido de Construcción, sector clave para levantar la economía ecuatoriana en este 2015 Este contenido ha sido publicado originalmente por Revista Líderes en la siguiente dirección:
http://www.revistalideres.ec/lideres/construccion-sector-clave-economia-ecuador.html. Si está pensando en hacer uso del mismo, por favor, cite la fuente y haga un enlace hacia la nota original de donde usted ha tomado este contenido. ElComercio.com: http://www.revistalideres.ec/lideres/construccion-sector-clave-economia-ecuador.html
Coremberg, A. A. (2006). PROGRAMA DE FORTALECIMIENTO INSTITUCIONAL DE LA
SECRETARÍA DE POLÍTICA ECONÓMIC.MINISTERIO DE ECONOMÍA Y PRODUCCIÓN
SECRETARÍA DE POLÍTICA ECONÓMICA.
DANE. (s.f.). CUENTAS TRIMESTRALES DEL PRODUCTO INTERNO BRUTO. Obtenido de https://www.dane.gov.co/files/investigaciones/boletines/pib/bol_PIB_Itrime14.pdf
Economica, M. C. (Marzo de 2014). Indicadores Macroeconomicos. Obtenido de Ecuador Economico:
http://www.politicaeconomica.gob.ec/wp-content/uploads/downloads/2013/02/enero-2013.pdf
Ham, S. (2012). Construction Business Cycle Analysis Using the Regime Switching Model.
INEC. (2013). iNFORME ANUAL DE EDIFICACIONES. Obtenido de
http://www.ecuadorencifras.gob.ec/documentos/web-inec/Estadisticas_Economicas/Encuesta_Edificaciones/Publicaciones/Edificaciones_2013.pdf
Kothari, C. (1990). Reaserch Methology (Vol. 2). Jaipur, India: NEW AGE INTERNATIONAL (P) LIMITED, PUBLISHERS .
MDI. (2013). ANALISIS MACROECONÓMICO.
MUNDO, E. (2011). El peso de la construcción en el PIB se sitúa en el 9,2% en 2010 y vuelve a niveles de 2003. Obtenido de
http://www.elmundo.es/elmundo/2011/07/21/suvivienda/1311270683.html
Naveda, V. (Mayo de 2013). El sector de la construcción Ecuador. Obtenido de Bienes raices clave:
http://www.clave.com.ec/956-El_sector_de_la_construcción_Ecuador_Colombia_y_Perú.html
Park, J. (2012). Model, Construction Business Cycle Analysis Using the Regime Switching.
22
Weinan Bai, Q. Q. (2014). An analysis of decoupling of economic development and environmental pressure based on the park level: a case of TEDA.