Experimental and chemometric strategies for the development of Green Analytical Chemistry (GAC) spectroscopic methods for the determination of organic pollutants in natural waters
43
0
0
Texto completo
(2) The development of Green Analytical Chemistry (GAC) methods is one of the most active areas of Green Chemistry. Especially relevant are GAC methods devoted to the detection and quantification of environmental pollutants, because they should not pollute the environment more than the analyte to be determined. While considerable attention has been paid to develop environmentally friendly alternatives for the first stage of the global analytical process (e.g., sample preparation techniques), relatively fewer works are dedicated to implement green approaches for obtaining the analytical signal. Current strategies that are based on the principles of Green Chemistry for the determination of common organic pollutants in natural waters are detailed. The review collects and discusses selected publications from about the last 5 years relating to the topic, highlighting the role of multivariate calibration as a modern and very useful tool to achieve the pursued objectives.. Keywords: Green analytical chemistry Spectroscopy Organic pollutants Environmental waters. 2.
(3) Contents 1. Introduction 2. Multivariate calibration 3. Spectroscopic signals 3.1. Luminescence in organized media 3.1.1. Determinations assisted by chemometric 3.2. Solid-phase spectroscopy 3.2.1. Solid-phase spectroscopy in batch configuration 3.2.2. Flow-through optosensors 3.3. Photoinduced luminescence 4. Separative methods 4.1. Chromatographic analysis 4.1.1. Chromatographic analysis assisted by chemometrics 4.2. Capillary electrophoresis 5. Concluding remarks. 4 6 8 10 13 13 14 18 20 22 22 23 30 32. Abbreviations: ALS, alternating least-squares; BTZ, Bentazone; CA, calix[n]arene; CBZ, Carbamazepine; CD, Cyclodextrin; CIP, Ciprofloxacin; COW, Correlation optimized warping alignment algorithm; DAD, Diode array detector; DAI, daidzein; EDDP, 2-ethylidene-1,5dimethyl-3,3-diphenylpyrrolidine; EEFMs, excitation-emission fluorescence matrices; EEPIFM, Excitation-emission photoinduced fluorescence matrix; E3, Estriol; E2, 17βEstradiol; EE2, 17α-Ethinylestradiol; E1, Estrone; FLD, Fluorimetric detection; GAC, Green Analytical Chemistry; GC, gas chromatography; GC-MS/MS, Gas chromatography-mass spectrometry; GEN, Genistein; LC, Liquid chromatography; LC-DAD, Liquid chromatography coupled to diode array detector; LC–MS/MS, Liquid chromatography coupled to tandem mass spectrometry; LOD, Limit of detection; MCL, Maximum contaminant level; MCR, Multivariate curve resolution; MCRtril, Multivariate curve resolution with trilinearity constraint; MDA, 3,4-Methylenedioxyamphetamine; MDEA, 3,4Methylenedioxyethamphetamine; MDMA, 3,4-Methylenedioxymethamphetamine; MET, Methamphetamine; MLC, Micellar liquid chromatography; MW, Mineral water; N-PLS/RBL, Multidimensional partial least squares/residual bilinearization; OFL, Ofloxacin; PAH, Polycyclic aromatic hydrocarbon; PARAFAC, Parallel factor analysis; PIF, Photoinduced fluorescence; PX, Piroxicam; PLS, Partial least-squares; PSE, pseudoephedrine; RDSE, Rotating disk sorptive extraction; RS, River sediment; RW, River water; SDS, sodium dodecylsulfate; SPS, Solid-phase spectroscopy; SW, Surface water; SWATLD, Self-weighted alternating trilinear decomposition; TBT, Tributyltin; TW, tap water; U-PLS/RBL, Unfolded partial least squares/residual bilinearization; US-EPA, United State Environmental Protection Agency; UW, underground water; W, water; WW, wastewater; WWTPI, wastewater treatment plant influent; WWTPE, wastewater treatment plant effluent.. 3.
(4) 1.. Introduction. The term Green Chemistry emerged from the Pollution Prevention Act that was enacted in 1990 in the United States, and refers to the design of chemical products and processes that reduce or eliminate the use or generation of hazardous compounds (US-EPA, 2015). Although in early years Green Chemistry was mainly oriented to the planning of organic synthesis, the application of Green Chemistry concepts was gradually extended to other areas such as analytical chemistry. In fact, with the purpose of generating environmentally friendly methods without affecting their accuracy, sensitivity, and reproducibility, in the late 1990s the Green Analytical Chemistry (GAC) concept arose. In 1998, Anastas and Warner proposed the twelve principles of the Green Chemistry (Anastas and Warner, 1998) and, in 2001 Namieśnik selected those having priority for the development of GAC methods (Namieśnik, 2001). These principles include the reduction or elimination of the use of organic solvents, the reduction of gaseous, liquid and solid wastes, the disposal of toxic or eco-toxic reagents, and reduction in power consumption. In 2013, Gałuszka et al. proposed twelve principles as a guide for the development of new environmentally friendly methods (Gałuszka et al., 2013), and many researchers began to offer novel strategies to implement these new concepts (de la Guardia and Garrigues, 2014), including the idea that the simpler the analytical procedure, the greener (Koel, 2016). It is important to point out that chemists have different tools to assess the greenness of analytical procedures (Gałuszka et al., 2012; Tobiszewski et al., 2015a; Tobiszewski, 2016). A variety of approaches can be used to reduce environmental pollution caused during the whole analytical process. These strategies focus on the various stages of this process,. 4.
(5) which can be summarized in: (1) sample collection and preparation, (2) acquisition of analytical signals and (3) data processing (Molina-Díaz et al., 2010). Sample preparation is, perhaps, the analytical step that has received more attention in developing greener approaches for the determination of environmental pollutants, and numerous reviews and articles have been published on the subject (Gałuszka et al., 2012; Tobiszewski et al., 2010; Farré et al., 2010; Armenta et al., 2015). This fact is not surprising because: (1) sample pre-treatment is considered the most polluting step since the use of organic solvents is required for removing interferents and for concentrating the target compounds, which are generally present in trace levels (Tobiszewski et al., 2010), and (2) the most frequent methods for pollutant determination are chromatographic, which generally require rigorous clean-up and extraction processes of the environmental samples. Among green extraction methods which avoid a large consumption of organic solvents we can mention: solid-phase-extraction with adsorption membranes, liquid-phase-extraction, stir-bar. sorptive-extraction,. subcritical-water. extraction,. ultrasound-assisted-extraction,. supercritical-fluid-extraction,. solid-phase-microextraction,. thin-film-microextraction,. dispersive liquid-liquid- microextraction, and microextraction in packed syringe (Tobiszewski et al., 2009; Duarte et al., 2014; Spietelun et al., 2013; Tobiszewski et al., 2010). In comparison to the numerous GAC protocols for sample pre-treatment, relatively few articles are devoted to green acquisition of the analytical signals. In the present review, we will discuss different strategies employed in spectroscopic methods, especially those based on molecular luminescence, and those variables capable to positively modify the intensity of the signals in order to decrease or avoid the use of organic solvents. Finally, the relationship between the last stage of the analytical process (data treatment) and Green Chemistry was consolidated from the introduction of multivariate. 5.
(6) calibration in quantitative analysis, and a brief explanation of this type of calibration will be given below (Mas et al., 2010). It is desirable that Green Chemistry principles are taken into account in the entire analytical procedure, especially considering that in many cases the different stages are closely related. For example, the acquisition of second- or third-order data during the measurement step leads to their chemometric processing and successful results can be obtained without an exhaustive treatment of the sample. In other words, the correct choice of the method and data treatment results in a drastically simplified sample processing step.. 2.. Multivariate calibration. Multivariate calibration methods involve the use of mathematical models that relate multivariate instrumental signals with analyte concentrations or sample properties (Massart et al., 1997). In contrast to zeroth-order (univariate) calibration, where a single instrumental response per sample is recorded and analyzed, first-, second- and third-order (multivariate) calibrations work with multiple signals for each sample (Olivieri and Escandar, 2014). In fact, calibrations can be classified as shown in Table 1.. Table 1 Classification of single and multiple samples arrangements and calibration type.a Data order. One sample. Sample set array. Calibration type. Zero. Scalar. One-way. Univariate. First. Vector. Two-way. Second. Matrix. Three-way. Third. Three-way. Four-way. a. Multivariate Multi-way. Only the cases discussed in this review are included.. 6.
(7) Zeroth-order calibration is performed with instruments that produce a single response per sample (e.g. absorbance or fluorescence emission at a single wavelength). First-order calibration is carried out with data for a single sample which can be arranged as a vector (e.g. UV–vis spectrum, fluorescence emission spectrum, etc). Besides, second-order calibration is performed with matrix data for a given sample (e.g. excitation-emission fluorescence matrices (EEFMs), absorption or fluorescence spectra evolving during kinetics of a chemical reaction, etc). If second-order data for a set of samples are joined into a three-dimensional array, the resulting object is known as a three-way data array. Finally, when additional modes are introduced, higher-order data are obtained. It should be noticed that two equivalent nomenclatures are used for describing data and the corresponding calibrations. For example, one could refer to either second-order or three-way calibration; the former expression focuses on the number of modes of a single sample (two modes, second-order data) whereas the latter on the number of modes of a sample set (three modes, three-way data). Specifically, in second-order calibration methods the analyzed instrumental response is a data matrix per sample. Although there are many different protocols for second-order data generation, excitation-emission fluorescence matrix (EEFM) data and chromatographic data with spectral detection are, by far, the most frequently employed by analysts (Olivieri and Escandar, 2014). An important advantage displayed by multiway calibration, which is closely related to GAC methods, is that the analyte contribution can be appropriately modelled, quantitatively estimated and resolved in the presence of unexpected constituents (potential interferences) in real samples, absent in the calibration phase (Booksh and Kowalski, 1994). This property is called the “second-order advantage" and avoids the major obstacle of traditional univariate calibration applied to complex samples: the requirement of interference removal before the quantitative analytical method is applied (Olivieri, 2008). Useful reports about second- and. 7.
(8) higher-order data generation and calibration algorithms usually employed can be found in the literature (Escandar et al., 2007; Escandar et al., 2014). In the following sections, the material was organized paying attention to recent articles reporting green strategies during the step of obtaining spectroscopic signal for the determination of organic pollutants in aquatic scenarios.. 3. Spectroscopic signals. Spectroscopic measurements such as UV-visible absorption and luminescence emission should have a notorious place the environmental analysis because they allow for operational simplicity and low cost. In addition, methods based on luminescence signals have high sensitivity. However, the resulting spectra are often affected by spectral interferences, which hinder their application in the analysis of complex matrices unless careful, but not necessarily green, cleaning and extraction procedures are applied (Mas et al., 2010). In such situations, as will be discussed below, the use of multivariate tools plays a fundamental role. In a recent work, the determination of the herbicide atrazin, a priority pollutant with carcinogenic and endocrine disruptor activities, as well as its two main metabolites, was carried out in natural waters through first-order UV-Vis absorption spectra data and partial least- squares (PLS) regression (do Amaral et al., 2014). Although the measurement stage was simple and the first-order calibration allowed the simultaneous determination of analytes with overlapping spectra, the analysis of natural waters was interfered by matrix effects and preliminary cleanup to the removal organic matter was needed. Methods based on fluorescence and phosphorescence signals are more sensitive and selective than those based on UV-visible absorption and, therefore, they are more favourable for the determination of pollutants in the aquatic environment (Das et al., 2012; Vega Morales. 8.
(9) et al., 2010). Unavoidably, however, luminescence methods are also prone to be affected by spectral interferences present in the investigated matrices. This is where the higher-order multivariate calibration is crucial in the development of green methods. An example of this statement is given by an approach for the determination at partper-trillion levels of tributyltin, the most toxic organotin species, in tap, river, lagoon and seawater samples, combining EEFM measurements of its morin complex and the selectivity of second-order chemometric MCR-ALS (multivariate curve resolution/alternating leastsquares) algorithm (Bravo et al., 2013). The quantification was probed in the presence of the main tributyltin degradation products, which produce a strong spectral overlapping, and of a pool of additional twenty-three metal ions. EEFMs and self-weighted alternating trilinear decomposition (SWATLD) algorithm were employed for the determination of two plant growth regulators (2-naphthoxyacetic acid and 1-naphthaleneacetic acid methylester) in soil and sewage samples (Qing et al., 2013). EEFMs and parallel factor analysis (PARAFAC) were used to discriminate and quantify in marine coastal waters and in the presence of humic substances the polycyclic aromatic hydrocarbons (PAHs) 2,3 dimethyl naphthalene, fluorene, phenanthrene, anthracene, pyrene, and benzo[a]anthracene, and the pesticides 2-phenylphenol and carbaryl (Ferretto et al., 2014). Another important issue to be considered in the development of green luminescent methods is that this type of signals is strongly influenced by the environment surrounding the analyte, including the solvent. Tobiszewski et al. presented an approach to select appropriate solvents according to greenness parameters (Tobiszewski et al., 2015b). A comparison of toxicological and hazard related data indicated that polar solvents such as water, glycerol, alcohols, acetone and carboxylic acids, which are characterized by high water solubility, low values of Henry's constants, moderate density and vapor pressures, should be preferentially. 9.
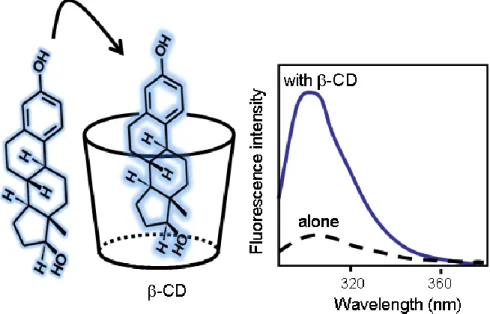
(10) chosen, because they are the environmentally safest. However, in general, signals are more intense in organic solvents of low polarity, and this fact represents a drawback from a green point of view. Therefore, in order to decrease or replace the solvent consumption and thus to transform classical luminescence techniques in real green methods, different resources have been applied, namely: luminescence in organized media, luminescence in solid-surface, and photoinduced luminescence.. 3.1. Luminescence in organized media. Cyclodextrins (CDs), micelles, and calix[n]arenes (CAs) are the most exploited organized media for analytical purposes. CDs are cyclic oligosaccharides with a hydrophilic outer surface (due to the presence of primary and secondary hydroxyl groups) and a hydrophobic inner cavity (given by glycosidic oxygen bridges and hydrogen atoms). Consequently, most CDs are soluble in water (a relevant issue from a "green" point of view), and are able to form noncovalent inclusion complexes with a wide variety of molecules that geometrically fit inside the cavity and are less polar than water (Szente and Szemán, 2013). The fact that complex formation frequently modifies the physicochemical properties of the included analytes has been exploited in different fields. In the area of molecular luminescence, CDs are often used as fluorescent signal boosters, enhancing the already significant sensitivity of molecular emission measurements (Fig. 1). On the other hand, normal-phase micelles are colloidal size aggregates of surfactant molecules with hydrophilic head regions in contact with the surrounding solvent and hydrophobic single-tail regions in the micelle centre. Micelles are able to organize molecules into their amphipathic compartments, forming micelle-host aggregates which modify the. 10.
(11) microenvironment experienced by a chromophore, and constituting the basis for their power to enhance spectroscopic phenomena.. Fig. 1. Schematic representation of the CD complex formation and its influence on the fluorescence spectrum of the included analyte.. Finally, CAs are macromolecules which have also been applied with analytical purposes. CAs are basket-shaped metacyclophanes able to interact with proper organic molecules to form complexes which could modify the guest physicochemical properties such as increasing its fluorescence emission (Pacioni et al., 2008). In conclusion, the properties of the organized media related with both their water solubility and the possibility of improving the spectral emission of different analytes make them attractive candidates for their use as green tools. The weak fluorescence signals in aqueous solution of estrone (E1), 17β-estradiol (E2), estriol (E3), and 17α-ethinylestradiol (EE2) were significantly enhanced by the presence of heptakis(2,6-di-o-methyl)-β-CD, and this fact was used to study the potentiality of developing green approaches for estrogen quantification (Pérez and Escandar, 2013). The linear dependence between the fluorescence response and the estrogen concentration was 11.
(12) investigated by building univariate calibration curves. The statistical parameters obtained from these curves, with limits of detection in the range of part-per-billion without using either derivatization reactions or toxic organic solvents, suggest that the studied organized medium is a good auxiliary reagent for estrogen determination maintaining the GAC principles. Both native and derivative CDs were also evaluated as fluorescence enhancers of endocrine disruptors belonging to the phenol derivatives, namely bisphenol A, 4-octylphenol and 4-nonylphenol (Pellegrino Vidal et al., 2015). Although these compounds are weakly fluorescent in aqueous solution, selected CDs, especially o-methyl β-CD derivatives, produce a remarkable enhancement of their fluorescence intensities and this fact could be employed for quantitative green purposes. A cross-linked CD-based polymer with enhanced affinity for diclofenac (a nonsteroidal anti-inflammatory drug considered an emerging pollutant) was used to quantify the analyte in a municipal wastewater sample (Xiao et al., 2015). The method was based on the competitive displacement of fluorescein (a fluorescent dye) by the target analyte monitored by fluorescence polarization. It was demonstrated that both aqueous solutions of cetyltrimethyl ammonium chloride micelles and single-walled carbon nanotube dispersions in a micellar medium given by the same surfactant produce a quenching effect in the fluorescence of fluorene (Palencia, et al., 2015). This fact was used for the determination of the PAH in a fortified wastewater sample through the standard addition method, and comparable limits of detection (about 1 ng mL–1) were obtained with both approaches. Benzo(a)pyrene, the most toxic and carcinogenic PAH, was quantified in tap, river, and potentially contaminated waters using a synchronous spectrofluorimetric technique in the presence of either β-CD or calix(8)arene as fluorescence enhancers (Abdel-Aziz et al., 2014). Detection limits of 380 and 12 ng L−1 were respectively obtained for the CD and CA systems,. 12.
(13) demonstrating that concentrations below the maximum contaminant level set by the Environmental Protection Agency (US-EPA) for this analyte (MCL = 200 ng L−1) could be measured following a green strategy.. 3.1.1. Determinations assisted by chemometrics The relatively weak fluorescence of galantamine, a widely used acetylcholinesterase inhibitor, was enhanced using a micellar medium formed by sodium dodecylsulfate (SDS) (Culzoni et al., 2010). The combination of EEFMs of the analyte in the presence of SDS with U-PLS/RBL (unfolded partial least-squares coupled to residual bilinearization) algorithm allowed the determination of this acetylcholinesterase inhibitor at part-per-billion levels in river, tap and well waters without the necessity to apply either extraction or pre-concentration steps. Bentazone (BTZ), which is the most used herbicide in crops of rice which, in turn, is one of the most consumed cereals in the world, emits a weak fluorescence in aqueous solution, but its signals were significantly enhanced in the presence of methyl-β-CD (Porini and Escandar, 2011). EEFMs of BTZ in the presence of that CD were processed by PARAFAC, allowing the quantification at part-per-billion levels in real water samples without preconcentration steps.. 3.2 Solid-phase spectroscopy. Analytes able to emit spectroscopic signals when they are immobilized in suitable solid supports gave origin to solid-phase spectroscopy (SPS) or to its equivalent solid-matrix spectroscopy. In turn, the SPS is the basis for the development of optical sensors, which contribute to Green Chemistry through their multiple advantages, such as sensitivity,. 13.
(14) versatility, possibility of on-line detection and miniaturization enabling at-site measurements and minimal waste production (Ibañez and Escandar, 2011; Wang et al., 2009). In their review, Molina-Díaz et al. exposed in detail the relevant contribution of SPS to the development of GAC methods (Molina-Díaz et al., 2010). The discussion involves a range of implementations, from simple ones carried out in batch, to more sophisticated techniques such as those based on flow methodologies. From a GAC point of view, the latter ones represent a reliable automatic alternative for reducing solvent, sample and reagent consumption, minimizing waste generation, and saving time, and have the ability to perform straightforward multi-component analysis. SPS measurements can be either directly performed after the analyte is retained in a solid support or measuring can be achieved by monitoring the optical signal of an auxiliary reagent (fluorophore, dye, enzyme, etc), whose response is modulated by the presence of the analyte. The reagent is generally immobilized in a matrix (thin polymer membrane, controlled-pore glass or microbeads) which is permeable to the analyte (Matsuoka and Yoshimura, 2010).. 3.2.1. Solid-phase spectroscopy in batch configuration In this configuration, the analyte is retained by adsorption either on a plane surface or in microbeads. In plane surfaces it is usual to deliver the analyte through the spotting of a few microliters of the sample in the support with the aid of micropipets, or through a solid-phase extraction procedure (Ibañez and Escandar, 2013). In the latter case, the active support is a membrane loaded into a stainless steel filter holder; applying a positive pressure with a syringe the sample solution is forced to pass through the disk. Disks with analytes retained on its surfaces are then placed in an appropriate reading cell/support, and the corresponding measurements are performed (Fig. 2).. 14.
(15) Fig. 2. Solid-phase extraction via a syringe procedure and reading cell for obtaining excitation (EX), emission (EM) fluorescence spectra or second-order excitation-emission fluorescence matrices (EEFMs) on the membrane surface.. Early implementations of SPS were performed using filter paper, silica gel, aluminum oxide, silicone rubber, sodium acetate, potassium bromide, and cellulose as common planesupports (Hurtubise, 1989). These materials were gradually replaced by C18-disks, nylon membranes and polymeric membranes, which in general improved sensor qualities. In fact, nylon membrane showed to be the only support, among those investigated, where BTZ displayed fluorescence signals (Chiarandini and Escandar, 2012). As stated above, BTZ is a widely used herbicide around the world, and its determination in the environment at low concentration levels is a topic of relevance. BTZ is weakly fluorescent in aqueous solution, but presents fluorescence in certain organic solvents, and also when the analyte is spotted on a nylon disk. The latter approach, coupled to second-order calibration,. 15.
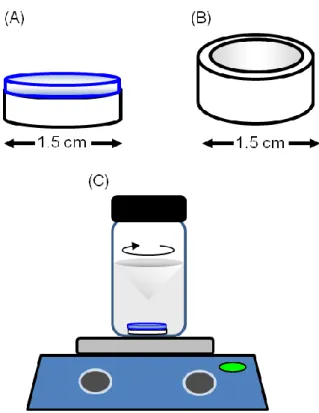
(16) gave rise to the development of a green and straightforward strategy which was used for the BTZ green quantification at sub-part-per-billion levels in natural waters. Recently, the fluorescent properties of estrogens adsorbed in solid supports were studied in order to develop GAC methods for their determination (Pérez and Escandar, 2015). After a solid-phase extraction procedure, both C18 and nylon membranes proved to be good supports for the fluorescence emission of E2, E2 valerate and EE2. A zeroth-order calibration using nylon membranes and aqueous solutions of estrogens allowed their spectrofluorimetric determination in pharmaceuticals containing large amounts of progestagen, as in most oral contraceptives. Besides, a second-order calibration through the measurement of EEFMs of E2 on the C18 surface was implemented for the quantification of this estrogen in fish and chicken tissues. The complex formation between tributyltin (TBT) and morin immobilized on a nylon membrane, in combination with second-order multivariate calibration, allowed the fluorimetric determination in natural waters of this organotin pollutant used in anti-fouling paints (Bravo et al., 2015). EEFMs for the TBT–morin complex directly measured in the solid surface were processed by U-PLS/RBL algorithm, allowing the successful determination in the presence of matrix interferences, and avoiding additional clean-up steps for their removal. In 2009, Richter et al. introduced an interesting extraction method called rotating disk sorptive extraction (RDSE), which proved to be very useful to perform SPS under the Green Chemistry principles (Richter et al., 2009). In its classical configuration, this technique involves the extraction of low-polarity analytes onto a rotating Teflon disk coated with a sorptive material (e.g., polydimethylsiloxane film, octadecyl membrane, nylon) in one of its sides (Fig. 3A). The disk has embedded a miniature magnetic rod, which allows rotation. A second RDSE configuration for more polar compounds consists of a disk that contains a. 16.
(17) cavity loaded with an extraction phase (e.g. Oasis® HLB, molecularly imprinted polymers) covered with a glass-fiber filter sealed with a Teflon ring (Fig. 3B).. Fig. 3. (A) Classic RDSE (rotating disk sorptive extraction) device in which a membrane is adhered to one side of the Teflon disk. (B) Rotating disk with a cavity in which an extraction phase is loaded and is then covered with a glass-fiber filter and sealed with a ring of Teflon. (C) Sample processing by RDSE.. An important characteristic of the first configuration is that, after extraction (Fig. 3C), the film can be detached from the rotating disk and placed into a specially designed holder for a direct spectroscopic measurement (Richter et al., 2011; Manzo et al., 2013). An important advantage of the RDSE method is that the recirculating regime prevents collapse of the filter in turbid samples, allowing to work with this type of systems. Recently, and taking advantage of the known ability of the nylon membrane to retain and. concentrate. PAHs. in. its. surface,. benzo[a]pyrene,. dibenz[a,h]anthracene,. benz[a]anthracene and chrysene were simultaneously extracted from the sample with a nylonbased RDSE device, and then determined by EEFMs, directly recorded on the nylon surface. 17.
(18) (Cañas et al., 2014). The studied PAHs were quantified with the aid of PARAFAC algorithm at part-per-trillion levels in a very interfering medium. Again, the coupling with a chemometric algorithm that achieves the second-order advantage makes it unnecessary the use of clean up steps for the removal of interfering compounds, avoiding environmentally unsafe organic solvents, and saving experimental time and operator efforts. When particulate materials are used in batch configurations, equilibrium is established between microbead active sites and the analyte. After either evaporating or filtering the solution in which the components were dissolved, beads are transferred to a specially designed spectrofluorimetric holding for the corresponding measurement (Ibañez and Escandar, 2013).. 3.2.2. Flow-through optosensors The contribution of flow-through optosensors to GAC lies in the numerous advantages these devices offer, such as online detection, miniaturization enabling at-site measurements and minimal waste production. In addition, in most flow-through optosensors the same solidphase placed in the cell is successively reused a number of times and an important amount of supplies and material are saved (Ibañez and Escandar, 2011). In simpler configurations, the solid phase is contained in the flow-cell and a carrier solution transports the sample containing the analyte in a continuous flow system. When the analyte reaches the solid support filling the flow-cell, its on-line immobilization is produced and its spectroscopic signal is measured. The coupling between flow-through optosensors and multivariate calibration presents attractive features from the point of view of GAC, such as the possibility of determining more than one analyte per sample and in the presence of potential interferents.. 18.
(19) Piccirilli and Escandar showed for the first time the potentiality of the second-order advantage of multivariate calibration on a flow-injection system, using silica gel C18 particles as sorptive material, for the determination of the fungicides thiabendazole and fuberidazol in underground, tap, mineral and river water samples (Piccirilli and Escandar, 2010). Briefly, sample solution containing the analytes in the presence of potential interferences were inserted into the carrier stream (water) and pumped through the flow system. The spectrofluorimeter was set-up in its kinetic mode, monitoring the fluorescence emission until the analytes arrived to the cell filled with the solid support where they were retained. When the maximum fluorescence signal was reached, the flow was stopped, the spectrofluorimeter was set-up in its scan 3D mode, and the corresponding EEFM was recorded. After these measurements, the kinetic mode was again selected, the flow was restored and both analytes were desorbed from the flow-through cell with a 40% v/v methanol–water mixture which was injected in the flow system by means of a second injection valve, and the signal returned to the baseline. Successful results were obtained after the U-PLS/RBL data treatment. Highlights of this work are: 1) the use of water as carrier, 2) eluent solution is the only organic solvent involved in the experimental procedure, 3) the time elapsed between consecutive injections (including the fluorescence matrix measurement) was only 5 min, 4) with the exception of river water samples, which were filtered through filter paper, the remaining water samples underwent no previous treatment. A more complex system constituted by six heavy PAHs in the presence of other ten interfering PAHs was subsequently resolved in contaminated river waters and activated sludges following a similar strategy using C18 particles as solid support and water as carrier (Bortolato et al., 2011). The studied analytes were benzo[a]pyrene, dibenz[a,h]anthracene, chrysene, benzo[b]fluoranthene, benzo[k]fluoranthene and benz[a]anthracene, which are highly toxic even at very low concentrations, and their adverse effects on wildlife and humans. 19.
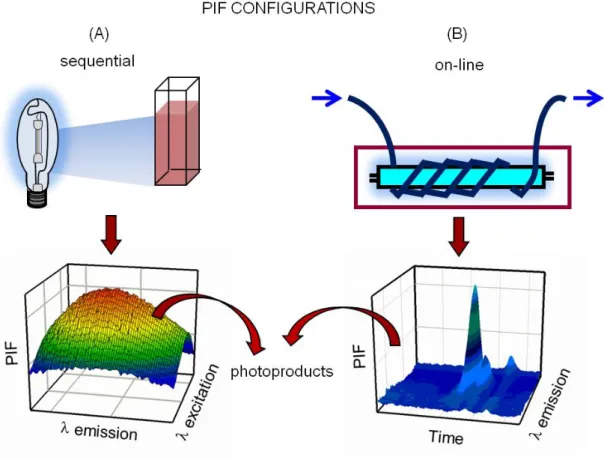
(20) justify the efforts of regulatory agencies to monitor and control their presence in the environment. U-PLS/RBL algorithm showed the best performance in resolving the studied system. Detection limits in the range of part-per-trillion were obtained in interfering samples, with a sample frequency of ca. 15 samples per hour, and with a minimum use of organic solvents, competing very favorably with chromatographic methods.. 3.3. Photoinduced luminescence. An alternative for producing or enhancing the fluorescence signals of poorly fluorescent compounds is to apply photochemically-induced fluorescence (PIF). In certain systems the fluorescent photoproduct is produced in aqueous solution increasing, in this way, the green properties of the method, but in other ones the photoreaction only occurs in organic media (Diaw et al., 2014; Mbaye et al., 2013). In the latter case, it is desirable that during the solvent selection step, in addition to the best fluorescent photoproduct intensity, the safety of the solvent is also considered. A PIF method in acidic solution was developed for the determination of carbamazepine (CBZ), a common emerging contaminant, in water samples (Lozano and Escandar, 2013). CBZ, an anticonvulsant drug widely used for the treatment of epilepsy and psychiatric diseases, is one of the most frequently detected pharmaceutical in sewagetreatment plant effluents, drinking and river waters (Petrović and Barceló, 2007; Loos et al., 2010). An acidic solution of CBZ was irradiated with an UV lamp (Fig. 4A), and the formed photoproducts were then spectrofluorimetrically quantified in the presence of other pharmaceuticals usually detected in the aquatic environment. The selectivity of the method was achieved through the coupling of second-order excitation-emission photoinduced. 20.
(21) fluorescence matrix (EEPIFM) data to multivariate calibration employing multivariate curve resolution-alternating least-squares (MCR-ALS) as adequate algorithm.. Fig 4. Sequential (A) and on-line (B) configurations for PIF signals, and the corresponding second-order data measured.. Three emerging pollutants belonging to the pharmaceutical group, namely the anticonvulsant CBZ, the antibacterial fluoroquinolone ofloxacin (OFL), and the non-steroidal anti-inflammatory piroxicam (PX), were simultaneously determined at trace levels in water samples using a sustainable photoinduced fluorescence (PIF) method without the need of chromatographic separation (Hurtado Sánchez et al., 2015). EEPIFMs were obtained after UV irradiation and then were processed with second-order algorithms. In this case, both PARAFAC and MCR-ALS in both augmentation modes rendered good results for OFL and PX but unsuitable predictions for CBZ. This fact was ascribed to the significant spectral. 21.
(22) overlapping between CBZ and PX signals. However, U-PLS/RBL was capable to overcome the problem and rendered good results even in complex real matrices. EEPIFMs were measured and also coupled to second-order calibration for the quantification of the neonicotinoid pesticide imidacloprid in tap, mineral, well, irrigation ditch and irrigation canal water samples (Fuentes et al., 2015). In the analyzed samples, both PARAFAC and U-PLS/RBL rendered reliable results.. 4. Separative methods. 4.1. Chromatographic analysis. It is well known that the most commonly employed analytical techniques for the quantification of organic pollutants are chromatographic ones, including from the more simple methods to tandem-liquid chromatography-mass spectrometry (LC-MS/MS) or gas chromatography-mass spectrometry (GC-MS/MS). For samples of complex composition, intensive efforts must be done for clean-up and fully resolving the chromatographic bands. In their interesting review, Płotka et al. presented the ways in which the different stages of both GC and LC procedures can become greener, analyzing options to reduce the environmental impact of each step of the chromatographic analysis (Płotka et al., 2013). According to their study, which was specifically related with the separation stage, a GC should be greener when hydrogen is used as carrier gas, thermal mass technology is applied, and the sample throughput is increased using shorter columns of smaller internal diameter. On the other hand, LC can be greener with the reduction of solvent consumption by reducing the mobile phase flow rate through the use of shorter columns of small internal diameter as in ultra-high performance liquid chromatography. The constitution of the mobile phase is also a. 22.
(23) key in the environmental friendliness of the LC method, supporting those containing water, acetone, methanol, and ethanol rather than acetonitrile. The use of supercritical fluids as mobile phase and monolothic columns as stationary phases can be considered as benign alternatives. Both two-dimensional GC (GC×GC) and LC (LC×LC) are greener than conventional one-dimensional techniques because they allow better separation of analytes in complex matrices with comparable reagents consumption and analysis time (Płotka et al., 2013). In accordance with environmentally friendly practice, Martínez Bueno et al. developed an LC–MS/MS method using a hybrid triple quadrupole-linear ion trap-mass spectrometer that allowed them the direct sample injection, without prior sample treatment, for the simultaneous quantification of 22 drugs of abuse in surface water, influent and effluent wastewater samples (Martínez Bueno et al., 2011). The appropriate selection of the mobile phase sometimes permits to reduce the environmental impact of a chromatographic analysis. For example, a micellar isocatric LC method, with a mobile phase constituted by a low amount of organic solvent (5% v/v 1pentanol) and harmless reagents (0.07 mol L–1 SDS and 0.01 mol L–1 phosphate buffer at pH 3), allowed the UV detection of four pesticides (thiabendazole, pyrimethanil, o-phenylphenol and imazalil) in citrus wastewaters (Peris-Vicente et al., in press). The features of the evaluated system allowed to perform a direct injection, with previous filtration, but without dilution, clean-up or extraction steps.. 4.1.1 Chromatographic analysis assisted by chemometrics The coupling of chromatographic analysis with chemometric tools gives rise to an interesting and very useful green alternative. The approach takes advantage of: (1) chromatography, allowing total or partial resolution of a large number of compounds and, (2). 23.
(24) second-order and third-order calibration, enabling mathematical resolution of incompletely resolved chromatographic bands and analyte determination in the presence of interferents. As was indicated, second-order data processed with appropriate algorithms possess the intrinsic advantage of dealing with the presence of interferences (second-order advantage) and thus cleaning processes of sample are avoided, with the concomitant benefit of decreasing the use of toxic solvents and time. In 2012, Arancibia et al. reviewed quantitative analytical works developed by processing second- and third-order chromatographic data and discussed the algorithms for processing these types of data (Arancibia et al., 2012). In the present work, we update this information and expose newly employed strategies. Briefly, chromatographic second-order data can be obtained by detection based on UV–visible/infrared. absorption,. fluorescence. excitation/emission. spectroscopies,. voltammetry, etc. The chromatograph itself provides the first data mode (the elution time) and the detector provides the second one (spectral wavelength or wavenumber, electric voltage, etc). Other chromatographic second-order data are given by two-dimensional liquid (LC–LC) and gas chromatography (GC–GC) with univariate detection, where each separating element provides an individual elution time mode to the recorded second-order data. Third-order data can be achieved by adding an extra mode to the recorded data, for example, by performing: (1) LC–LC or GC–GC followed by either multivariate UV–visible absorption or mass spectrometry detection, and (2) LC with detection of EEFM (Alcaráz et al., 2014). The lack of repeatability in the elution times between successive chromatographic runs is a problem inherent to the obtainment of this type of second- and third-order data, and represents a serious limitation when these data are analyzed with algorithms which require. 24.
(25) that the data show the property of tri- or quadric-linearity (Olivieri and Escandar, 2014; Bortolato et al., 2009). In the literature, some systems evaluated from liquid chromatography-diode array detector (LC-DAD) second-order data did not show trilinearity loss, and they could be resolved by typical second-order algorithms such as PARAFAC or RBL-based algorithms. Three pre-emergent herbicides (prometryne, napropamide and alachlor) were determined in river sediment and wastewater samples using a method based on the second-order calibration of LC-DAD data using the SWATLD algorithm (Qing et al., 2012). Eleven antibiotics in tap water samples were determined applying PARAFAC to LCDAD second-order data (Yu et al., 2013). In this latter case, good results were obtained through the chromatographic background drift correction using a strategy based on orthogonal spectral signal projection. In those cases where differential migration of the constituents in successive measurements originates dissimilarities in both elution times and peak shapes, as often it happens in complex systems, trilinearity property can be restored by applying pre-processing methods to align chromatographic bands (Bortolato et al., 2009; Bloemberg et al., 2013). A simpler resource for the treatment of second-order chromatographic data is the application of chemometric algorithms which do not require chromatographic alignment, such as MCR-ALS and PARAFAC2 (Kiers et al., 1999; Bro et al., 1999). MCR-ALS can easily solve the problem by resorting to the mathematical resource of matrix augmentation, conveniently performed in the temporal direction (which should be the one corresponding to potential profile changes), while PARAFAC2 (a variant of PARAFAC) is more flexible regarding changes in elution profiles from sample to sample, but is less useful in the presence of interferents (Escandar et al., 2014; Bortolato and Olivieri, 2014).. 25.
(26) The acquisition and analysis of third- and second-order data, through EEFMs measured at different elution times in a fast LC procedure was recently reported for the determination of ofloxacin and ciprofloxacin, two fluoroquinolones, in tap water samples (Alcaráz et al., 2014). Although both PARAFAC and MCR-ALS rendered good results when no peak time shifts occurred among samples, only MCR-ALS provided the better results when the quadrilinearity was lost due to the occurrence of temporal shifts. Inspired in the augmentation concept of MCR-ALS, and specifically in the augmentation along the elution time mode for chromatographic data, a new strategy to process third-order chromatographic data with matrix fluorescence detection, based on an Augmented PARAFAC model was proposed (Alcaráz et al., 2015). EEFMs measured at different. chromatographic. elution. times. were. employed. for. determining. three. fluoroquinolones (ofloxacin, ciprofloxacin, and danofloxacin) in tap, underground, and mineral waters. The performance of the proposed Augmented PARAFAC approach was shown to be as good as that for MCR-ALS for third-order chromatographic data, with the possibility of processing the measured data in the original three-dimensional structure, instead of unfolding the data to arrays of lower dimensions. MCR-ALS was the selected algorithm for the successful determination of the phytoestrogens daidzein and genistein (two potential emerging water contaminants) in river water using LC-DAD second-order data (Moreira et al., 2015). By implementation of the present chromatographic method, the operation time was reduced from 7.00 to 3.25 min, with the concomitant decrease in the amount of organic solvent (used as constituent of the mobile phase: acetonitrile:water 70:30, v/v mixture). A strategy based on second-order LC-DAD data coupled to MCR-ALS treatment was proposed for the determination of methamphetamine (a strong central nervous system. 26.
(27) stimulant) and pseudoephedrine (the most common starting material for clandestine methamphetamine synthesis) in ground water and river water samples (Vosough et al., 2014). MCR-ALS and U-PLS/RBL algorithms rendered comparable results when they were applied to the analysis of six antibiotics (amoxicillin, metronidazole, sulfamethoxazole, ofloxacine, sulfadiazine and sulfamerazine) in the sewage treatment plant influent and effluent samples (Vosough et al., 2015). Following the GAC principles, LC-DAD strategy involving MCR-ALS second-order data treatment was applied for the simultaneous determination of estrogens, which are the most potent endocrine disrupting compounds, in tap, mineral, underground and river water samples (Pérez and Escandar, 2014). Due to the fact that the studied estrogens (E3, E2, EE2 and E1) have very similar UV spectral profiles, MCR-ALS was performed with matrix augmentation in the temporal direction but dividing the elution time axis in four time regions, each one including a single analyte, in order to obtain spectral selectivity in each region. Although interferences were always present, the spectra were correctly distinguished, and the chromatographic bands were recognized as belonging to the corresponding estrogen and background or interferences. Thus, the use of the appropriate chemometric tool made it unnecessary to apply extraction and clean up steps for the removal of coeluting compounds, avoiding the use of additional organic solvents, and saving experimental time and operator effort. Very recently, natural and synthetic sex hormones, including seven estrogens, three progestagens and one androgen were determined in waters and sediments using LC with dual DAD and fluorimetric detection (FLD) and chemometric analysis carried out with MCR-ALS (Pérez and Escandar, 2016). While the dual detection, carried out in a single isocratic run, allowed to select the most appropriate signal for each analyte, second-order calibration. 27.
(28) enabled mathematical resolution of incompletely resolved chromatographic bands and analyte determination in the presence of interferents. It is important to recall that algorithms which require trilinearity but are more flexible in this regards (e.g. U-PLS/RBL and N-PLS/RBL) have also provided good results in some systems. As an example, U-PLS/RBL showed the best performance to quantify three ureaderivative herbicides (isoproturon, rimsulfuron and monuron) using a green LC-PIF secondorder calibration (Fig. 4B) (Arancibia and Escandar, 2014). In this work, a photoreactor, consisting of a polytetrafluoroethylene tube network coiled around an 8W mercury lamp, was applied for the post-column photoirradiation, and good recoveries were established in tap, river, and underground water samples. Determination of the pharmaceuticals carbamazepine,. naproxen, diclofenac,. gemfibrozil and mefenamic acid in well and river water samples was performed through an LC-DAD second-order approach (Akvan and Parastar, 2014). Due to the complexity of the investigated matrices and the presence of different chromatographic issues, the authors suggest two alternatives for data processing, obtaining similar results: 1) the use of MCR– correlation optimized warping (COW) alignment algorithm for chromatographic bands and a subsequent application of PARAFAC, and 2) the application of MCR-ALS with trilinearity constraint (MCR–COW–MCRtril). Seven fluoroquinolones were determined in environmental water samples by coupling yttrium-analyte complex and second-order calibration (Alcaráz et al., 2016). The method was based on the use of LC-FLD matrices, as second-order data processed by MCR-ALS algorithm. The enhancement in the fluorescence signals after the addition of yttrium allowed to reach LOD (limit of detection) values in the order of part per trillion without including a pre-concentration step. In Table 2 the above discussed chromatographic techniques for the determination of pollutants in water samples are summarized.. 28.
(29) Table 2 Recent examples of green chromatographic methods for pollutants in water analysis. Advantagea LODb. Reference. Stimulant/tranquilising LC-MS/MS with SW, WWTPI, drugs of abuse and a hybrid triple WWTPE metabolites quadrupole-linear ion trap-mass spectrometer. Direct sample 0.5-700 injection without prior sample treatment. Martinez Bueno et al., 2011. Pesticides. MLC-DAD. WW. Peris Vicente et al., 2016. Herbicides. LC-DADSWATLD 2nd OD LC-DADPARAFAC 2nd OD. RS, WW. Low amount 180-1400 of organic solvent; waste reduction c RS, 49-380 WW, 31-110. TW. c. Yu et al., 2013. EEFMs measured at different ETMCR-ALS 3rdand 2nd OD LC-DAD-MCRALS 2nd OD LC-DAD-MCRALS 2nd OD LC-DAD-MCRALS and LCDAD-UPLS /RBL 2nd OD. TW. c. RW. c. Analyte. Action. Nicotine, cotinine, morphine, paraxanthine, heroin, codeine, MDEA, ephedrine, EDDP, MET, acetylmorphine, amphetamine, MDA, caffeine, ethylmorphine, methadone, ethylamphetamine, MDMA, phenilephrine, ketamine, cocaine, benzoylecgonine Thiabendazole, imazalil, pyrimethanil, o-phenylphenol, Prometryne, napropamide, alachlor Sulfacetamide, sulfamerazine, sulfamethoxazole, tetracycline, pipemidic acid, danofloxacin, lomefloxacin, metronidazole, ornidazole, andoxytetracycline OFL, CIP. DAI, GEN. Phytoestrogens. MET, PSE. Drug of abuse and starting material Antibiotics. Amoxicillin, metronidazole, sulfamethoxazole, ofloxacine, sulfadiazine, sulfamerazine E3, E2, EE2, E1 E3, E2, EE2, E1, diethylstilbestrol, hexestrol, mestranol, progesterone, norethisterone, levonorgestrel, androstenedione OFL, ciprofloxacin, danofloxacin. Antibiotics. Fluoroquinolones (antibiotics). Methodology. Sample. 150-5560d. High OFL, 0.4; CIP, Alcaraz et al., sensitivity and 3.2 2014 selectivity. Operation DAI, 150; GEN time reduction 170 Well W, RW c MET, 0.08; PSE 0.06 c WWTPI, 0.05- 2.1 WWTPE. Estrogens. LC-DAD-MCR- TW, MW, ALS 2nd OD UW, RW. c. 0.003-0.013e. Estrogens, progestagens, androgen (sexual hormones). LC-DAD-FLDMCR-ALS 2nd OD. c. 0.006-0.024e. Fluoroquinolones (antibiotics). EEFMs measured TW, UW, MW c High 0.02-0.20 at different ETsensitivity and Augmented selectivity PARAFAC 3rd OD. MW, UW, RW, RS. Qing et al., 2012. Moreira et al., 2015 Vosough et al., 2014 Vosough et al., 2015. Pérez and Escandar, 2014 Pérez and Escandar, 2016. Alcaraz et al., 2015. 29.
(30) Table 2 (continued) Isoproturon, rimsulfuron, monuron Carbamazepine, naproxen, diclofenac, gemfibrozil, mefenamic acid. Urea-derivative herbicides. Enoxacin, norfloxacin, OFL, sarafloxacin, CIP, difloxacin, enrofloxacin. Fluoroquinolones (antibiotics). Pharmaceuticals. LC-PIFUPLS/RBL 2nd OD LC-DAD-MCRCOWPARAFAC; LCDAD-MCRCOW-MCRtril 2nd OD LC-FLD-MCRALS 2nd OD. TW, RW, UW. c. 1.7-2.9e. Well W, RW. c. 0.02-0.32. Well W, SW, WW. c. 0.05-4.7. High sensitivity given by yttrium(III) complexes. Arancibia and Escandar, 2014 Akvan and Parastar, 2014. Alcaraz et al., 2016. a. From the green point of view. b LOD (limit of detection), for comparison, concentration units were unified to ng mL–1. c Second-order advantage: simple sample pre-treatment; low consumption of organic solvents for cleaning, extraction and separation. d Evaluated concentrations. e The results refer to water samples before solid-phase extraction. Abbreviations: 2nd OD, second-order data; 3rd OD, third-order data; ALS, alternating least-squares; CIP, ciprofloxacin; COW, correlation optimized warping alignment algorithm; DAI, daidzein; EDDP, 2ethylidene-1,5-dimethyl-3,3-diphenylpyrrolidine; EEFMs, excitation-emission fluorescence matrices; E3, estriol; E2, 17β-estradiol; EE2, 17α-ethinylestradiol; E1, estrone; ET, elution time; FLD, fluorescence detector; GEN, genistein; LC-DAD, liquid chromatography coupled to diode array detector; LC–MS/MS, liquid chromatography coupled to tandem mass spectrometry; MCR, multivariate curve resolution; MCRtril, multivariate curve resolution with trilinearity constraint; MDA, 3,4-methylenedioxyamphetamine; MDEA, 3,4methylenedioxyethamphetamine; MDMA, 3,4-methylenedioxymethamphetamine; MET, methamphetamine; MLC, micellar liquid chromatography; MW, mineral water; OFL, ofloxacin; PARAFAC, parallel factor analysis; PIF, photoinduced fluorescence; PSE, pseudoephedrine; RS, river sediment; RW, river water; SW, surface water; SWATLD, self-weighted alternating trilinear decomposition; TW, tap water; U-PLS/RBL, unfolded partial least squares/residual bilinearization; UW, underground water; W, water; WW, wastewater; WWTPI, wastewater treatment plant influent; WWTPE, wastewater treatment plant effluent.. 4.2. Capillary electrophoresis. Although not fully recognized and playing a secondary role as a separation method in environmental analysis, capillary electrophoresis (CE) provides an appropriate alternative to improve the greenness of usual chromatographic techniques which, in general, consume large volumes of solvents (Kaljurand, 2012; Kaljurand and Koel, 2011; Koel and Kaljurand, 2006; Ballesteros-Gómez and Rubio, 2011). Indeed, CE involves minimal solvent consumption and, in addition, separations are conducted in harmless aqueous/buffer systems. Other feature that collaborates with the greenness of CE is the possibility of building a portable instrument, for example, with a high-voltage power supply and small light-emitting diodes (LEDs) for optical detection (Kaljurand, 2012).. 30.
(31) From the point of view of the green chemistry, no less important is that CE is a key technology for miniaturazing analytical separation methods, making use of lab-on-a-chip platforms (Kaljurand and Koel, 2011; Koel and Kaljurand, 2006), with special attention to the environmental analysis (Jokerst et al., 2012; Li and Lin, 2009). Comprehensive reviews devoted to capillary electrophoresis, which include theory, separation modes, instrumentation, and applications have been published by Bowser’s research group (Frost et al., 2010; Geiger et al., 2012; Harstad et al., 2016). The lack of broad CE acceptance in comparison with chromatographic methods could perhaps lie in the fact that CE is highly sensitive to parameter changes and therefore not very reproducible (Kaljurand and Koel, 2011). However, modern instrumentation has removed most of the variability issues, and the improvements in the CE equipment have given robustness and reliability to the method. On the other hand, CE detection limits are about 2–3 orders of magnitude higher than in LC, and this fact represents a limitation to the use of CE for trace pollutants determination. Therefore, the development of approaches to increasing sensitivity in CE, based on preconcentration steps or CE stacking. constitute an area of intensive research in environmental analysis (Ballesteros-Gómez and Rubio, 2011). A method involving low-voltage electromembrane extraction combined with cyclodextrin modified CE and UV detection was applied for the determination of three phenoxy acid herbicides (2,4-dichlorophenoxyacetic acid, 4-(2,4-dichlorophenoxy) butanoic acid, and 3,6-dichloro-2-methoxybenzoic acid) in river water samples (Tabani et al., 2013). The method was reproducible with intra and inter day relative standard deviations lower than 4.8 %, and limits of quantitation in the range of 30–40 ng mL–1. A CE method with DAD coupled to MCR-ALS was proposed as a nonchromatographic separative green method for the resolution and quantitation, in only 2.4 min and without using contaminant solvents, of six quinolones in tap water samples in the. 31.
(32) presence of several interferences (Alcaráz et al., 2014). The power of MCR-ALS was demonstrated, once again, to model data with severe deviations from the trilinearity, as frequently occurs with this type of data.. 5. Concluding remarks. The importance of reducing and/or eliminating the use and generation of hazardous compounds during all phases of the chemical analysis is categorical. There are different resources that can be applied by analysts to improve the green qualities of luminescent methods, without losing or affecting their basic analytical properties. The coupling to multivariate calibration contributes very significantly to the development of GAC methodologies. Green methods have been intuitively developed even before the term was consolidated under the twelve known principles and, currently, many researchers develop environmental friendly methodologies without including them within that category. However, it is important that analytical chemists are familiar with the terms and concepts involving green practices, and contribute to disseminate them, evidencing in this sense, their commitment to society.. Acknowledgment The authors are grateful to the Universidad Nacional de Rosario, Consejo Nacional de Investigaciones Científicas y Técnicas (CONICET, Project PIP 0163), and Agencia Nacional de Promoción Científica y Tecnológica (PICT 2013-0136) for the financial contribution in this work.. 32.
(33) References Abdel-Aziz, O., El Kosasy, A.M., El-Sayed Okeil, S.M., 2014. Novel comparative synchronous spectrofluorimetric study of benzo(a)pyrene using beta-cyclodextrin and calix(8)arene as fluorescence enhancers, J. Fluoresc. 24, 549–556. Akvan, N., Parastar, H., 2014. Second-order calibration for simultaneous determination of pharmaceuticals in water samples by solid-phase extraction and fast high-performance liquid chromatography with diode array detector. Chemom. Intell. Lab. Syst. 137, 146–154. Alcaráz, M.R., Siano, G.G., Culzoni, M.J., Muñoz de la Peña, A., Goicoechea, H.C. 2014., Modeling four and three-way fast high-performance liquid chromatography with fluorescence detection data for quantitation of fluoroquinolones in water samples. Anal. Chim. Acta 809, 37–46. Alcaráz, M.R., Bortolato, S.A., Goicoechea, H.C., Olivieri, A.C., 2015. A new modeling strategy for third-order fast high-performance liquid chromatographic data with fluorescence detection. Quantitation of fluoroquinolones in water samples. Anal. Bioanal. Chem. 407, 1999–2011. Alcaráz, M.R., Culzoni, M.J., Goicoechea, H.C., 2016, Enhanced fluorescence sensitivity by coupling yttrium-analyte complexes and three-way fast high-performance liquid chromatography data modeling. Anal. Chim. Acta 902, 50–58. Alcaráz, M.R., Vera-Candioti, L., Culzoni, M.J., Goicoechea, H.C. 2014. Ultrafast quantitation of six quinolones in water samples by second-order capillary electrophoresis data modeling with multivariate curve resolution–alternating least squares, Anal. Bioanal. Chem. 406, 2571–2580. Anastas, P.T, Warner, J.C., 1998. Green Chemistry: Theory and practice, Oxford University Press.. 33.
(34) Arancibia, J.A., Damiani, P.C., Escandar, G.M., Ibañez, G.A., Olivieri, A.C., 2012. A review on second- and third-order multivariate calibration applied to chromatographic data. J. Chromatogr. B 910, 22–30. Arancibia, J.A., Escandar, G.M., 2014. Second-order chromatographic photochemicallyinduced fluorescence emission data coupled to chemometric analysis for the simultaneous determination of urea herbicides in the presence of matrix co-eluting compounds. Anal. Methods 6, 5503–5511. Armenta, S., Garrigues, S., de la Guardia, M., 2015. The role of green extraction techniques in Green Analytical Chemistry. Trends Anal. Chem. 71, 2–8. Ballesteros-Gómez, A., Rubio, S., 2011. Recent advances in environmental analysis, Anal. Chem. 83, 4579–4613. Bloemberg, T.G., Gerretzen, J., Lunshof, A., Wehrens, R., Buydens, L.M.C., 2013. Warping methods for spectroscopic and chromatographic signal alignment: A tutorial, Anal. Chim. Acta 781, 14–32. Booksh, K.S., Kowalski, B.R., 1994. Theory of analytical chemistry. Anal. Chem. 66, 782A– 791A. Bortolato, S.A., Arancibia, J.A., Escandar, G.M., 2011. Chemometrics–assisted fluorimetry for the rapid and selective determination of heavy polycyclic aromatic hydrocarbons in contaminated river waters and activated sludges. Environmental Sciences and Technology 45, 1513–1520. Bortolato, S.A., Arancibia, J.A., Escandar, G.M., 2009. Non-trilinear chromatographic time retention–fluorescence emission data coupled to chemometric algorithms for the simultaneous determination of ten polycyclic aromatic hydrocarbons in the presence of interferences. Anal. Chem. 81, 8074–8084.. 34.
(35) Bortolato, S.A., Olivieri, A.C., 2014, Ultra performance liquid chromatography tandemmass spectrometry performance evaluation for analysis of antibiotics in natural waters. Anal. Chim. Acta 842, 11–19. Bravo, M.A., Aguilar, L.F., Quiroz, W., Olivieri, A.C., Escandar, G.M., 2013. Determination of tributyltin at parts-per-trillion levels in natural waters by second-order multivariate calibration and fluorescence spectroscopy. Microchem. J. 106, 95–101. Bravo. M.A., Escandar,G.M., Olivieri, A.C., Bardina, E., Aguilar, L.F., Quiroz, W., 2015. A novel application of nylon membranes for tributyltin determination in complex environmental samples by fluorescence spectroscopy and multivariate calibration. Chemom. Intell. Lab. Syst. 148, 77–84. Bro,. R.,. Anderson,. C.A.,. Kiers,. H.A.L.,. 1999.. PARAFAC2-Part. II.. Modeling. chromatographic data with retention time shifts. J. Chemom. 13, 295–309. Cañas, A., Richter, P., Escandar, G.M., 2014. Chemometrics-assisted excitation–emission fluorescence. spectroscopy. on. nylon-attached. rotating. disks.. Simultaneous. determination of polycyclic aromatic hydrocarbons in the presence of interferences. Anal. Chim. Acta 852, 105–111. Chiarandini, J.P., Escandar, G.M., 2012. Nylon membrane as a fluorimetric probe for the herbicide bentazone, Anal. Bioanal. Chem. 402, 2221–2225. Culzoni, M.J., Aucelio, R.Q., Escandar, G.M., 2010. Spectrofluorimetry in organized media coupled to second-order multivariate calibration for the determination of galantamine in the presence of uncalibrated interferences, Talanta 82, 325–332. Escandar, G.M., Faber, N.M., Goicoechea, H.C., Muñoz de la Peña, A., Olivieri, A.C., Poppi, R.J., 2007. Second- and third-order multivariate calibration: data, algorithms and applications. Trends Anal. Chem. 26, 752–765.. 35.
(36) Escandar, G.M., Goicoechea, H.C., Muñoz de la Peña, A., Olivieri, A.C., 2014. Second- and higher-order data generation and calibration: A tutorial. Anal. Chim. Acta 806, 8–26. EPA United State Environmental Protection Agency, Basics of Green Chemistry, 2015 (http://www.epa.gov/greenchemistry/basics-green-chemistry) (accessed 11.04.16). Das, S., Powe, A.M., Baker, G.A., Valle, B., El-Zahab, B., Sintim, H.O., Lowry, M., Fakayode, S.O., McCarroll, M.E., Patonay, G., Li, M., Strongin, R.M., Geng, M.L., Warner,. I.M.,. 2012.. Molecular. fluorescence,. phosphorescence,. and. chemiluminescence spectrometry. Anal. Chem. 84, 597–625. de la Guardia, M., Garrigues, S., 2014. The social responsibility of environmental analysis, Trends Environ. Anal. Chem. 3–4, 7–13. Diaw, P.A., Mbaye, O.M.A., Gaye-Seye, M.D., Aaron, J.J., Coly, A., Tine, A., Oturan, N., Oturan, M.A., 2014. Photochemically-induced fluorescence properties of two benzoyland phenylurea pesticides and determination in natural waters. J Fluoresc. 24, 1319– 1330. do Amaral, B., de Araujo, J.A., Peralta-Zamora, P.G., Nagata, N., 2014. Simultaneous determination of atrazine and metabolites (DIA and DEA) in natural water by multivariate electronic spectroscopy. Microchem. J. 117, 262–267. Duarte, K., Justino, C.I.L., Gomes, A.M., Rocha-Santos, T., Duarte, A.C., 2014. Green analytical methodologies for preparation of extracts and analysis of bioactive compounds. Compr. Anal. Chem. 65, 59–78. Farré, M., Pérez, S., Gonçalves, C., Alpendurada, M.F., Barceló, D., 2010. Green analytical chemistry in the determination of organic pollutants in the aquatic environment. Trends Anal. Chem. 29, 1347–1362. Ferretto, N., Tedetti, M., Guigue, C., Mounier, S., Redon, R., Goutx, M., 2014. Identification and quantification of known polycyclic aromatic hydrocarbons and pesticides in. 36.
(37) complex mixtures using fluorescence excitation–emission matrices and parallel factor analysis. Chemosphere 107, 344–353. Frost, N.W., Jing, M., Bowser, M.T., 2010. Capillary electrophoresis, Anal. Chem. 82, 4682– 4698. Fuentes, E., Cid, C., Báez, M.E., 2015. Determination of imidacloprid in water samples via photochemically induced fluorescence and second-order multivariate calibration. Talanta134, 8–15. Gałuszka, A., Konieczka, P., Migaszewski, Z., Namieśnik, J., 2012. Analytical eco-scale for assessing the greenness of analytical procedures. Trends Anal. Chem. 37, 61–72. Gałuszka, A., Migaszewski, Z., Namieśnik, J., 2013. The 12 principles of green analytical chemistry and the SIGNIFICANCE mnemonic of green analytical practices. Trends Anal. Chem. 50, 78–84. Geiger, M., Hogerton, A.L., Bowser, M.T., 2012. Capillary electrophoresis, Anal. Chem. 84, 577–596. Harstad, R.K., Johnson, A.C., Weisenberger, M.M., Bowser, M.T., 2016 Capillary electrophoresis, Anal. Chem. 88, 299–319. Hurtado Sánchez, M.C., Lozano, V.A., Rodríguez Cáceres, M.I., Durán Merás, I., Escandar, G.M. 2015. Green analytical determination of emerging pollutants in environmental waters using excitation-emission photoinduced fluorescence data and multivariate calibration, Talanta, 134, 215–223. Hurtubise, R.J., 1989. Solid-surface luminescence spectrometry. Anal. Chem. 61, 889A– 895A. Ibañez, G.A., Escandar, G.M., 2011. Luminescence sensors applied to water analysis of organic pollutants—An update, Sensors 11, 11081–11102.. 37.
(38) Ibañez, G.A., Escandar, G.M., 2013. Fluorescence and phosphorescence chemical sensors applied to water samples, Smart Sensors for Real-Time Water Quality Monitoring, S.C. Mukhopadhyay, A. Mason (Eds.), Springer, New York, Cap. 3, 45–64. Jokerst, J.C., Emory, J.M., Henry, C.S., 2012. Advances in microfluidics for environmental analysis, Analyst 137, 24–34. Kaljurand, M., Koel, M., 2011. Green analytical separation methods. In: de la Guardia, M., Garrigues, S. (Eds.), Challenges in Green Analytical Chemistry, RSC Publishing, Cambridge, UK, ch. 7. Kaljurand, M., 2012. Capillary electrophoresis. In: de la Guardia, M., Garrigues, S. (Eds.), Handbook of Green Analytical Chemistry, Wiley, Chichester, UK, ch. 9. Kiers, H.A.L., Ten Berge, J.M.F., Bro, R., 1999. PARAFAC2-Part I. A direct fitting algorithm for the PARAFAC2 model. J. Chemom. 13, 275–294. Koel, M., Kaljurand, M., 2006, Application of the principles of green chemistry in analytical chemistry, Pure Appl. Chem.78, 1993–2002. Koel, M., 2016. Do we need Green Analytical Chemistry? Green Chem. 18, 923–931. Li, H.F., Lin, J.M., 2009. Applications of microfluidic systems in environmental analysis, Anal. Bioanal. Chem. 393, 555–567. Loos, R., Locoro, G., Comero, S., Contini, S., Schwesig, D., Werres, F., Balsaa, P., Gans, O., Weiss, S., Blaha, L., Bolchi, M., Gawlik, B.M., 2010. Pan-European survey on the occurrence of selected polar organic persistent pollutants in ground water. Water Res. 44, 4115–4126. Lozano, V.A., Escandar, G.M., 2013. Second-order advantage with excitation-emission photoinduced fluorimetry for the determination of the antiepileptic carbamazepine in environmental waters. Anal. Chim. Acta 782, 37–45.. 38.
(39) Manzo, V., Navarro, O., Honda, L., Sánchez, K., Toral, M.I., Richter, P., 2013. Determination of crystal violet in water by direct solid phase spectrophotometry after rotating disk sorptive extraction. Talanta 106, 305–308. Martínez Bueno, M.J., Uclés, S., Hernando, M.D., Fernández-Alba, A.R., 2011. Development of a solvent-free method for the simultaneous identification/quantification of drugs of abuse and their metabolites in environmental water by LC–MS/MS. Talanta 85, 157– 166. Mas, S., de Juan, A., Tauler, R., Olivieri, A.C., Escandar, G.M., 2010. Application of chemometric methods to environmental analysis of organic pollutants: A review, Talanta 80, 1052–1067. Massart, D.L., Vandeginste, B.G.M., Buydens, L.M.C., de Jong, S., Lewi, P.J., Verbeke, J.S., 1997. Handbook of chemometrics and qualimetrics, Elsevier, Amsterdam, The Netherlands, Parts A and B. Matsuoka, S., Yoshimura, K., 2010. Recent trends in solid phase spectrometry: 2003–2009. A review, Anal. Chim. Acta 664, 1–18. Mbaye, O.M.A., Gaye Seye, M.D., Coly, A., Tine, A., Oturan, M.A., Oturan, N., Aaron, J.J., 2013. Photo-induced fluorescence properties of the propanil herbicide and analytical usefulness, Microchem. J. 110, 579–586. Molina-Díaz, A., García-Reyes, J. F., Gilbert-López, B. 2010. Solid-phase spectroscopy from the point of view of green analytical chemistry. Trends Anal. Chem. 29, 654–666. Moreira, E.D.T., Pinto, L., Gomes, A.A., Goicoechea, H.C., Araújo, M.C.U., 2015. A fast chromatographic method for determination of daidzein and genistein in spiked water river samples using multivariate curve resolution. J. Braz. Chem. Soc. 26, 1573–1582. Namieśnik, J., 2001. Green analytical chemistry–some remarks. J. Sep. Sc. 24, 151–153. Olivieri, A.C., Escandar, G.M., 2014. Practical three-way calibration. Elsevier, Waltham,. 39.
(40) USA. Olivieri, A.C., 2008. Analytical advantages of multivariate data processing. One, two, three, infinity? Anal. Chem. 80, 5713–5720. Pacioni, N.L., Sueldo Occello V.N., Lazzarotto M.R., Veglia A.V., 2008. Spectrofluorimetric determination of benzoimidazolic pesticides: Effect of p-sulfonatocalix[6]arene and cyclodextrins. Anal. Chim. Acta 624,133–140. Palencia, S., Vera, S., Díez-Pascual, A.M., San Andrés, M.P., 2015. Quenching of fluorene fluorescence by single-walled carbon nanotube dispersions with surfactants: application for fluorene quantification in wastewater. Anal Bioanal Chem 407, 4671– 4682. Pellegrino Vidal, R.B., Ibañez, G.A., Escandar, G.M. 2015. Spectrofluorimetric study of phenolic endocrine disruptors in cyclodextrin media. RSC Advances 5, 20914–20923. Pérez, R.L., Escandar, G.M. 2013. Spectrofluorimetric study of estrogen-cyclodextrin inclusion complexes in aqueous systems. Analyst 138, 1239–1248. Pérez, R.L., Escandar, G.M., 2015. Solid-surface fluorescent properties of estrogens: green analytical applications, Microchem. J. 118, 141–149. Petrović, M., Barceló, D., 2007. LC-MS for identifying photodegradation products of pharmaceuticals in the environment. Trends Anal. Chem. 26, 486–493. Pérez, R.L, Escandar, G.M., 2014. Liquid chromatography with diode array detection and multivariate curve resolution for the selective and sensitive quantification of estrogens in natural waters. Anal. Chim. Acta 835, 19–28. Pérez, R.L., Escandar, G.M., 2016. Multivariate calibration-assisted high-performance liquid chromatography with dual UV and fluorimetric detection for the analysis of natural and synthetic sex hormones in environmental waters and sediments. Environ. Pollut. 209, 114–122.. 40.
(41) Peris-Vicente, J., Marzo-Mas, A., Roca-Genovés, P., Carda-Broch, S., Esteve-Romero, J., 2016. Use of micellar liquid chromatography for rapid monitoring of fungicides post harvest applied to citrus wastewater. J. Environ. Sci. 42, 284–292. Piccirilli, G.N., Escandar, G.M., 2010. Second-order advantage with excitation-emission fluorescence spectroscopy and a flow-through optosensing device. Simultaneous determination of thiabendazole and fuberidazole in the presence of uncalibrated interferences, Analyst 135, 1299–1308. Płotka, J., Tobiszewski, M., Sulej, A.M., Kupska, M., Górecki, T., Namieśnika, J., 2013. Green chromatography. J. Chromatogr. A 1307, 1–20. Porini, J.A., Escandar, G.M., 2011. Spectrofluorimetric study of the herbicide bentazone in organized media. Analytical applications. Anal. Methods 3, 1494–1500. Qing, X.D., Wu, H.L., Nie, C.C., Yan, X.F., Li, Y.N., Wang, J.Y., Yu, R.Q., 2013. Simultaneous determination of plant growth regulators in environmental samples using chemometrics-assisted excitation–emission matrix fluorescence: Experimental study on the prediction quality of second-order calibration method, Talanta 103, 86– 94. Qing, X.D., Wu, H.L., Li, Y.N., Nie, C.C., Wang, J.Y., Zhu, S.H., Yu, R.Q., 2012. Simultaneous determination of pre-emergence herbicides in environmental samples using HPLC-DAD combined with second-order calibration based on self-weighted alternating trilinear decomposition algorithm. Anal. Methods 4, 685–692. Richter, P., Leiva, C., Choque, C., Giordano, A., Sepulveda, B., 2009. Rotating-disk sorptive extraction of nonylphenol from water samples. J. Chromatogr. A 1216, 8598–8602. Richter, P., Cañas, A., Muñoz, C., Leiva, C., Ahumada, I., 2011. Rotating disk sorbent extraction for pre-concentration of chromogenic organic compounds and direct determination by solid phase spectrophotometry. Anal. Chim. Acta 695, 73–76.. 41.
(42) Spietelun, A., Marcinkowski, Ł., de la Guardia, M., Namieśnik, J., 2013. Recent developments and future trends in solid phase microextraction techniques towards green analytical chemistry. J. Chromatogr. A 1321, 1–13. Szente, L., Szemán, J., 2013. Cyclodextrins in analytical chemistry: host−guest type molecular recognition. Anal. Chem. 85, 8024−8030. Tabani, H., Fakhari, A.R., Zand, E., 2013. Low-voltage electromembrane extraction combined with cyclodextrin modified capillary electrophoresis for the determination of phenoxy acid herbicides in environmental samples, Anal. Methods 5, 1548–1555. Tobiszewski, M., Mechlińska, A., Zygmunt, B., Namieśnik, J., 2009. Green analytical chemistry in sample preparation for determination of trace organic pollutants. Trends Anal. Chem. 28, 943–951. Tobiszewski, M., Mechlińska, A., Namieśnik, J., 2010. Green analytical chemistry—theory and practice. Chem. Soc. Rev. 39, 2869–2878. Tobiszewski, M., Marć, M., Gałuszka, A., Namieśnik, J., 2015a. Green chemistry metrics with special reference to green analytical chemistry. Molecules 20, 10928–10946. Tobiszewski, M., Tsakovski, S., Simeonov, V., Namieśnik, J., Pena-Pereira, F., 2015b. A solvent selection guide based on chemometrics and multicriteria decision analysis. Green Chem. 17, 4773–4785. Tobiszewski, M., 2016. Metrics for green analytical chemistry. Anal. Methods 8, 2993–2999. Vega Morales, T., Montesdeoca Esponda, S., Santana Rodríguez, J.J., Aaron, S.E., Aaron, J.J., 2010. Luminescence methods for study and determination of pollutants in the environment. Maced. J. Chem. Chem. Eng. 29, 1–42. Vosough, M., Mohamedian, H., Salemi, A., Baheri, T., 2014. Multivariate curve resolutionassisted determination of pseudoephedrine and methamphetamine by HPLC-DAD in water samples, J. Chromatogr. Sci. 1–7.. 42.
Figure

+2

Documento similar
