Effects of copper, sulfide and molybdenum on performance, hematology and copper, Iron and Zinestores of pigs
106
0
0
Texto completo
(2) ABSTRACT OF THESIS EFFECTS OF COPPER, SULFIDE AND MOLYBDENUM ON PERFORMANCE, HEMATOLOGY AND COPPER, IRON AND ZINC STORES OF PIGS One experiment involving 180 pigs was conducted to evaluate the effects of factorial arrangements of copper, O, 62.5, 125, 187.5 and 250 ppm and level of Vitamin E, O and 22 I.D./kg. Copper supplementation improved rate and efficiency of gain. Vitamin E had no consistent effect on performance and did not influence the response to copper. Final hemoglobin (Hb) levels were not significantly affected by the level of copper fed. Liver copper (L Cu) increased quadratically, liver zinc increased linearly and liver iron decreased quadratically with increasing level of dietary copper (P(.05). Two additíonal experiments involvíng 160 pigs were conducted to evaluate the effects of factorial arrangements of level of sulfide (S), O, 225, 450, 900 and 1800 ppm; copper (Cu) 250, 500 ppm, and molybdenum (Mo) O and 25 ppm on performance of pigs and their liver copper stores. After an average of 96 days on experiment, S at 1800 ppm of the diet tended to decrease gains in pigs fed 500 ppm Cu, but lower levels were very effective in preventing excess L Cu deposition, depression of Hb and hematocrit levels and depression of average daily gain. Levels of sulfide lower than 1800 ppm did not influence the growth promoting effect of 250 ppm Gu. Mo had no consistent effect on any of the response criteria.. ¡. 'úvuw.J a ' /7/ /"l?2 (Date). JI/{ ,.
(3) RULES FOR THE USE OF THESES Unpublished theses submitted for the masters and doctors degrees and deposited in the University of Kentucky Library are as a rule open for inspection, but are to be used only with due regard to the rights of the authors. Bibliographical references may be noted, but quotations or summaries of parts may be published only with the permission of the author, and with the usual scholarly acknowledgements. Extensive eopying or publication of the thesis in whole or in part requires also the consent of the Dean of the Graduate Sehool of the University of Kentucky. A library which borrows this thesis for use by its patrons is expected to secure the signature of each user. Name and Address. Date.
(4) THESIS. Manuel A. Corzo, D.V.M.. Graduate School University of Kentucky 1972.
(5) EFFECTS OF COPPER, SULFIDE AND MOLYBDENUM ON PERFORMANCE, HEMATOLOGY AND COPPER, IRON AND ZINC STORES OF PIGS. THESIS. •. A thesis submitted in partial fulfillment of the requirements for the degree of Master of Science in Agriculture at the University of Kentucky. By Manuel A. Corzo Cucuta, Colombia, S. A. Director:. Dr. Virgil W. Hays, Professor of Animal Sciences Lexington, Kentucky. •. 1972.
(6) ACKNOWLEDGEMENTS The author wants to express his sincere appreciation to his advisor Dr. Virgil W. Hays, Frofessor of Animal Sciences, for his helpful advice through the study, experimental research and preparation of this thesis.. Also to Dr. Gary L. Cromwell, Associate. Professor of Animal Sciences for his valuable suggestions during the experimental work.. Sincere debt of gratitude is expressed to the. Instituto Colombiano Agropecuario, ICA, to the members of the University of Nebraska, Alianza Internacional de Desarrollo A.I.D., staff in Bogota, Colombia and in Lincoln, Nebraska for the opportunity and financial assistance given to the author during his stay in this country.. The author also wants to express his gratitude. to Dr. W. P. Garrigus, Chairman of the Department of Animal Sciences. Sincere appreciation is extended to Dr. D. D. Kratzer for statistical advice, and to Dr. Ray Tucker for laboratory assistance. Also a memory of gratitude is expressed to the Technicians in the laboratory and the Graduate Students in the Department of Animal Sciences.. The assistance of Mr. Ted Cathey and C. W. Nichols and their farm crews in the feeding and care of animals is gratefully acknowledged.. Tbe author is also grateful for the assistance of Dr.. iíi.
(7) Roger D. Kline, Mr. Joel E. Drews, Dr. Dolok Sihombing, Mr. Charlie W. Scherer and Mr. Carlos R. Marroquin.. Special appreciation is. extended to Mrs. Virginia Atkins for typing of the thesis. Special recognition ls accorded to the author's wife, Margarita and their children for the patience and moral support exhibited during the course of this study.. ,. iv.
(8) TABLE OF CONTENTS Page ACKNOWLEDGEMENTS.. iii. LIST OF TABLES ••. vi. LIST OF APPENDIX TABLES. vii. LIST OF FIGURES. viii. CHAPTER 1.. INTRODUCTION .. .. .. .. 1. 11.. REVIEW OF LITERATURE. 3. Growth Stimulating Effect of Copper Toxic Effects of Excessive Copper • Re1ated Effects of Other Minera1s and Protein on Beneficial or Detrimenta1 Effects of Copper Absorption, Storage and Excretion of Copper, Su1fide and Mo1ybdenum. • • • • • • • • • • Potentia1 Counteracting Effects of Sulphur and Mo lybdenum. • • 111.. IV.. 3 5. 7. 16. 20. EXPERIMENTAL PROCEDURE. 28. General Objectives.. 28. General Procedure •. 28. Analytica1 Methods.. 33. .. .. . .. .. ... 36. RESULTS.. Trial 1 -. Effects of Varying Levels of Copper Sulfate on Performance, Hemog1obin Levels and Levels of Copper, Iron and Zinc in Liver of Growing-Finishing Pigs.. iv. 36.
(9) Table of Contents-(Continued) Page. Chapter Trial II. - Related Effects of Sulfide, Copper and Molybdenum on Performance and Hematology and Liver Copper Concentrations of Growing-Finishing Pigs. . . . . . . . . . . . . . . .. Trial III -Related Effects of Sulfide, Molybdenum and Copper on Performance, Hematology and Liver Copper Stores of Growing-Finishing Pigs.. V. VI.. APPENDIX •. .. 53 59. DISCUSSION. SUMMARY. 45. •. 74. •. .. 76. 82. LITERATURE CITED. v.
(10) r. LIST OF TABLES Table l.. page Leve1s of copper in the liver of pigs showing no symptoms of copper toxicity. • • • • • •. 8. Hemog1obin and hematocrit 1evels of pigs fed diets containing varying 1eve1s of copper. •. 10. Leve1s of copper, iron and zinc in the 1iver of pigs under the inf1uence of copper fed.. 12. 4.. Composition of basal diets •. 31. 5.. Surnmaries of added, analyzed and calculated copper content of experimental diets. • • • • • . •. 32. Trial 1 - Surnmaries of average dai1y gain and feed required per unit of gain to 57 kg of weight . . •. 38. Trial 1 - Surnmaries of average dai1y gain and feed required per unit of gain to 94.1 kg of weight •. 40. Trial 1 - Surnmaries of hemoglobin concentrations after 67 and 81 days on experiment • • • • • • • • • •. 42. Trial I - Surnmaries of liver copper, iron and zinc 1evels • • • • • • o •. 43. Trial 11 - Surnmaries of average dai1y gain and feed required per unit of gain. • • • •. 47. Trial 11 - Surnmaries of hemoglobin concentrations and hematocrit levels • • . . . . • . . . • • • . • .. 50. Trial 11 - Surnmaries of the copper levels in the triceps muscle of the shoulder and in the liver.. 51. Trial 111 - Surnmaries of average daily gain and feed required per unit of gain. . • . . • . • • o. 55. Trial 111 - Surnmaries of hemog1obin and hematocrit levels and liver copper stores • • • • • • . • . .. 57. 2.. 3.. 6.. 7.. 8.. 9.. 10. 11. 12. 13. 14.. ...... vi.
(11) LIST OF APPENDIX TABLES Table 1.. Page Trial 1 - Analyses of variance for average daily gain and hemoglobin concentration~ o o •. 76. Trial 1 - Analyses of variance for feed required per unit of gain and for copper, iron and zinc levels in livers of pigs . . o • • a o • ~ • • • • • • • • a •. 77. Trial 11 - Analyses of variance tor average daily gain and hemoglobin and hematocrit levels. • • • •. 78. Trial 11 - Analyses of variance for feed required per unit of gain and liver copper stores • • • •. 79. Trial 111 - Analyses of variance tor average daily gain and hemoglobin concentrations and hematocrit levels. •. 80. Trial 111 - Analyses of variance tor feed required per unit of gain and liver copper stores • • • • • • • • •. 81. D. 2.. 3. 4. 5. 6.. vii.
(12) LIST OF FIGURES Figure l.. 2.. 3.. Page Trial 1 - The influence of copper on rate and efficiency of gain. o .. • ... 60. Trial 1 - Stores of liver copper, iron and zinc in pigs fed graded levels of copper • • • • • • • •. 62. ... Trial 11 - Effect of dietary sulfide and copper on hemoglobin and hematocrit levels and liver copper stores.. ... 4.. •. ... ... ... ~. ... ... ... ... ... ... ... e. ... 9. ... a. ... Trial 111 - Effect oí dietary sulfide snd molybdenum on hemoglobin snd hemstocrit levels and liver copper stores • • • • • • • • • • • • • . • • • • • •. viii. 67. 71.
(13) CHAPTER 1 INTRODUCTION The discovery of copper as a growth stimulant for pigs by Evvard et al. in Iowa (1928) and the observation of Braude (1945) in Eng1and of the craving of pigs for copper opened the door for the evaluation of copper as a sübsti,tute fer an"tibiotics as a feed. additive without the potential transferab1e drug resistance factors of certain antibiotics that has been suggested as a potential human and animal hea1th hazard. Copper i8 an essential nutrient necessary for normal hematopoiesis and hemog1obin formation (Hart et al. (1928), Underwood (1971). Sound know1edge of the beneficial and harrnfu1 effects of copper and its relationship with other agents is essential in arder. to estab1ish the effectiveness of copper in swine production programs of feeding and management. Mo1ybdenum and sulfate have been postu1ated, since the discoveries of Dick in Australia (1945, 1953), to prevent excess accumulation of copper in Uver of sheep.. Since high levels of. copper in the diet stimu1ates growth and improves feed conversion in pigs it is desirable to know if the methods of counteracting excessive storage of liver copper in ruminants fo1low a similar -1-.
(14) -2-. pattern in the monogastric animal.. The goal of today's pork. industry and governmental regulatory polieies is to provide a safe wholesome product to the public consumero. Hígher concentratíons of. copper in the liver therefore are undesirable; even though, wíth the highest level of copper fed (250 ppm), the Uver copper doesn't reach the level normally present in beef liver.. Copper ls stored. mainly in the liver and its concentration in the muscles fs not. íncreased by high level. in the diet according to the research of Kline. tt. al. (1970), Castell and Bowland (1968b), Bunch. tt. al.. (1961); therefore the primary objective ís to prevent excessive deposítion of copper in the liver. Molybdenum and sulfate are effective in reducing liver copper levels in ruminants but have been ineffective in pigs.. Limited data. suggests that sulfide will dimini.sh the copper stores in pígs. Additional informatíon regardíng the optimum level of sulfide is needed. The purposes of this study was to evaluate the effects of varyíng levels of copper sulfate on the performance of pigs and the levels of copper, íron and zinc in tbeir Ii.vers and to evaluate tbe reIated effects of suIfide, molybdenum and copper on the deposition of copper in the livers of pigs.. Griteria for assessing the anímal. status were: Rate of growth, efficiency of gain, hemoglobín concentratíon, hematocrLt levels, and levels of copper, iron and zinc in líver and muscle tissue..
(15) CHAPTER II. REVIEW OF LITERATURE. Growth Stímulating Effect of Copper Besides the requirement to support normal growth and hematopoiesis as has been demonstrated by Hart Elvehjem and Hart, 1932; Vl1rey et. ~.,. et~.. (1929);. 1960, the pig responds. to relative1y high 1eve1s of copper in the diet accarding to the prevíaus report of Evvard et al. (1928).. Braude (1945) observed. that pigs licked the copper rings around posts in their pens, and Mitchell (1953) reported that baby pigs ate more of a creep ration containing 150 ppm oi copper than of a comparable diet containing lower level of copper, but it was not unti 1 1955 that Barber. ~ ~.. demanstrated the growth pcomoting actian of copper at 250 ppm oE dieto. Similar response has been obseriled and reported by Lucas and. Calder, 1957; Bunch et.. !!lo,. 1961; Hawhaker et. !!lo,. 1961; Bunch et. al., 1963; Ca.tell and Bowland. 1968; Paed. and MeDonald, 1969; and many others also founu ev'i.dence for a sinergestic effect between copper and chemoterapeutics a.s h&s been reported by Barher, et. !!lo,. 1971 and Braude et al., 1971. Hawbaker et al. (1959) demonstrated that. the copper radical. and not the sulfate radical. was producing the growth response in Iowa studies..
(16) -4-. Braude (1965) surnmarized numerous experiments from different parts of the wor1d and stated that pigs gained 8.1 percent fas ter on 5.4% 1ess feed per unit of gain when fed diets containing 250 ppm of copper as compared with the performance of pigs fed díets containing low 1evels of copper.. Braude et al. (1962) reported 9.7. percent faster rate of gain and 7.9 percent improvement in feed efficiency by pígs fed 250 ppm of copper, based on data invo1ving 980 pigs from 21 different research centera In Eng1and. Wallace (1967) summarized the research on copper in the United States and found that on the average pigs gained 10.7 percent faster and required 3.9 percent less feed par unit of gain. The research inc1uded in his summary Í.rivo1ved 5,954 pigs in 154 different experiments. The mechanism by whie.h copper acts as a growth stimu1ant remains obscure although ít seems to be in part a bactericidal action.. However there is little. direct data on changes in. intestinal flora to support this. Bunch. tt. According to the reports of. al. (1961) total aerobic and total anaerobic counts,. lactobacilli and streptococci were reduced by copper.. tt. Hawbaker. al. (1961) found a similar eHect using copper and antibiotics.. He found an increase in total number of coliforms, staphy10cocci., molds and yeasts in response to both chemoterapeutics used. Gireev (1968) reported that copper direct1y influences the nucleic acids metabolism i.n sheep.. Genci. tt!l.. (1970) found a 6 percent. increase in nitrogen retention by pl.gs weighing 15 to 35 kg of líveweíght and fed diets containing 250 ppm copper, but above that.
(17) -5liveweight there was no response and when copper was wi.thdrawn from diet at 60 kg liveweight appetite was reduced.. Ga1ik (1969), in. Chekos1ovakia, found, in 8 different trials, that copper, at 250 ppm of the diet, díd not affect digestibility of organic matter, fat, fibre or crude protein but the digestibility of N-free extract was reduced in pigs from 15 to 90 kg, however, when copper was withdrawn from diet (from 60 to 90 kg líveweight); digestibilitíes of fat, crude protein and fibre were reduced and that of N-free extract was increased slight1y. These studies suggest a possible direct effect of copper on the digestive and metabolic systems of the animal, but those effects could be an expression of the effect on the bacterial phase. Toxic Effects of Excessive Copper Excessíve copper reduces hemoglobin, hematocrít levels and increases the levels of copper in the Uvero. If this excess is. contínued reduced performance, reduced Uve.r funct:í.on and eventua11y death may occur. al Depressed Growth Rate and Feed Efficiency. Bass Ü. al. (1956) reported t:hat 250 ppm oí copper was toxic. to pigs on the basis of reduced performanc.e by growing pigs. O'Hara et al. (1960) reported listlessness, respiratory distress and sudden death in pige fed diets containing 250 ppm of copper. Wa11ace. ~~.. (1960) also reported reduced growth rates and. hemoglobin leve1s in pigs fed 250, 300, 500 and 750 ppm of copper. Allcroft. ~. &. (1961) observed a reduction in performance as a.
(18) -6•. resu1t of feeding diet containing 500 and 1,000 ppm of copper but not in pigs fed 400 ppm. Buntain (1961) reported ulceration of the stomach in pigs fed 130 ppm of copper.. Todd (1962) found sheep to be the species least. resistant to copper toxicity and the pig the species most resistant of the farm animal s •. Sutt1e and Mills (1966a) reported toxicity at. 750 ppm of copper but symptoms (anemia, and e1evated serum copper) disappeared after seven weeks, but a depression in rate cE gafn. persisted, however. Hanrahan and O'Grady (1968) observed a reduction in 1evel of reduced performance in pigs fed diets containing 250 ppm of copper.. Parris and McDonald (1969), working with growing pigs. and diets containing 250, 500, 750 ppm of copper, reported a depressive effect on performance from 500 or 750 ppm of copper in diets containing fish meal but not when utilizing soybean mea1 as a protein supp1ement, which supports in part the finding of Davis et al. (1962) that phytate can reduce the assimilation of copper. b) Depressed Hemog1obin and Hematocrit. Wal1ace et al. (1960) observed reduced hemog1obin 1evels when pigs were fed diets containing 250, 300, 500 and 750 ppm of additiona1 copper.. Al1en and Harding (1962) produced anemia, jaundice,. hypercupremia, weakness, ulceration Df stomach and respíratory. distress in pigs fed a diet with 1,000 ppm of copper. Ritchie et al. (1963) reported slight anemia in pigs fed 250 ppm of copper.. Suttle and MilIs (1966a) found a microcytic. hypochromic anemia at 750 ppm of dietary copper but the anemia "-. di~appeared. after 7 weeks of suministrating 750 ppm of iron.
(19) -7although growth rate remained depressed.. Hanrahan and O'Grady. (1968) also observed severe anemia and deaths in pigs fed 250 ppm of copper. Wal1ace (1968) continuous1y fed O, 250, 350, 450 and 550 ppm of copper to pigs for 369 days.. The three highest 1eve1s of. copper reduced feed intake, weight gain and b100d hemog10bin concentration but no deaths occurred.. The diets used were. adequate1y fortified with iron, zinc and proper1y ba1anced in other respects. c) Increased Liver Stores of Copper. According to Underwood (1971), liver is the major site of copper storage in the normal animal and it a1so appears to be the major storage site when dietary copper is excessiveo. Variations in. copper content, between and within, the lobes of liver has been reported by Cassidy and Eva (1958), Barber et al., (1960); Bowland et al., (1961) to be 1arge even in cases where toxicity had not been observed. In general, increased stores of liver copper can not be considered alone as a symptom of toxicity due to the fact, as has been reported in 1iterature, that high leve1s of 1iver copper may be present without any signs of toxicity (see tab1e 1).. A1so, one. may observe from data such as that reported in tab1e 1 that there is a great amount of variation even among animal s fed the Same leve1 of copper fed for similar number of days on experimento d) Re1ated Effects of Other Minera1s on Beneficial or Detrimenta1 Effects of Copper..
(20) ,. ,. ,. TABLE l.. -, •. LEVELS OF COPPER IN THE LIVERS OF PIGS SHOWING NO SYMPTOMS OF COPPER TOXICITY. Reference Barber .§.t aL (1961) Bellis (1961) Hawbaker et al. (1961) Bunch et a1.-(1963) Beames and L10yd (1965) Bunch .§.t al. (1965) Combs et al. (1966) O'Dono;;n et al. (1966) Gipp .§.t~. (1967) Caste11 and Bow1and (1968b) Beames (1969) Parris and McDona1d (1969) Kline et al. (1970) De Goe y .§.t al. (1971) Kline .§.t al. (1971) Kline .§.t ~. (1971 ) Kline et al. (1971) Kline .§.t al. (1972 ). Days on Exp.. Total No. Pigs Invo1ved a. Liver cOEEer 2 E2m. Control. 125. C022er added to diet, ppm 150 200 250 500 750. 108 129 42 132 63 42 57 70 89. 40 144 16 36 24 40 40 16 12. 52 66 29 26 26 93. 175 42. 6 64. 31 24. 113 122. 42 61 102 54 61. 32 48. 21 16 20. 83 48 310 66 105 150 114. BB 100. aEqua1 number in each treatment.. 72. 80 80 96 80. 17. lB 14. 287 959 293 278 164 152 895 1095. 164. •. 3675. 00 I. 31. 27. 73. 396 1042 1629 1270 1394. 581.
(21) ~9,. Copper is directly related to the utilization of iron in that it stimulates erythropoiesis by acting as an enzymatic agent in the incorporation of iron into an integral part of hemoglobin structure, but excessive copper has a contrary effect, suggesting then, an antagonism between copper and iron.. Though copper is. required for normal erythropoiesis excessive amounts results in anemia as evidenced by low hemoglobin and hematocrit levels as reported in several papers (table 2). The antagonistic relationship i8 manifested in the liver. ". stores of copper and iron.. Excess dietary copper depresses liver. iron levels as reported by Cassidy and Eva (1958) in pigs and by Sourkes et. ~.,. (1968) in rats.. Bunch. ~ ~.,. (1963) al so. observed significantly less iron in the liver of pigs supplemented with a high level of copper and they also noted that hemoglobin level returned to near normal if additional iron was provided. Suttle and MilIs (1966a) found that 750 ppm of supplemental iron prevented anemia in pigs fed 750 ppm of copper. ,. .. Al so 750 ppm. of copper and 750 ppm of iron separately increased liver zinc stores over those of controls.. Kainski et al., (1967) observed. reduced liver copper levels in pigs fed 661 ppm of iron and 15 ppm of copper; but when pigs were fed 88 ppm of iron and 66 ppm of copper, the liver copper approached the normal level. Tbere is also amp1e evidence that the level of zinc in the diet affects the response to copper.. Several reports indicate. that additional copper cures or prevents parakeratosis in pigs (Roefer. ~. al., 1960; Wallace. ~. al., 1960; Ritchie. ~. !l.,. 1963,.
(22) ,•. ,. TABLE 2.. ". HEMOGLOBIN AND HEMATOCRIT LEVELS OF PIGS FED DIETS CONTAINING VARYING LEVELS OF COPPER. Reference. Days. Pigs. Control. 125. 150. 200. 250. 375. 500. Kline ~ &. (1970) Hematocrit. 61. 48. 15.7 46.. 17 .0 50.. 14.4 44.. Kline et al. (1971a) He;;;a't;;;orit. 54. 80. 13.9 41.. 13.9 40.. 10.8 32.. Kline ~ &. (1971b) Hematocrit. 61. 80. 14.8 43.0. 11.2 35.0. Kline ~ &. (1971c) Hematocrit. 88. 96. 16.2 44.. De. 98. 192. 14.0 46.1. 14.4 47.8. 11.9 40.6. 100. 80. 14.4 42.. 14.9 44.. 11.2 36.. 91 105. 76 28. 12.4 1l.8. 175. 6. 13.9. Goey~al.. (1971). Hematocrit Kline ~ al. (1972) Hematocrit Hemog1obin HDefer et al. (1960) Ritchie et al. (1963) Caste11 and Bow1and (l968b). .,.. 15.9 44.. 12.9 12.4. 16.5 46.. 15.8 44.. 9.7 14.3. 750. I. '"-'. o I.
(23) ~11~. 1963; Ranrahan and O'Grady, 1968). Ritchie DeGoey. ~ ~.,. ~ ~.,. (1963), Ranrahan and O'Grady, (1968), and. (1971) have reported that liver zinc increases as. level of copper in the diet of pigs is increased. (tab1e 3). Suttle and MilIs (1966b) and O'Rara. ~. al. (1960) support. the idea that although copper and zinc are positively correlated in 1iver stores, copper in high 1eve1s of feeding can produce zinc deficiency due to the low mobilization of zinc in animal tissue. K1ine. ~. Al.. (1972) demonstrated that excessive 1eve1s of. '-. zinc (300 ppm) and iron (137 ppm) in the diet of pigs consuming 250 and 500 ppm did not prevent excessive deposition of copper in the 1iver during a growing finishing period of 100 days. There 1s extensive evidence of a re1ationship of dietary copper, sulfate and molybdenum on the hea1th and we1l being of animal s , particularly rum1nants. D1ck and Bull in Australia (1945) demonstrated with sheep that supplementa1 dietary mo1ybdenum results in a lowering of liver copper leve1s. ". Dick (1952, 1953a,b; 1956a) postulates that. molybdenum and sulfate antagonizes 1iver copper stores and that neither of the two a10ne, sulfate or mo1ybdenum is completely effective in a1tering 1iver copper stores.. Also, Dick reports that. sulfate promotes the excretion of molybdenum.. Re found the maximum. reduction in liver copper level in sheep fed 15 to 20 ppm molybdenum and also reported that levels higher than this increased liver copper levels even in presence of 2,000 ppm of sulfate. Similar results were reported for Wynne and McClymont (1956). /.
(24) ,.. ,. •. LEVELS OF COPPER, IRON AND ZINC IN THE LIVER OF PIGS UNDER THE INFLUENCE OF COPPER FED. TABLE 3.. Days on Exp.. Reference Cassidy and Eva (1958). Total No. Pigs Involved 20. Copper Iron. 655. Zinc. Hoekstra (1961). 195 590. 770 460. 122. 54. 26 835. 278 285. Copper Iron Zinc. 105. 60. 70 420 207. 149 225 288. Copper Zinc. 49 49. 24 24. 17 203. Hanrahan and O'Grady (1968). Copper Iron Zinc. 160. 84. 100 522 141. 534 247 150. Mil1er (1970). Copper Iron Zinc. 31 675 365. 428 420 370. ~&.. Ritchie. ~g.. (1963). Sutt1e and Mills (1966a). Young. ~. De Goey. &. (1970). ~. &. (1971). 2790 180. 200. Copper Iron. Bunch. (1963). Control. Liver, dr~ basis, EEm Coeeer added to diet, ee m 125 250 500 750. Copper Iron. 86 86. 24 24. 36 750. Zinc. 96. 72. 318. 272. , ,. ..... N. 328. 81 646. 253 460 344.
(25) -·13with intakes of molybdenum 1e8B than 8 ppm/dayo Cunningham (1955) demonstl'ated that atores of liver molybdenum decreased. as copp6r 'in th.e d:i.et of sheep inc.reased,~ al.so. indicating a relationsh:i.p between copper and molybdenumo Goodrich and TU 1man (1966a, b) were B:1ccessful in reducing Uver copper stores of sheep by feeding 8 ppm of mo1ybdenum and 4,000 ppm of sulfate; but, when mo1.ybden:C:ffi 1eve1swere lowered 1.0 2 ppm, the liver copper was not redc;ced. According to che reports oí Con:.á" el' aL, 1949; Jeter and Davis, 1950, 1954; Compere. .~t. aL, 1965; lí the copper stores are. adequate and the copper 1eve1 fed i8 high, large amm.mts of mo1ybdenum are required to produce ¡nolybdenum toxic.ity i.n rats. KuIwich e.t al., (1953).' bo",ever.' reported that: 1,000 ppm of mo lybde.nüITi. [11,. incTBas~d.. copper "r:et8Il:tion in pi,gs and rats {). c.ont:rast ta the appare.nt 6:1 t."üidtion .Ln rum:i.nants. molybd.enum and. su.1fate does nar: reddce copper. lE:~ve1.s. in pigs and. the pig can tolerate very high leve 18 of molybd.,num as compared with the,colerance ofcuminants (L DavÍB, 1950, Lahey et !!lo, 1952; Gipp et aL, 1967; DeGoey L8",i8. et~. aL, 1971; Kline. ",l:. al., 1911).. (1954) anú Ande.c8on (1956) ,showed that tumen micro-. organ:ísms re.düees part cf che s'u..lfate te sulfideu. Nuch le:58 of. the sulfate 18 reduced to 8hlfide in the digeative cract of the animal accordlng to MilIs, (1960),. This may partially explain the. apparent difference between rilminants and response to mo1ybdem:¡mo <. Spais e.t.. El". non~·ruminants. in thei'c. (1968), Bowland et. al.,. (1961) alBO found that lesa oI t:he copper i. 8. absorbed from copper.
(26) sulfide than from copper sulfate, so In the I'Gminant, sulphide may combine wíth copper to make the copper le.ss available for absorption.. These wOI'kers a1so reported great prodClct.ion of. sulfide when red large amounts of suI fate to ruminants.. Bird (1970). demonstrated a decrease oi soluble copper in t.he omasum of sheep fed sulfate and eystine. Dowdy and Ma·trone" (1968a) have demonstI'ated t:he in vitro formation of a. coppér~1nol=./bcie:r2';,;.:m. c.omplex and hmi"€. ft..rt:her. demonst"Cated that the comp1ex 1,0 biologlca1ly ünavailahle to sheep, pigs and rats hut not for ehe ehiek, (Dowdy aud Matrone, 1968b; Dowdy. tt. ~.,. 1969.. Accordiug to Bell el: aL (1964,1966), p:igs excrete most of molybdenum g:Lven o'cal.ly o·r. iü','_:raVE::nouB 1J ~ i.n the dr:i:ne ~. whereas in c.attle the main route ..::f molybdenum excretion i5 the feces.. Al.so, in che st"dles oI Bell etc al., pigs eUminated m.olyb·-. denum from h100d w.!.thin 48 hoca'9 -while she.epnqu:i.red 72 houra to eliminate. th,e moly'f:deT:"".JlTIo. Sim.'Í.la:c. pigs and rats by Di.gg,; e:i; al.,. !.'eStllts. have been obseTve.d for. (1962) and Kinnamon (1966).. Several autho't's haV2 reported t:hat the 'response to copper. was depende.nt on the soc'cee of procein feá". Combs e.c al. (1966). fed pigs dit::'.ts co:::;:.t:a',Lcine; caeein or so:ybean. roed.1. a~. t.he 5a-Urc.e of. protein and observ'ed more copper in líver tissGe oi pi gs fed the casein.. Similar results were found by O"Donovan. tt!!l.. with dried skimm.ilk ir: compariaon wit.h soyhean meal.. (1966). They also. observed more copper ·t'etention in pigs fed fish mea1 than in pigs fed soybean meaL.
(27) .'. Barber et. ~.. (1962) observed 14.5 percent fas ter growth in. pigs fed diets supplemented wi.th copper (250 ppm) if the diets contained animal protein hut only 5.1 percent ímprovement if the protein was only from vegetable sources.. Suttle and MilIs (1966b) developed coppe.r toxicity in pigs fed 600 ppm copper in diets containing fish me.al hut did not observe toxicity aL the same copper leve] in pigs fed soybean meal or dried skirnmilk oiets.. Parris and McDonald (1969). observed depressed gaLns and fe.eo intake (P .05) in pi.gs fed 500 and 750 ppm of copper in fish me.al di€ts bat not in pigs fed soybean diets.. They also founo a significantIy higher levels of. liver copper in pigs fed the diets containing f:ish meal. Kli.ne. et~.. (J 970, 197L 1972) utilized 16 percent of. protein in a c.orribinat ~>o'G corn-so'y'bean meal whi.c.h is the source. that has been repo·cted ca·dse leas storage of copper but they still. found high rete·'<.t.ton of copper i.n t.he 11ve.r. Braude in. 1965. reported a higher re.tention of nitrogen. when used 250 ppm of copper. WalIace et al. (19f,O) foc:nd c:bat increa>'ing the protein level from 15 to 25 p",rce11t redaced the toxicit:y of 750 ppm of copper as evide,nc.ed by a s1.g;n:Lf'icant int,eraction between the. level oí copper and protein 011 growt.h. Combs et aL (1966) a1s" reported reduced liver copper level" but no change in hemoglobin level as a result of increasing the protein level from 14 to 22 percent in die.ts tai.ning excess copper (500 ppm).. con~.
(28) ~16-. Hanrahan and O'Grady (1968) found also less liver copper in pigs as a result of supplemenUng the dist with 250 ppm of copper i f the diet contained 16% rather than 13% protein. Bunch ~!!l. (1961) however, found no significant effect of level of protein (16 to 22%) on the response of pigs to varying levels of copper (125, 250, 375 ppm). Beames and Lloyd (1965) utilizing extreme va1ues of protein like 6 and 23 percent of t:he diet, likewise, did not find any significant copper level x protein level interactions. Braude in (1965) reported a higher retention of nitro gen when used 250 ppm of copper. Caste1l and Bowland (1968a) reported that 250 ppm of copper increased apparent digestibillties of energy and protein in the growing stage hut not in the finíshing phase of pigs, similar results have been found by Genci. et al., (1969). Absorption, Storage "nd. Excre,~ion. of Copper, Sulphur and Molybdenum. Copper ls absorbed mainly in amall intestine and colon of pigs according t.o Bowland et al. (1961). o. According to Underwood. (1971) copper absorption. and retent1.on L8 affected by the chemical forros in which the metal LS ingested, by the dietary levels of several other mineral s (sulphur, molybdenum, iron, zinc, cadmium, calcium and manganese) and organic substances (phytates and ascorbic acid) by the protein, 1evel and quality, and by the acidity of the intestinal contents in the absorptive area.. Starcher (1969) has. demonstrated a copper-binding protein in the mucosa1 cells of.
(29) ~17-. duodenum of the chick which may playa role in copper absorption in monogastric animals. Bow1and &. al. (1961) reported less copper absorptíon in. pigs from copper sulfide than from copper sulfate.. Dick (1954). suggested that molybdenum and inorganic sulfate reduce copper retention in the sheep by reducing the absorption of ingested copper and by increasing the urinary excretion of absorbed and stored copper, due in each case to interference with membrane transport of copper.. MilIs (1961), as cited by Underwood (197]), demonstrated. with radioactive copper that high intakes of molybdenum and sulfate in sheep restrict copper retention by depressing copper solubílity within the digestive tracto Liver is the key organ in the metabolism of this element according to Underwood (1971).. Copper Ls eit.her stored there or. released for incorporation into copper containing enzymes.. G:i.pp et. aL (1969) failed Lo obtain a response i.n growth when injected pigs with copper glycinate, in amounts assumed to be similar to that absorbed in rhe 250 ppm of level fed.. The bi.liary system 1.s the. major pathway of excretion of copper in pigs according to Bowland. & ll.. (1961), and this copper 1.8 excreted main1y as copper sulfide. Dammers and Stolk (1959) and Suttle and Mills, (1966a). Intravenous injection of copper results in e1evated blood and tissue copper leve1s followed by a greater excretion of copper in the bile and hence in the feces; hut. it does not norma1ly raise. ,. .. urinary copper output, according to Mahoney et al. (1955).. They. reported that, in dogs, 0.610 of radiocopper was excreted in urine,.
(30) -181.5% passed directly through intestinal wall and 7 to 10% was excreted in the bileo According te Cemar and Bronner (1962), hydrogen sulfide is formed in gastro intestinal tract from the catabolism of sulphuramino acids, which in turn reacts with copper to form insoluble copper sulfide (Braude, 1965). Also whole blood from normal rats oxidizes sodium sulfide in large amounts if administered slowly.. Ferritin in gastro. intestinal mucosa has been suggested as a possible catalyst for oxidation of sulfide produced by bacteria thereby preventing sulfide from reaching the bloodstream.. Rats intravenously injected. with 35S as sodium sulfide quickly excreted it in their urine as sulfate sulphur.. Bacteria in the gastro-intestinal tract of dogs. converted elementary sulpht:ir to hydrogen sulfide and when it was absorbed 10 percent of the sulphur was excreted in urine as sulfate and neutral sulphur. Bray and Hems ley (1969), working with sheep, observed more rapid absorption of sulfide than of sulfate from the rumen.. AIso. 40 to 90% of 35S as sulfide was absorbed from the intestinal tract after 60 minutes in comparison with only 25% of S as sulfateo Growing swine consuming a known amount of sulfate and molybdenum, absorbed 99Mo with a peak in blood at 2 to 4 hours (Be!l et al. (1964) and 75% of both orally and intravenously administered 99 Mo was excreted in the urine of swine in 120 hours&. Similar excretions of molybdenum in the urine of pigs as a main. •.
(31) -19route of excretion has been reported by Shirley et al. (1954). Sulfate of sodium and of potassium in ruminants strongly intensified the excretion rate of molybdenum in urine mick, 1952, 1953a,b,1954a,b and Scaife, 1963), an effect that is not shared by potassium ch10ride which induces diuresis but not mo1ybdenum excretion, therefore Underwood (1971) eoneludes that studies on molybdenum metabo1ism are of limited. val~e. unless the inorganic sulphur status. of the diet is known.. '.. In the studies of Diek and of Seaife there was an inerease in excretion of molybdenum from 3 t.o 5% in low sulfate diets, to 40 to 50% in high sulfate diete.. These authors suggested that, in. the sheep, sulfate limits molybdenum retention by redueing intestinal absorpti,on apd increasi.ng urinary e:x:cretion, the extent. of each depending upon the previous history oí the animal with respect to molybdenum and sulfate intakes.. Several diureties. tested did not increase excretion of mo1ybdenum, suggesting that the sulfate is highly specifie in ruminants. Sulfate of endogenous origin from eatabo1le breakdown of body tissue, that from bacterial catabolism of su1phur amino aeids in high protein diets or the administration of thiosulfate and methionine to sheep (Dick, 1956b and Scaife, 1963) can be as effective as inorganic sulfate to intensify exeretion of mo1ybdenum in urine.. Similar results with endogenous sulfate. have been tested with rats (Underwood, 1971). Dick, (1956b) postulated the hypothesis that the rise in the sulfate eoncentration in the ultrafiltrate of the kidney.
(32) -20glomerulus, with high sulfate intakes, impedes or blocks reabsorption of molybdenum through the kidney tubule, however the mechanism of this postulated interference with membrane transport ís unknown,. Potential Counteracting Effects of Sulphur and Molybdenum Fergusson (1940) in England reported that copper salts antagonize the toxic effects of molybdenum in cattle.. Dick (1953). presented evidence that high intake of inorganic sulfate and high. .'. intake of molybdenum antagonized liver copper deposition in the sheep.. Also, Goodrich and Tillman (1966a,b), Dick (1954a,b),. Wynne and McClymont (1956) observed reduced liver copper levels in sheep fed high levels of sulfate and as low as 8 ppm of mo1ybdenum, but not when molybdenum was reduced to 2 ppm. Research wiCh rats, (Mills, 1960; Mills and Mitchell, 1971; Miller. ~. al. 1956), suggests that molybdenum promotes copper. accumulation in the liver and prevents physiological mobilization of copper after its absorption into body tissues. Reen and Williams, 1956; Miller et. ~.. In rats, (Van. 1956) supplementary sulphate. associated with a high molybdenum intake prevents abnormal copper accumulation in the liver, and at the same time improves the rate of growth and permits normal hemoglobin production.. Sulphate. supplementation does not fully restore normal growth in the rat and chick (Davies et al. 1960) at extremely high values of dietary molybdenum (above 1,000 ppm) but at lower levels the improvement in physiological performance i8 dramatic.. In both rats and the sheep,.
(33) -21sulphate supp1ementation of the diet leads to an inerease in urinary excretion of molybdenum and a fall in the tissue content of mo1ybdenum, which indicates that the inhibitory effect of sulfate cn molybdenum is in the metabo1ic tissue and not at intestinal leve1 as may be the case for the interrelationship of sulfide and copper (MilIs. and Mitchell, 1971, MilIs, 1960).. The enzymatic oxidative detoxification af su1fide ta sulfate in rats as suggested by MilIs. et~.. (1958), Halverson,. ~. al.. (1960) may be restricted in tissues high in mo1ybdenum contento In such tissue sulfide accumu1ation 1eads to a precipitation of insoluble cupric sulfide in which the copper is unavai1ab1e far physiologica1 purpases (Halversen (1961); Spais et. ~.,. ~. al., 1960; Siege1 and Manty. 1968).. Su1fide oxidase activity appears to be dependent upon the ig. ~. supp1y of copper (Siegel and Monty, 1961) so that high. dietary leve1s of copper wil1 help to maintain su1fide oxidase activity in the face of the inhibiting effect of mo1ybdenum on this enzyme.. In this way an endogenous supp1y of sulfate wi11. emerge which in turn, wi11 lead ta prevent mo1ybdenum accumu1ation in the tissues; Wilson and Bandurski (1958) have found that. ,. the enzyme system responsib1e for the farmatian af 3 -phosphoadenosine-S •-phosphosu1phate, the active intermediate af sulphate rnetabo1isrn, is strongly inhibited by mo1ybdate. !U. ~. but. Williams and Van Reen (1956) suggested that ATP supplies in animals given high-rnalybdenum diets are normal. .~. Shírley. ~. !l.. (1950, 1951) found, hawever, that in mo1ybdenosis, the stores of.
(34) -22-. phosphorus in the body and the reproduction function of rats and bulls are impaired. MilIs (1960) and Purdom (1960) obtained fas ter sulfate reduction to sulfide in rumen fluid when molybdenum was present, and. this may explain the necessity of molybdenum to antagonize. excessive copper in the liver of ruminants (Marcilese. ~. al. 1969).. Marston (1952) observed that feeding of molybdenum to sheep maintained under conditions of inadequate copper intake, decreased the rate of depletion of liver copper stores while exacerbating the signs of copper deficiency. From the papers cited before it seems that the metabolic disturbances resulting from the feeding of molybdenum to the rat are probably the result of a failure of copper utilization within the tissues.. There is certainly little or no evidence to indicate. that molybdenum interferes with copper uptake from the digestive tracto In the ruminant the decline in tissue copper and the fall in the soluble-copper content of rumen and abomasal liquors when the diet i8 simultaneously supplemented with molybdate and sulphate suggest that changes within the digestive tract may restrict copper absorption and may be the underlying cause of the ensuing copper deficiency. Spais. ~~.. (1968) demonstrated high rumen sulfide. production on high-su1fate diets.. They suggested that this reduces. copper absorption through the formation of insoluble copper sulfide, Marcilese and coworkers (1969) working with 64Cu in sheep.
(35) -23-. compared the addition of 0.4 percent of sulfate alone and 0.4% of sulfate plus 50 ppm of molybdenum.. With the diet that contained. sulfate and molybdenum, they found significant depression of radioactive and stable liver copper and a reduction in the ceruloplasmin fraction of plasma.. This suggests an interacting. effect on copper by sulfate and molybdenum but the mechanism of this interference remains to be established. Dowdy et. ~.. (1968, 1969) prepared a combination of CuS04. and Na2Mo04 to form a complex called lindgrenite which has a copper:molybdenum ratio of 4:3, and precipitates in a near-neutral solution.. They hypothesized that this complex can exist in vivo. and that the copper bound in this complex is biologically unavailable to pigs and sheep.. These authors could not lower. significantly the copper stores in pigs fed copper sulfate or citrate administered with molybdenum in a ratio 4:3.. The complex. lindgrenite did not cause to the pig liver copper storage. In sheep, given intravenous injection of Cu-Mo complex made from. 64. Cu and. 99. Mo, the rates of removal from the blood of. the copper and molybdenum were equal, and this rate was more rapid than that of 99Mo injected alone, but the rate of urinary excretion of molybdenum from the 64Cu _99Mo injected sheep was slower than from the 99Mo-injected animal. Copper in the form of the Cu-Mo compound, synthetic lindgrenite, was also shown to be less available to weanling rats than copper from the sulfate salto !-". From the findings reported in the literature, one is led.
(36) -24to the following conclusions: 1) In ruminants, supplementation with both molybdenum and sulfate (Marci1ese et al. 1969) appear to be necessary to reduce excessive 1iver copper 1eve1s and for the bacterial flora of the rumen do a effective reduction of sulfate to sulfide (Lewis, 1954, Anderson, 1956, MilIs, 1960, Purdom (1960). 2) Su1fide is the form most rapidly absorbed at rumina1 and intestinal levels (Spais, 1959; MilIs, 1960; Bird, 1970).. ,. .. 3) Sulfide after being absorbed is rapid1y eonverted to endogenous sulfate by the enzymatic aetion of sulfide oxidase, which i8 activated by copper.. This conversion is so fast that sulfide can. not be detected in blood of sheep (Anderson, 1956; Sorbo, 1958). 3) Endogenous sulfate without the presence of excessive molybdenum can result in excretion of sufficient copper to lower stores in liver (Goodrich and Tillman, 1966a,b; Wynne and McClymont, 1956). 4) Endogenous sulfate in the presenee of adequate eopper can dep1ete normal Btores of molybdenum (Dick, 1953a, with sheep; Davis. ~. al. 1960 in rats and chicks; Mills, 1960, and Miller. ~. al. 1956, with rats and sheep). 5) Excessive dietary molybdenum promotes copper accumulation and prevents physiological utilization of copper in the liver after its absorption into body tissues (MilIs, 1960; Miller et. ~.. 1956;. MilIs and Mitche11, 1971; wíth rats; Kulwich, et al. 1953 in pigs and rats; K1ine. ~. al., 1971, with pigs).. 6) Excessive molybdenum blocks conversíon of dietary sulfide to endogenous sulfate and finds normal stores of copper (Ha1verson.
(37) ·-25!2.!:.. &.. 1960, Siegel and Múnty, 1961, Spais ~ al. 1968) to Lesalts. in accumulation of copper sulfide in the tissue (Van Reen, 1954; Wíllíams and Van Reen, 1956) whích 1.8 insoluble a.nd unavaUab1e or results in an unaval1able compl ex of (Halversen et. &.,. C·~. ,Mo in a ratio of 4:3. 1960; Sie.ge1 and Monty, 1961; Spais !2.!:. al.. 1968, Dowdy!2.!:. al., 1968, 1969) which has a fast rate of mobilization froro the blood and a slow rate. of Excreti.on.. This effect. if contínued for a long time can p'coduce a copper deficiency. 7) Copper in vivo supports the act.ivity of sulflde oxidase (Siege1 and Monty, 1961).. High di.etary ¡evels of copper wiU he1p. to maintain su1 fide.oxidaee activity against the inhibiting effect of molybdenum to chis enzyme, and excessive mo'Lybdenum can be excreted. hOll. the body by sc:lf"te unti1 ie causes a mo1ybdenurn. deficiency,. or a combLned copper sulfate and toxicity,. Ibis can. happen l f there i8 available enough physiolügi.cal coppeor to convert, absorbed sCilfide too e:Gdogenous sulfate.. EquaUy imporcant,. can be the amount: of suLflde given to th" animaL 9) Molybdenum ls probably noto necessal'y to prevent excessive copper. deposition in the li:v"er ~ :l. f :.eamiTi.Cints a.re fed. sr:]. lfi.d.e rather than. sulfate assuming tbatMo l8 necessary to reduce sulfate to sulfide by bacterial flora present in the l'umen, la) Molybdenum can antag.onize toxic effect& of coppe'.r b¡¡t does not result in a fast removal of copper from the Uvero The latter conc1usions probably explain ",hy G.i.pp et. ~.,. (1967), De Goey et al.. (1971), and Kline et al., (1971) did not _ _. o. _ _. find an antagonism between copper and sulfate in pigs even when.
(38) -26the molybdenum was fed at very bigb le"e18,. Tbe microbial flora. of cecum and colon were unable to reduce su] fae.e to sulfide at arate sufficient to affect metabolic needs or affect Uver copper stores tbrough the reactlon with endogenous sulfate" Tbougb there are defi.nitely relationsbips among iron, zinc and copper as they affect copper atores (table 3), the supplemental levels of iron (50 ppm) and of zinc (100 ppm) used are more than adequate; but still 250 ppm of copper in the. .... diets results in an increase in 1iv8r copper levels K1ine. tt. o. Also. al. (1972) demonstrat.ed that excessl.ve leve]s oí zinc. or iron would have litt1e. 01:. no beneficial effecr. in ·reducing the. levela of coppe.r stored o P:cotein leve. L and pl,,:,otein sou:cce alac appear to :i.nfl venc.e. copper stores, bUi: the store.B appear to be lowest in pigs fed soybean. meal protein which. 18. the. 8mjTc.€. oi" pro"tein Kline l1sed. and ati11 increase.d [evels of copper in Uver re.suIt:ed (table 1) o Pratein level may affeel. the response tbough there are conflicting reports on chis mattel:.. Above adequate levels aE protein (16%. to market we.ight) was used hy Kline and t.his did not: (;01'1'ect the problem of copper accumal"tion in che livet'. Molybdenum and sulfate <ice beneficia 1 in nm!Í.nants but not in pigs as thorm¡ghly investigated by Kline et !!lo (1971) o Kline et al. (1970) reported a decline in copper stares in pigs fed them with 250 ar 500 ppm oE copper with 1800 ppm of sulfide and 50 ppm oí molybdenumo. Iha.y a1so reported a depressi.on. effeet of the high level of sulfide and molybde.num on growth :rateo.
(39) -27In view of their findings it was deemed desirable to test several levels of sulfide and malybdenum in arder to determine the effects of molybdenum and sulfide on the. tOX:LC. effects of copper. as measured by performance" hematology and liver stores of copper.. '..
(40) C!lAPTER III. EXPERIMENll\L PROCEDURE. General Objectives Oue experiment was conducted te st'i,.;"dy the effects of copper on performance, hemoglobin c.oncentrations an.d levels of copper, iron and. zinc i.n líver tissue of growing fini.shf,ng swine. G. Twa additíanal experíments were candueted to "Lrdy the related effects of copper, sulfide and molybdenum on performarrce, hemaglabin concentrations, hematocrit levels and t.iss':.le copper stores of growing-. fini.shing pigs.. General Proeedure Pigs u"ed in these experin:ents were Yorkshire, Hampshire ol' Yorkshíre~Hampshire. erossbred whieh were abtalned fram t:he Uníversity. of Kentucky swlne het:ds.. Prior to lhe start of the experiment, pigs. rec.eive.d a standard co.rn"·8oybean meal diet... A11 animals were. randomly allotted from weight outcome groups with sex and breeds to a randomized con:plete block designo wit.h ths. restriction that littermates (where applieable) be distribl¡ted equally across treatments. The experiment,s were conducted in. conerete-floored pens.. open~front. swine units with. Eac.h pen was 1.22 x 6.10 meters in si.ze with. a 1.22 x 3.05 meter are a partial1y enclosed. -28-. Eac.h pen was farnished.
(41) -29with a two-hole self-feeder and an automatie water fountain to allow the pigs to have free aceess to feed and water.. The pens were cleaned. as needed and straw was provided as beddLng during the winter experiments.. All diet" were mixed in a vertical twin spiral mixer. which had a maximum capacity of 910 kg oí feed.. Vi.tamins, trace-. minerals and experimental additiveswere premixed with a small portion. of the dietary corn ín a srr.all horizontal mixer prior to the mixing of t.he diet in the verti.cal mixer. The basie composition of the diets used in a11 experiments i8 presented in table 4 and surnmarie.s of added, analyzed and caleulated copper content of the experimental diecs are presented in table 5. Througho'Cit the experímett, a11 pígs were fed diets calculated to contain 14.7 percent in ExpE.rÍ.memt 1 and 16.1 pereent in Expe'riments II and. rr1. Di proteiuo. elements incl:ucted in the. ¿J.:~.et6. The sm.::rc:es of experimental. which made ';:¡p tItE'_ various treatments. were as follows: copper as techrücal g'rade coppér sulfate (CuS04' SH20); sulfíde as sodLlm s:olHde (Na2S assay molybdenum as arnmonium molybdace. =. 60 perc.ent),. (NH4)6Mo7024·4H20. vitamin E as. vitamin E mix which provided 275,000 LU.ikg, chlortetracycline, as Aurofac-50 wíth a concentratíon of UO gro/kg. Pigs were weighed and felSct cousumptioTI was determi,ned at.. weekly intervals.. Blood samp1es were taken at the in1.tiatíon,. middle and termination of the experiments. drawn from the anterior (1942).. bi~. ~ ~. The blaod samples were. as described by Carle and Dewhirst. A glass hypoderma1 syrínge and an 18 gauge 7.6 cm needle. were used to obtain the blood.. The syringe and needle were washed.
(42) ~30-. in water after each individual animal was bledo Blood samples were atored in medium size glass test tubes containing three drops of sodium heparin (1,000 U. S. p. uníts per cc). After a11 pigs were bled the tubes were slowly inverted several t.Lmes and hemoglobin and hematocrit levela were determined. Llver and tríceps muscle of shoulder samples were obtained at s laughter from eithelO one or two barrows per peno. The Uver "amples. were taken from the liver lobe adjacent to che bile duct.. At this. site the copper content approximate.s the mean copper content of che whole liver (Barber, et. ~.,. 1960).. A cross section of the tríceps. shoulder muscles was removed 24 to 48 hours post'-mortem.. Inter~. muscular fat was trirnmed from the tisEue and samples were stored in plastic bags and froze.n at -16°C until they were lypholi.zed. Prior to lypholizing, aU tissue samples were cat into small aUces and placed in liquid nitrogen.. After a few minates, the. sample was removed and cracked by using a mortar and pestle. cracked samples were irnmediately placed on the lypholizer.. The After 48. hours the sampIes were removed and ground in a porcelain mortar and pestle.. The ground samples were stored in air-tight gIass. containers~.fltil. analyzed.. Data collected from each experiment were. statisti<oally analyzed by the method of Analysis of Va:ri.ance as Otiltlined by Snedecor and CochlOan (1967).. Unless stated otherwise,. references to statistical significance pertain to a probability level of 5 percent or less..
(43) -31-. TABLE 4.. COMPOSITION OF BASAL DIETS Trial. Ingredient Ground yellow corn (8.97. proteinl Soybean meal, 49% protein Dicalcium phosphate Calcium carbonate Iodized salt Potassium chloride Trace mineral mixa Vitarnin-additive prernixb Total. 1. Il. 82.80 15.00 0.85 0.75 0.50 .05 .05 100.0. 78.75 18.65 1.20 .80 .25 .25 .05 .05 100.0. III 78.75 18.65 1.20 .80 .25 .25 .05 .05 100.0. a, bContributed the following per kilograrn of diet: aZinc, 100 rng; Iron, 50 mg; Manganese, 27.5 mg; copper, 5.5 mg; lodine, 0.75 rng; cobalt, 0.5 mg. bVitamin A, 2')203 I~U.; Vitamin D2, 441 I.D.; Riboflaviu 3 4 .. 4 rng;. Pantothenic acid 11 mg; Niacin, 22 mg; Vitamin B12, 11 mcg..
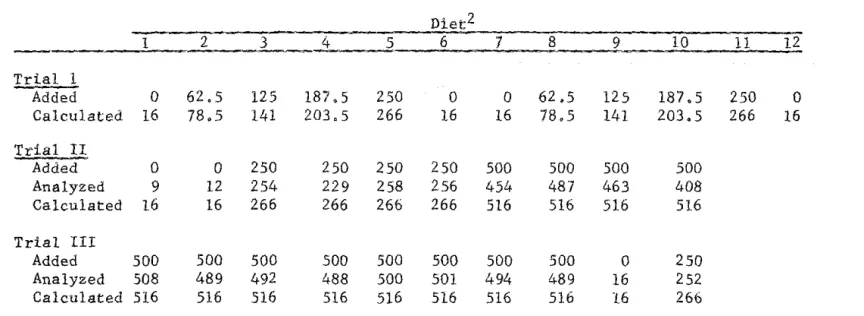
(44) ,'. TABLE 5.. SUMMARIES OF ADDED, ANALYZED AND CALCULATED COPPER CONTENT (PPM OF EXPERIMENTAL DIETS. 2. 3. 4. 5. Dlet 2 6. 62.5 78.5. 125 141. 187.5 203.5. 250 266. O. O. 16. O. O. 9. 12 16. 250 254 266. 250 229 266. 250 258 266. 500 492 516. 500 488 516. 500 500 516. 1 Trial 1 Added Ca1cu1ated Tria1 Il Added Ana1yzed Calcu1ated. O. 16. 16. Trial III Added 500 Analyzed 508 Ca1culated 516. 500 489. 516. 8. 9. 10. 11. 12. 16. 62.5 78.5. 125 141. 187.5 203.5. 250 266. 16. 250 256 266. 500 454 516. 500 487 516. 500 463 516. 500 408 516. 500 501 516. 500 494 516. 500. O. 489. 16 16. 250 252 266. 7. 516. 2Diets were ca1cu1ated to contain 16 ppm of copper from the natural ingredients (10.5 ppm) and the trace mineral mix (5.5 ppm).. O. «. w. ,. N.
(45) -33Analytícal Methods Hemoglobin Hemoglobin concentrations were determined by a modificatían of the Hacid hematin" method from Hawks Physiological Chemistry (1965). Five mI of 0.1 metric tube.. ~. hydrochloric acid were pipetted into each colori-. Heparinized blood (0.02 mI) was pipetted into each tube. and the tube was inverted several times.. This mixture was allowed to. stand for one hour after which time pereent transmittancy Was read on ·. '". a standardized colorimeter l at a wavelength of 520 millimicrons. Heme standards made from bovine hemoglobin (powder) were carried. •. through the same procedure as for blood.. The percent transmittancy. was converted to optical density and the optical density per unit of hemoglobin was determined for the standards used and the slope of the standard curves was used in calculating the amount of hemoglobin in the test samples. Hematocrit. Hematocrit levels were determined by centrifugation of heparinized bload in capillary tubes.. Values were read fram a chart. supplied with the micro-eapillary hematacrit centrifuge 2 • Liver Copper Alto 3 g sample of lypholized liver was accurately weighed. •. and placed in a 100 mI Kjeldahl flask.. Thirty mI of nitrie aeid. lBausch and Lamb, Inc., Rochester, New York. ?. -lnternational Equipment Company; Boston, Massachusetts..
(46) -34were pípetted into each sample and allowed to stand overnight.. Fíve. mI of sulfurie acid and three glass beads were added to the mixt.ure whieh was then boDed until a black color developed.. The rr.:Lxture. was eooled and 10 ml of nítric acid plus 2 ml of perchloric acid were added.. Boiling was resumed and continued úntil the mixture. turned clear and dense white fumes appeared in the bu lb of lhe flask.. -. The solution was cooled ~ t't:anaferred to a voh..met,t'ic flask and brought to volume with double,odelonízed water.. Ar. al iquot of. each sample solution was aspirated into the standardized spectrophotometer for copper detentdnation •. •. Muscle Copper Samples. approx;;mateIy r-h:ree grams. of lypholized tdceps muscle werE-, accurately weighed and pl"ced JI>, 100 mI Kj€ldahl. flaskso. The digestion was c3rrieci out as outlined for liver. coppe.r analysíso. Froro th.is stage on the techniqües described by. Stevens 1 were employedo. After eaeh "ateple was digested, 10 mI. of dm..i.ble':·delonized wateT we1.'E.'. added. Q. The solut.:l.on 'was adjusted. to pH 4.0 with arnm;Jnium hydcox1.de '"sing litmus pH paper as an indLcator. Two mI oi a satsrated 801,,tLon of amrronium pyrrolídino dithiocarbamate were pipetted ir.to eaeh flask and the flasks were shaken.. Five mI of met-hyl isob;¡tyl ketone were pipetted into. lStevens, Bo Jo, 1969. Royal Chi,ldren' s Hospital. Melbourne, Victoria 3052, Austral'i.ao Personal Cornmunication. Cited by Kline, R. D. (1970)..
(47) -35~. each flask and the flasks were shaken in a mechanical shaker tor 10 minutes.. The top phase was pipetted off and aspirated into the. standardized spectrophotometer for copper analysls. All copper, iron and zinc analysis were performed by lising a Perkin-Elmer Atomic Absorption Spectrophotometer Mode1 303 1 •. I. , l. I I. •. lperkin""Elmer Corporatíon, Norwalké'. Connecticüt~.
(48) CHAPTER IV. EXPERIMENTAL RESULIS Trial 1 - Related Effects of Copper, Chlort.etracycline and Vitamin E on Performance" Hemoglobin Levels and Liver Stores of Copper, Iron and Zinc in Growing--Finishing Pigs. Objectives Cass:i.dy and Eva (1958)" Bunch et. al. (1963) and Hanrahan and O'Grady (1968) have demonstrated an inverse re1atior,ship between the levels of iron in the liver of pigs and also Ritchie et al. (1963), De Goey et a1..n971), Hanrahan and O'Grady (1968), showed a direct relationship between liver copper and zinc levels. Wallace (1967), and Ritcbie ét al. (1963) have ShOWfl a depressing effect of copper at 1evels as low as 250 ppm on hemoglobin c.oncentrations. ~. These 'reporta are ~ however, in dis ~. agreement with t:he reports of Castell and Bowland (1968b) and Kline et aL (1971). Ihis expeYi.ment was designed lo further study the effects of level of dietar:r copper on performance hemoglobin concentration,. and liver stores of copper, iron and zinc in growing finishing pigs. Procedüre. One hundred and eighty Yorkshire pigs averagíng 21.4 kg body weight anf 53.1 days of age were allotted to a randomized complete block designo. The pigs were randomly allotted from weight groups -36-.
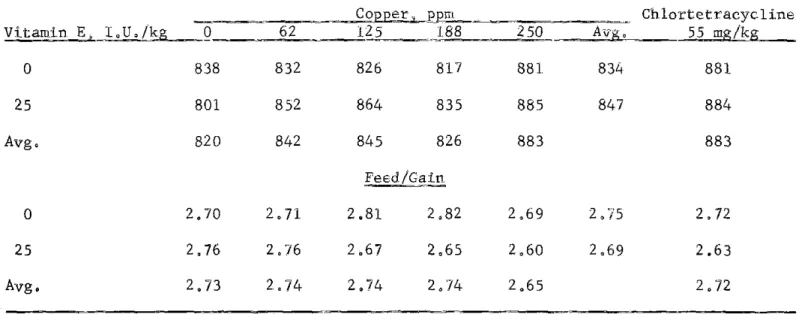
(49) -37-. within sex to 12 treatments with three replicatíons of five pigs per pen for eaeh treatment.. A restriction that litterrnates be. distributed aeross treatments was imposed on the randomization.. The. treatments were a factorial arrangement of five levels of added copper (O, 62.5, 125, 187.5 and 250 ppm) and two levels of Vi.tamin E (O and 25 1. U. /kg of feed) plus two treatments of chlortetracycline, (55 rng/kg of feed) without or with Vitamin E.. The VitamiTi E. variable was included to determine whether the high level of copper was increasing the dietary Vitamin E requirement. and also the ant.ibiotic treatments were included as a positive control for the growth promoting activity of supplemental copper.. The composit.ioTi of the. experimental diet is presented in table 4. The experiment was terminated as the pigs individually reached 92 kg body weíght. 010. weekly weighings and were on experiment. an average of 87 days at whích time the pigs averaged 94.1 kg body weight.. Blood samples were taken from aIl pigs at the start of the. experiment, and after 81 days, for the UrBt replication and 67 days for the other two replicatíons, and the hemoglobi.n determined on a11 samples. The barrows from each pen were slaughtered and Uvers were collected for mineral analysis. Results Surnmaries of results and analyses oí varLance for average daily gain and feed required per unit of gain to 57 kg body weight are presented in table 6 and Appendíx Table L.
(50) +. TABLE 6.. TRIAL lo. SUMMARIES OF AVERAGE DAILY GAIN AND FEED REQUIRED PER UNIT OF GAIN 10 57 KG OF WEIGHT. O. 62. 125. 188. 250. Avgo. Chlortet.racyc line 55 rng/kl?i-. O. 838. 832. 826. 817. 881. 834. 881. 25. 801. 852. 864. 835. 885. 847. 884. Avg.. 820. 842. 845. 826. 883. Copp~l'E!!L... Vitamln E, 1. U. /kg. 883. Feed/GaLn O. 2.70. 2.71. 2.81. 2.82. 2.69. 2.75. 2.72. 25. 2.76. 2.76. 2.67. 2.65. 2.60. 2.69. 2.63. Avg.. 2.73. 2.74. 2.74. 2.74. 2.65. 2.72. ,. w. 00.
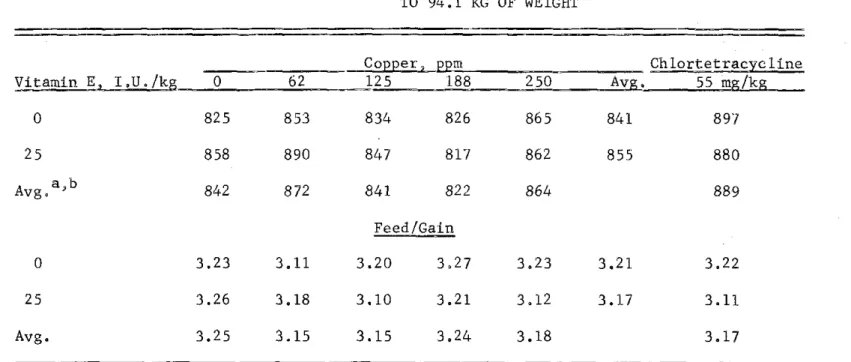
(51) Rate of gain to 57 kg body weight tended to increase at each copper level.. The trend, however, was not statistically signifi-. cant (P(.05).. Also the rate of gain was higher for the. chlortetrocycline fed pig than for the pigs fed the control diet:. Rate of gain was similar for pigs fed chlortetrocycline and those fed the high level of copper.. Al each level of copper, pigs fed. diets supplemented with Vitamin E gained faster than those fed the unsupplemented diet, however lhe difference was not statistically significant. Feed requixed per unit of gaín díd not show any significant trends though pigs fed diets containing 250 ppm of copper required less feed per unit gain than dld pigs fed other diets. As shoW". in tabIe 7 and Appendix Table 2, during che entire experimental period animals fed antil;iotic gained fas ter than the average for a11 other treatments. There was a significant clCbic effect of copper level on average dálly gain.. This reóulted from an improveme.nt at 62 and. 250 ppm and no in.crease in orate of gain at the lntertnediate levels". Feed efficiency did not sho« any significant trends; although, with the except.i.on of the 188 ppm level, t.hO"6 pigs fed dieta supplemented with eopper, required less feed per unit of gain than díd the pígs fed the control dieto. Pigs fed the diets supplemented with. chlortetrocyeline requíred 1ess feed per unit of gain than those fed a11 other diets.. This was primarily due to the hígher amount. required by the pigs fed diets without copper as the average for.
(52) TABLE 7.. TRIAL l.. SUMMARIES OF AVERAGE DAILY GAIN AND FEED REQUIRED PER UNIT OF GAIN TO 94.1 KG OF WEIGHT. Ch1ortetracyc1ine 55 mg/kg. O. 62. COEEer, EErn 125 188. 250. O. 825. 853. 834. 826. 865. 841. 897. 25. 858. 890. 847. 817. 862. 855. 880. 842. 872. 841. 822. 864. Vitarnin E, LU. /kg. Avg. a,b. Avg~. 889. Feed/Gain 3.23. 3.11. 3.20. 3.27. 3.23. 3.21. 3.22. 25. 3.26. 3.18. 3.10. 3.21. 3.12. 3.17. 3.11. Avg.. 3.25. 3.15. 3.15. 3.24. 3.18. O. aCh1ortetracyc1ine vs others significant (P<.05). bCubic regression of gain on leve1 of copper significant (P(.05) .. 3.17. J.. o I.
(53) -41the copper supplemented pigs was very similar to that of the chlortetracycline supplemented pigs (3.18 vs 3.17). Summary of hemog1obin concentration i8 presented in table 8 and analyses of variance is presented in Appendix Table l.. There. were no significant effects of copper chlortetracycline or Vitamin E on hemoglobin levels and the means for the main effects were very similare. Summaries of liver copper, iron and zinc are presented in table 9 and Appendix Table 2.. There was a highly significant. difference between the mean level copper of pigs fed antibiotic treatments and those fed a11 other diets which was a result of ¡. the expected increase in liver copper levels resulting from the. 1. copper treatments.. The means for the chlortetracycline treated. pigs was near identical to the groups fed neither copper nor ant1biotic (12 vs 11 ppm). There was a highly significant quadratic effect of dietary copper on liver copper levels with a fourfold increase in level of copper in liver of pigs fed at 188 ppm of copper and a twelvefold increase in the liver of pigs fed diets containing 250 ppm. The liver iron 1evels were inversely related to liver copper levels.. There was a highly significant difference between. antibiotic treatments and a11 other treatments which again i6 a reflection of the effects of the high copper treatments.. There. was a highly significant quadratic effect due to copper 1evels..
(54) ¡. TABLE 8.. TRIAL 1.. Vitamín E, I.U./kg. o. SUMMARIES OF HEMOGLOBIN CONCEN'IRATIONS AFTER 67 AND 81 DAYSa ON EXPERIMENTb. COl2eer¡.J2J2!!! 188. o. 62. 12~. 12.9. 13.2. 13.4. 13,3. eh lortetraeyc line 250. Avgo. 55 mg/kg. 13.6. 13.3. 13.4. 25. 13.5. 13 .1. 13.4. 13.0. 13.4. Avg.. 13 .2. 13.2. 13.4. 13.2. 13.5. l3 .3. 13.5. aRep1ication one had been on experiment 81 days and ·ceplications 2 and 3 had been on experiment 67 days at the time hemoglobin va1ue.s were measured. b For ana1ysis of variance see Appendix Table 1.. i. -J> N I.
(55) TABLE 9.. TRIAL l.. Vitamin E, 1. U ./kg. SUMMARIES OF LIVER COPPER, IRON AND ZINC LEVELS a. O. 62. COB12 er , BEm 125 188. Ch1ortetrac¡cline 250. Avg,. 55 mg/kg. O. 11. 15. 22. 56. 285. 78. 11. 25. 12. 12. 21. 121. 263. 53. 13. Avg. a. 11. 14. 22. 88. 274. Liver Iron, ppm of Dr¡ Matter O. 568. 627. 593. 479. 245. 502. 593. 25. 657. 626. 488. 504. 255. 506. 586. Avg.. 612. 626. 540. 491. 250. 590. Liver Zinc, ppm of Dry Matter C O. 205. 195. 208. 231. 224. 212. 175. 25. 191. 204. 183. 202. 219. 200. 197. Avg,b. 198. 199. 196. 216. 222. 186. aFor analysis of varíances see Appendix Tab1e 2. bQuadratic regression of líver copper and liver iron on dietary copper signifícant (PCOl). cLinear regressíon of 1iver zinc and dietary copper significant (P(.Ol) •. , '", -".
(56) -44lt was inversely related to the liver copper responses, but the magnitude of the differences were not nearly so marked.. This. decrease in liver iron levels was a smooth descending line to 188 ppm of dietary copper but marked dec.rease in the liver iron levela of pigs fed the diets containing 250 ppm of copper occ.urred.. '['he. liver iron leV'els of the pigs fed the high copper level were only about ane third that of pigs fed the c.ont.rol dLet (250 vs 612 ppm). For liver zinc there was a1so a highly sIgIdficant differenc.e between pigs fed the antibiotic. süpplemented diets and all other groups.. Ihis again 18 a reflection of the copper. effects as the levels in the antibiotic supplemented group were similar to those in the control groo.ps. A highly significant linear Ínereélse in liver zinc resulted from increasing dietary leve ls of copper.. '['he magnit.ude of the. change was re1atively small in eompar:ison with c.hanges in ieon or copper leve1s.. The high level of die.tary copper resulted in. approximately ID percent h:1.gher l:lver zinc 1eve18 (198 vs 222 ppm). Vitamin E supplementation had no signifieant effec.t on the liver 1eve1s of copper, iron or zinc., however there was a trend toward a moderating effect oE di.etary copper, if the Vitamin E was presento. However the. differ""ces were small and the variahility in. liver levels were exceptionally great, partic.ularly so for liver copper..
(57) -45Trial 11 - Related Effects of Copper, Sulfide and Molybdenum on Performance, Hemoglobin and Hematocrit Levels and Liver Copper Levels of C·rowing-Finishing Pigs. Objectives It has been reported that it 1S possible to lower excessive copper stores in sheep by supplementing their diet with sulfate and molybdenum Dick, 1954b.. It has also been suggested sulfate lS. reduced to sulfide and that the resulting sulfide is responsib1e for the reduction in retention of c.opper in che body (Lewis, 1954). According to Mills (1960) in the growing nonruminant, the sulfate is not reduced to sulfide at arate sutfLdent to reduce the amounts of copper stored in the body.. Kline et. ~.,. (1971) found that liver. copper levels could be lowered by supplementing t:he dLet with a high level of sulfide (1800 ppm); k,t, they also found sorne reduction in rate of gaLn.. Certainly this wauld be an undesirab1e effec:t of the. high leve1 of suIfíde; therefore, it was desired to evaluate rhe effects of lower levels of suIfide aod a1so to determine if. molyb~. denum is alBo nece:ssary as an antagonist "::0 excessivl2 Lbrer copper. deposition.. This experiment was designed to gtudy the reIated. effects of geometric progressions of suInde aod a low level of molybdenum in combinatían with two Ievels of copper sulfate on rate of gain, feed efficiency, hemoglobin and he.matocrit levels and levels of copper in muscle (the triceps muscle oC the shoulder) and liver in growing-finishing pigs. Pracedure Eighty Hampshire and Yorkshire x Hampshire pigs averaging 16.5 kg body weight and 60 days oí age were al10tted to a randomized.
(58) -46-. complete block designo. Pigs were randomly allotted from weight out-. come groups within sex and breed to ten treatments with two replications of four pigs per pen for each treatment.. Randomization. was restricted in that Uttermates were distributed across treatments.. The dietary treatments included a factorial arrangement of. two levels of added copper (250 and 500 ppm) levels (O, 450, 900 and 1800 ppm) of sulphur as sulfide. all eight diets.. Molybdenom (25 ppm) was added to. Two additional dietary treatments included. molybdenum alone and a negative control t.hat included neither of the three minerals mentioned.. Copper sulfate (CuS04.5H20) sodlum. sulfide (Na2S, 60 percent) and ammonillID molybdate (NH4)6Mo7024.4H20 were the mineral sources used.. PotassiJm clorlde (,25 percent) was. added to a11 diets so lhat a sodium and pot"asslum ínbalance would not resulto. lhe composition and calculated analysis of the. experimental diets are presented in tables 4 and 5.. The experiment. was terminated aft.er 103 days at which time the pigs averaged 89.6 kg body weight.. Blood sample.s were taken froro a11 pigs at the. ínitiation, and after 57 and 94 days on experimento. Hemoglobin and. hematocrit levels were determined at the three bleedings.. Two. barrows from each pen were slaughtered and tissues were removed for copper analysis. Results Summaries of results and analyses of variance for average daily gain and feed required per unit of gain are presented in table 10 and Appendix Table 3.. There was no significant (pe 05) differences.
(59) TABLE 10. TRIAL II.. SUMMARIES OF AVERAGE DAILY GAIN, AND FEED REQUIRED PER UNIT OF GAIN. O. 450. Sulphur, EEmc 900. 250. 706. 726. 763. 745. 735. 715 a. 500. 603. 739. 723. 683. 687. 703 b. Avg.. 655. 733. 743. 714. Copper, prm. lSOO. Avg.. Control. I. .p-.J I. Feed/Gain 250. 3.07. 3.15. 3.08. 3.17. 3.12. 3.0S a. 500. 3.14. 3.07. 3.1S. 3.06. 3.11. 2.9S b. Avg.. 3.11. 3.11. 3.13. 3.12. aNo copper, molybdenurn or sulfíde added. bNo copper, no sulfide added but 25 ppm molybdenurn added. CMolybdenurn (25 ppm) was added to the eight diets supplemented with copper..
(60) -48in average daily gain arnong the dietary treatments but there was a tendency of slower gains in pigs fed the highest level of sulfide and in pigs fed diets containing 500 ppm of copper.. The quadratic. effect of sulfide level on rate of galn was significant at the probability level of 0.10.. Also at the O level of sulfide there. appeared to be a reduction in rate of growth (603 vs 706) resulting from the level of copper, however, neither the main effect of copper nor the copper x sulfide interaction was. signifi~. cant (P(.05). There were no differences in feed efficiency that could be associated with dietary treatment.. At 250 ppm of copper supple-. mentation, the better feed efficiencies corresponded to O and 900 ppm of sulfide.. Conversely, at 500 ppm of copper, the better. feed efficiencies were obtained at 450 and 1900 ppm of sulfide. In any of the dietary levels of copper, the feed efficiencies were superior to the control dieto.
(61) -49Surnmaries of results and analysis of varíance for hemoglobin and hematocrit levels are presented in tablell and Appendix Table 3. Hemoglobin and hematocrit levels were depressed by feeding 500 ppm of copper.. There was a highly significant effect of sulfide on. hemoglobin and hematocrit levels, t.he major effect being in the pigs fed the higher (500 ppm) level of copper.. The interaction of copper. and sulfide on hemoglobin and hematocrit levels was significant (P..(.05).. The linear and quadratic components of vari.ance for. hemoglobin levels and the linear component for hematocrit levels were statistically significanto. In each case the levels tended to plateau. at 450 to 900 ppm of sulfide. Surnmaries of muscle and liver copper stores are presented in table 12 and Appendix Table 4.. Only one pig per treatment was. sampled for the musele levels thus Dne cannot test treatment effects. This surnmary shows the very low level of coppe'r in the muscles of pigs fed high levels of copper, and offers no evidence that the level is higher as a result of feeding diets containing 500 ppm of copper. Increasing the dietary level of copper signifícantly (P<.05) íncreased liver copper stores.. The level of 250 ppm without. sulfiode resulted in about a twentyfold increase and the level of 500 ppm without sulfide resulted in a hundredfold increase. The líver copper levels declined quadratically with increasing sulfíde levels and there was a highly signifi.cant copper by sulfide level interaction.. In combination wi.th 250 ppm of copper, 900 ppm of. sulfide resulted in copper levels near the controls (18 vs 12.5).. In.
(62) TABLE 11.. TRIAL 11.. Copper, ppm. o. SUMMARIES OF HEMOGLOBIN CONCENTRATIONS AND HEMATOCRIT LEVELS. 450. Su1phur, ppma 900. 1800. Avg.. Contro1s. Hemog1obin, g/lOO m1 250. 15.3. 16.2. 16,3. 15.5. 15.8. 500. 10.8. 13.7. 14.2. 15,3. 13.5. Avg, e. 13.1. 15.0. 15.3. 15.4. Hematocrit,. I. %. en. o I. 250. 42,1. 41.1. 43,5. 41.4. 42.0. 500. 30.8. 38,8. 39.0. 40.4. 37.5. 36.5. 40.0. 41.2. 40.9. Avg.. f. aMo1ybdenum (25 ppm) was added to the eight diets containing added copper and su1fide 1eve1s. bDifference in hemog1obin and hematocrit 1eve1s in the comparison 250 vs 500 ppm of copper was significant (P .01) CNegative control diet for a11 three supplementa1 minera1s. dMo 1ybdenum, (25 ppm) added to this dieto eQuadratic effect of su1fide and the copper by su1fide interaction significant (P<,05). fLinear effect of su1fide and the copper by su1fide interaction significant ( P<.05)..
(63) .... -. t. TABLE 12.. TRIAL 11.. COEEer, EEm. O. SUMMARIES OF THE COPPER LEVELS IN THE TRICEPS MUSCLE OF THE SHOULDER AND IN THE LIVERa,b. 450. Sulehur, EEm 900. 1800. Avg.. Shoulder Copper , ppm of Dry Matter. a. 250. 2.48. 1.51. 2.06. 3.11. 2.29. 500. 2.26. 2.95. 1.72. 1.52. 2.11. Avg.. 2.37. 2.23. 1.89. 2.32. Liver COEEer ~ PEm Di Dry Matter. Contro1s. I. en ,.... b. I. 250. 237. 29. 18. 19. 76. 13. 500. 1332. 613. 98. 40. 520. 12. 784. 321. 58. 30. Avg. ~he. means are samples of one pig per treatment. bInclude analysis of 39 1ivers. CNegative control diet for al1 three supplemental minerals. dMo1ybdenum, (25 ppm) added to this dieto. c d.
(64) -52the presence of 500 ppm of copper, sulfide resu1ted in a marked reduction, but even at the highest 1eve1 of su1fide (1800 ppm) the 1eve1 in the 1iver was stil1 three times that of control (40 vs 125)..
Figure

+7


Documento similar
polarized alkenes have so far been limited to aryl-substituted olefins. 11 Second, despite the excellent work on diastereose- lective functionalization of cyclopropenes
The aims of the research described here were to determine the total and bioavailable contents of Cu and Zn in soils in the vineyards of La Rioja, both at the surface and at depth,
Fast and efficient direct formation of size- controlled nanostructures of coordination polymers based on copper(I)-iodine bearing functional pyridine terminal
Regarding the energy decomposition of acetylene complex, listed by substituent and copper salt, the behavior along the set of studied compounds is slightly similar as the
The content of this dissertation comprises the design of two arc-discharge plasma (ADP) reactors (a conventional and a modified one); the experimental study of the different
However, in the case of copper, hundreds of complexes based on picolinic acid derivatives have been prepared, giving rise to molecular complexes [20, 21]
Copper-doped titanium dioxide materials with anatase phase (Cu-TiO 2 , atomic Cu contents ranging from 0 to 3% relative to the sum of Cu and Ti), and particle sizes of
It was not until 2005, when Sawamura reported the copper-catalyzed borylation of allylic carbonates, that the synthetic potential of copper- catalyzed
