A model of acceptance of virtual reality by tourists in the selection of destinations
26
0
0
Texto completo
(2) A model of acceptance of virtual reality by tourists in the selection of destinations (Forteza-Grimalt, I., 2017). A model of acceptance of virtual reality by tourists in the selection of destinations Analysis of the strengths and weaknesses of Virtual Reality to promote destinies, exotic packages or unknown destinies. Ignasi Forteza Grimalt Universidad de les Illes Balears. Abstract Virtual Reality (VR) is a device with the potential to change habits, connect people or influence in the decision-making process. These facts generate a tremendous potential in the tourism industry and, specially, can be considered to be applied in the destination management process. However, today it has not been widely implemented in the tourism, nor companies have implemented all the different qualities that VR can bring in this sector. This research analyzes how virtual reality influence in the promotion of some tourism destinations and explains the different uses of this technology applied to the tourism sector and which is the actual level of acceptance of the technology. We extracted a primary data through a survey to estimate the potential of VR in tourism. In the analysis we found out the population’s knowledge about this new technology and determine which is their level of acceptance of VR applied to the tourism sector. This research analyses the strengths and weaknesses of Virtual Reality, and it offers some tips to implement it easily in the tourism industry. In particular, it has been determined the importance of the variable enjoyment in the implementation of the VR as well as the variables Social influence and Ease of use although to a lesser extent. In addition, this paper gives additional suggestions about the capacity of VR to replace the in situ travel in exchange of an augmented reality experience.. 2.
(3) A model of acceptance of virtual reality by tourists in the selection of destinations (Forteza-Grimalt, I., 2017). 1. Introduction. Tourism is a highly challenging field in the world economy. Like all industries and sectors of the world, tourism is one of the most affected sectors with technological developments. Furthermore, people are open to experience latest technological advances in the tourism sector as mentioned by Javier Blanco, director of UNWTO (World Tourism Organization (UNWTO) Affiliate Members, 2011), “change is becoming more obvious and constant”. Nowadays, most of the people are using the internet and mobile applications for booking their travels, from their flight tickets to hotel rooms, or from purchasing tourist attraction tours to renting a car. Undoubtedly, there can be still upcoming exciting evolutions in tourism which will be introduced to us through all these rapidly high technological changes. First of all, we are going to explain what virtual reality is, and as Burdea Grigore & Coiffet (1994) said: “a computer-generated, immersive, multi-sensory information program which tracks a user in real time”. In addition, VR is also related to the usage of specific hi-tech devices called “VR Headsets” for generating realistic images, sounds and sensations. When you wear this headset, it allows you to experience an immersive simulation of that environment. In addition to these headsets, there can be many other components like lights, heaters or air conditioning which can be used in order to create a very close physical presence for the user in that specific location. In tourism, people are travelling all around the world to experience so different and unique moments in their lifetime. Sometimes, there can be barriers, for example, not having enough time to discover all touristic places in a destination during the holidays time. There can also be economic reasons for not involving in such attractions. Additionally, in today’s world, we can consider serious security problems in many destinations because of terrorist attacks. All these factors can be a potential obstacle for tourists travelling to some destinations (Far & Duarte, 2015). Nowadays, tourism is one of the largest economies turnovers in our society which is mainly concentrated in travelling, hotels or restaurants activities. Moreover, society tends to be even more connected every day and the social media is assuming a key role to guide our development. Thanks to these facts, developing virtual systems and devices has become one of the major's concerns for the actual businesses. Therefore, the study of VR devices which allows the user to be connected with social media while they are having their travel experience, has become a priority for some of the biggest world businesses (Lévy, 1998). On the real-estate agencies we can find an example of a good implementation of VR devices in which companies are using VR instead of showing houses physically or in photos. It’s a fact that VR on real-estate agencies is working well, so comparing to other sectors a VR implementation could be interesting (Far & Duarte, 2015). 3.
(4) A model of acceptance of virtual reality by tourists in the selection of destinations (Forteza-Grimalt, I., 2017). We can also find a clear example on the financial side, where the investment on VR devices has been increased and, a lot of important businesses have made a big investment to join in this market opportunity. For instance, Facebook has invested $2 billion on the Oculus Rift (VR device) in March 2014 or when Google spent $542 million on Magic Leap (Barnes, 2017). These are some examples of businesses which are making a lot of efforts to implement this new technology. Then we can conclude that businesses are trying to expand this VR market as they also consider that the society is prepared to face this new technology (Lévy, 1998). When we consider all these together, we can comment that travel habits and behaviours of people can turn into other forms in the near time and future. At this point, VR can be a favourable option for travellers in order to save time and money regarding economical or other reasons. 1.1. Objectives. The aim of the following document is to identify and understand how virtual reality can help to develop the force sales of the touristic business and discover the different utilities of VR devices in the field of tourism. For instance, to promote destinations, discover unknown places or to offer exotic packages. Furthermore, we are going to analyze: the state of use of virtual reality in the tourism sector and the difficulties of their implementation on the demand side. For instance, which are the consumers that may be relevant to focus on. We also have to consider that this is a technology which still lacks maturity on the side of content generation, and it is possible that users do not consider to view a destination though VR yet. In order to compare the different possibilities that VR can offer in the tourism sector we will look for the weaknesses and strengths of their implementation. Moreover, we are going to contrast some hypothesis mentioned before by other authors in order to compare them with our results obtained with the survey. Due to this we are going to extract our conclusions about the VR sales force and the different barriers that we could encounter during the implementation. To achieve this goal, we are going to propose a model of technology acceptance of VR applied to the touristic sector. Due to this we are going to study them globally or by sectors, for example, studying the attitude towards innovation or the behavioural intention. In the following sections of this report, you will see details of our research about this topic and the research technique that we have implemented which is called Advanced Research Model of Innovation Adoption (AMIA) (Frambach & Schillewaert, 2002).. 4.
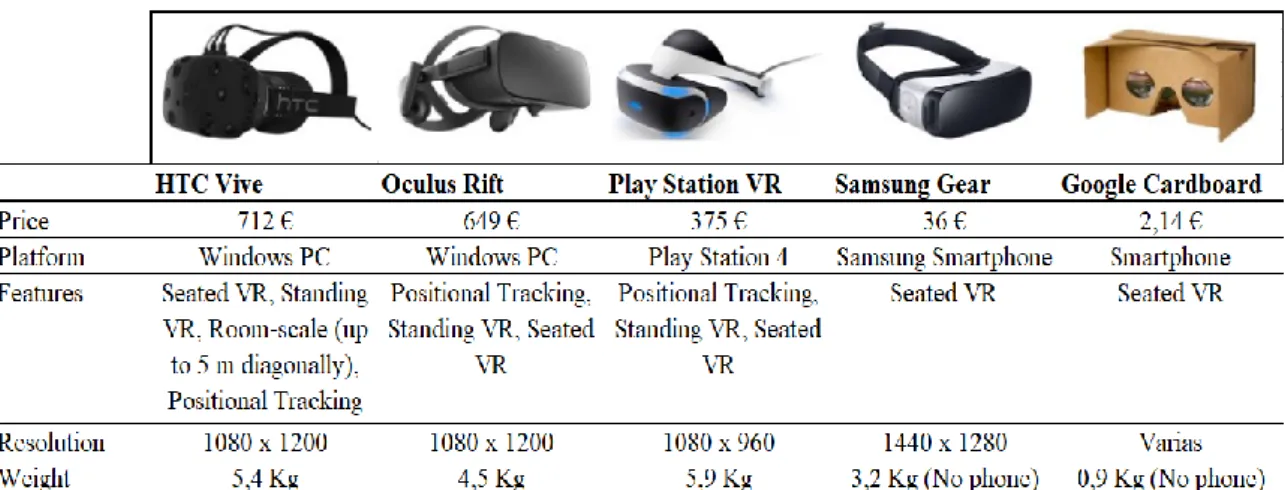
(5) A model of acceptance of virtual reality by tourists in the selection of destinations (Forteza-Grimalt, I., 2017). This document discusses the background variables of the intention to use virtual reality in the tourism sector. To this end, a relational model consisting of the following variables: Ease of use, Enjoyment of innovation, Personal innovativeness, Social influence, Training, Perceived usefulness, Attitude toward VR technology and Behavioural intention is proposed. With this model, we are going to have a wide vision about the implementation of VR in tourism and discover the social thought about this technology. Then, this model can complement other experts’ studies, offering another vision thanks to the application of another model of acceptance and introducing new complementary factors to complete previous researches. Therefore, important contributions of this paper are: first, the development of a model composed of the following variables. Second, the validation of this model will have important consequences for academic literature, as well as practical implications. Third, offer a wider knowledge about the VR in tourism and their impacts in our society. And finally, provide a useful model capable of being used by future researchers in order to amplify the knowledge of VR applied to tourism.. 2. Actual situation of the Virtual Reality. Nowadays VR is an increasing market in which some of the most important business are trying to potentiate it (Doyle, Gelman, & Gill, 2016). For instance, Sony, Google or Samsung are introducing new gears to the market. Furthermore, other big businesses like Facebook and YouTube, which are not specialized in VR devices are trying to introduce this concept in their features. Due to this, they are obtaining another way to develop their core business and this gives to the final customer another view and sensations which are impossible to experience it without the augmented reality. In order to summarize the way that they applied these concepts, Doyle, Gelman & Gill said in 2016: “Facebook 360 and YouTube 360 are leading the way in providing simple ways to upload and use basic viewers to look at spherical video in VR. Headsets from HTC and Facebook’s Oculus were expected to be released during the first half of 2016, albeit at higher-end price points that may make them unaffordable to many who want to try VR”. During 2016 this new technology has become famous and has been offered in full-scale and nowadays most of the population can have access to it. This is also thanks to their price that has been decreased during these lasts years. An example of this decrement is that nowadays people can acquire this technology for a wide amount of prices that oscillate between 2,14€ (Goggle Cardboard) to more than 919€ for instance Oculus Rift or HTC vive (see table 1).. 5.
(6) A model of acceptance of virtual reality by tourists in the selection of destinations (Forteza-Grimalt, I., 2017). Table 1. Virtual Reality headset comparison chart. Source: Reddit's Vive group, Amazon information.. VR has a lot of possibilities to offer but there is an attribute to remark: the special capacity to generate and visualize different spatial environments. (Vince, 2004) 2.1. Actual use of VR applied to tourism. Nowadays, different market sectors are trying to implement the latest technologies in order to improve and renovate themselves. That is the case of VR which some market sectors are trying to implement and proportionate added value with this new technology. For instance, in entertainment, healthcare or education sectors have already implemented this technology in some sets of their production. That is also the case of tourism which tries to incorporate this technology into everyday life in order to obtain new profitable and more efficient ways to expand the tourism sector. “As VR technologies continue to advance, the possibilities for using VR within the tourism sector will grow” (Guttentag, 2010). Doing this study, we also want to give some additional advises about the capacity of VR to replace the in-situ travel in exchange of an augmented reality experience and transform our way of seeing tourism (Polimeris & Calfoglou, 2016). Based on Lisnevska opinion: VR experience can help the customer in the decisionmaking process. This is thanks to the information obtained in VR devices which makes the customer have a more accurate experience. Helping them to adjust their experience to the travel expectations (Lisnevska, 2017). Furthermore, VR has a lot of opportunities in the tourism field, for instance, helps to increase the curiosity of the customer toward a concrete tourism destination. This is thanks to the “virtual tours” which consist in panoramic photography and shows the client a different perspective of a concrete place. These virtual tours are closed tours and customers cannot reach other places which are not inside these photographies (Guttentag, 2010). Thanks to this “virtual tours” and other similar VR applications, viewers can learn 6.
(7) A model of acceptance of virtual reality by tourists in the selection of destinations (Forteza-Grimalt, I., 2017). more about the travel destination in a faster and interactive way, helping them to have a widely overview about the destination (Lisnevska, 2017). VR can be widely applied, even in the marketing sector. VR has an important potential need to be developed and, as Williams and Hobson (1995) have predicted: ‘‘from a marketing perspective, VR has the potential to revolutionize the promotion and selling of tourism’’. For this reason, nowadays, a lot of businesses in the tourism sector are trying to develop their marketing strategy, for instance making videos with the capability of being reproduced on VR devices to promote specific places. 2.2. Attitude and behavioural intention. In our research about the behavioral intention on VR devices we have discovered that the VR experience tends to be likeable for the client and also informative. In a research realized by Marchiori, Niforatos & Preto (2017) users describe the VR experience as enjoyable, informative and amusing. For these reasons, we consider that VR has an incredible potential to be applied to a big mass of customers due to their acceptance and also for their price, which is decreasing in order to reach as many clients as possible. All these components are helping to develop and use, even further, this technology. On the customer side, we have found that thanks to the different range of prices, people can access easier to this technology and is more accepted by the society. (Barnes, 2017) Moreover, as Juniper Research (2015) has predicted, on 2020 the number of VR devices sales will be around 30 million, used mostly by videogames or for playing videos. This fact is produced by the increment of the popularity of this new device in the field of videogames and video reproduction. Thanks to the sales increment on VR devices, it will be easier to implement this technology in other fields because a lot of potential clients will have one in their houses.. 3 3.1. Literature Review Technology Acceptance Model (TAM). In our analysis we have proposed to use the model Advanced Research Model of Innovation Adoption (AMIA) (Frambach & Schillewaert, 2002). The main variables of AMIA are proposed by Talukder (2014). However, this model is also mixed with some variables proposed by Frambach & Schillewaert (2002) which introduces new concepts that may affect the final use intention in different ways. For example, the variables Organizational factors or Social network. The relationship between the variables was also tested and investigated to generate a compressive model and also introduced new variables. To sum up, Rejón & Palma (2017) described "the use of the AMIA model is based on: the theory of reasoned action (TRA) (Fishbein, 1979), the technology acceptance model (TAM) (Davis, 1986), the conceptual framework provided by (Frambach & Schillewaert, 2002), the unified theory of acceptance and use of technology. 7.
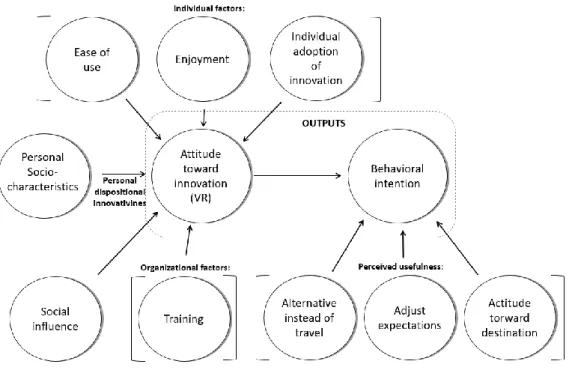
(8) A model of acceptance of virtual reality by tourists in the selection of destinations (Forteza-Grimalt, I., 2017). (UTAUT) (Ahmad, 2014), and DeLone and McLean’s model of information systems (Delone & McLean, 2003; Rejón & Palma, 2017). The components included in the AMIA model are divided in three categories of factors: Individual factors, Social influence, and Organizational factors, which have the most significant influence on the variables attitude and intention of use (Rejón & Palma, 2017). In our case the model also includes five independent variables of the AMIA model: Perceived usefulness; Personal innovativeness; Enjoyment of innovation; Social influence and Training. In addition, the model uses the variable Behavioural intention to predict the future consumer intention, and in our model this variable is influenced by the Attitude, Ease of use and Perceived usefulness (Rejón & Palma, 2017). Our model has been created using the AMIA model and the hypothesis are based in other authors’ reviews (see figure 1).. 4. Research Model and Hypotheses. In the model that we have proposed there are two important stages: the attitude and the behavioral intention. In our proposal the final goal is to predict the intention of use of VR devices in order to sell touristic destinations. This variable has a strong relationship with the attitude, for these reasons we are going to study the different elements that may affect both variables. In order to study Attitude towards innovation we are going to analyse the variables: perceived Ease of use, Enjoyment, Personal innovativeness, Personal socio-characteristics, Social influence and Previous training. Furthermore, to extract the final conclusions of the variable Behavioural intention, we have used the attitude toward VR as linkage including the indirect effects of the variables mentioned before. Due to this fact we can offer a more accurate analysis in order to predict the intention of use of the innovation. For these reasons, in our proposal model, the variable Behavioral intention can be influenced by consumers’ attitude and Perceived usefulness in order to predict more accurately the final adoption of the technology (Rejón & Palma, 2017).. 8.
(9) A model of acceptance of virtual reality by tourists in the selection of destinations (Forteza-Grimalt, I., 2017). Figure 1. Theoretical model proposed. Based on the experts’ opinions we have extracted the following hypothesis that we want to compare with the further analysis of our sample. First of all, in our model we are going to analyze the Perceived ease of use of the technology which as Davis, et al. (1989) said is the major variable that may affect to the acceptance of a particular technology. According to Lim & Ting (2012) and Venkatesh et al. (2003) the Perceived ease of use (PEOU) is influenced by multiple factors like technology usage, interfaces or needed efforts. Due to this fact, the major levels of complexity of the technology, slower the rate of adoption by the population there will be. For this reason, present a clear and understandable technology, which requires less efforts, can influence positively to the customers’ behavioral intention and their attitude toward the technology. According to these facts we propose the following hypothesis: Consumers’ perceived ease of use will positively influence Attitude toward innovation and the Behavioral intention (Venkatesh et al., 2003). In this model we have also introduced the variable Enjoyment which analyses whether the technology is perceived as amusing or not. This variable also analyses whether this technology can help to satisfy the customers necessities or not. Due to these factors we propose that the Enjoyment affects to the individual Attitude towards a technology (Rejón & Palma, 2017). The innovativeness will also play an important role in order to predict the Attitude towards the innovation. This is because the Personal innovativeness refers to the willingness to use a determinate innovation without worrying about the experiences of other users (Rejón & Palma, 2017; Frambach & Schillewaert, 2002). Other variables that affects the customers’ attitude are the Social influence and the Previous training. On the first case, Social influence is a normative variable which 9.
(10) A model of acceptance of virtual reality by tourists in the selection of destinations (Forteza-Grimalt, I., 2017). evaluates the societies pressure and that may affect our behaviour. We have to remark that social networks or the different environments in which we are developing our lives (like social activities or work environment) may affect our behaviour. For these reasons, the different social environment could have a critical influence in the customers’ attitude (Frambach & Schillewaert, 2002). Another variable that may affect the customers’ behavior is the Previous training they have had which plays an important role to make the customer comfortable with the use of technology, increasing their confidence and, finally, encouraging their use of this technology (Rejón & Palma, 2017). There is a noted linkage between the variables attitude and use intention which is described by Lam, Cho, & Qu (2007). Aside from this linkage we have also introduced in our model the variable Behavioural intention as the final factor, which helps us in order to predict the future uses of the innovation. To sum up, the customers’ attitude affects directly to the Behavioral intention, whose variable will finally be affected by all the model factors. Apart from the customers’ attitude, other variables like Perceived usefulness also affects the Behavioral intention (Liao, Tsou, & Shu, 2008). As Davis (1989) said, Perceived usefulness defines the probability to use a specific software and increase the customers’ performance or leisure. Based on this we can affirm that the Perceived usefulness tends to be one of the most important determinants to influence the Behavioral intention (Lee, Park, & Ahn, 2001). We have proposed three categories inside the Perceived usefulness. Firstly, we have proposed the category Alternative instead of travel which tries to capture the provided usefulness of VR as a substitute of traveling. Recent studies affirm that virtual reality can be an alternative instead to physical traveling to a concrete destination and can be very helpful for persons with mobility problems or even for people with lack of time, money or other kinds of reasons. (Lee & Oh, 2007) Furthermore, there are other special cases in which a "virtual tour" could be chosen instead of physical tours, for instance, people which have travel anxiety can use the "virtual tour" as a route of scape. This fact could produce a psychological relief for the customer (Lee & Oh, 2007). And finally, "virtual tours" can also be considered in order to discover ancient époques, dangerous destinations, unreachable places or places which needs to be reconstructed (Guttentag, 2010). The second category that we have proposed is that VR can be used to adjust the expectation to the given final service. This would be very helpful in order not to frustrate the customer expectations. Due to this VR offers enjoyable experiences toward a concrete tourism destination and thanks to this use of VR, customer can experience the situation and adjust their destiny expectation to the reality. Consequently, tourist can have a bigger satisfaction in their vacations (Cheong, 1995; Williams & Hobson, 1995). For instance, 10.
(11) A model of acceptance of virtual reality by tourists in the selection of destinations (Forteza-Grimalt, I., 2017). with VR, customers can experience the atmosphere of other destinations, climate, illumination, facilities, cultural problems (like traffic signals in other languages...) and other specific things. Thanks to that the tourist can have a clearer and more realistic perspective of the travel destination (Lisnevska, 2017). Moreover, due to these facts mentioned before the viewer can have a more reliable information towards the travel destination and these elements could also reduce the uncertainty of the client giving them more tangible information (Lisnevska, 2017). The last factor that we have proposed in the category is Attitude toward destination, that shows that VR can be used to change the attitude towards destinations which is strongly related with the category expectations adjustment. In this case, the customer can be influenced though VR and change their feeling towards a concrete destination. Additionally, the possibility to catch the customer’s attention increases with VR devices. In this mentioned content, it is displayed in a sensitive and fully immersive situation and VR customers are completely focused in the virtual reality experience (Barnes, 2017; Marchiori et al., 2017). To conclude our model, we have proposed the factor Behavioural intention. This factor is used in order to explain the final purchase intention of the customer (Davis, 1989). Lam et al. (2007) conclude that an effective use of the innovation relies on the positive intention of the customers towards a concrete technology. For this reason, we have proposed the variable behavioral intention as the sum of multiple variables which has been finally affected during the process of forming the customer’s opinion (Rejón & Palma, 2017). Finally, in order to complement and extract some conclusions in different segments of the society, we have asked about personal attributes, socio-demographic information or travel routines. Due to this fact we have the possibility to diversify our sample and extract different results depending on their personal socio-characteristics as long as we have a larger sample to analyze.. 11.
(12) A model of acceptance of virtual reality by tourists in the selection of destinations (Forteza-Grimalt, I., 2017). 4.1. Procedure of our sample collection. The participants have been collected using a non-probabilistic sample of convenience by the snowball method. The survey was completed using a Computer Assisted Web Interviewing (CAWI) by mail. The date of our sample collection was between August and September 2017. In this analysis, our goal was to achieve 100 answers to have a consistent analysis of our questionnaire. Table 2. Data sheet Population Sampling error Confidence interval Sample size collected Date. 225000 ± 10 % 95 % 100 August – September 2017. Table 3. Sociodemographic profile of the sample N % Mean Max. Min. M SD Gender. Marital Status. Income (EUR). Highest academic qualification. Traveling Frequency (Approximate). Did you ever used VR?. Male Female Age Divorced Married Separated Single Widowed +3001 0-300 1001-1500 1501-2000 2001-3001 301-600 601-1000 Bachelor or similar Master / Doctorate Secundary University No travels Every two years Every Year Every half year Every Month No Yes. 46 46,0% 54 54,0% 36,4 8 16 9 64 3 10 6 23 31 15 4 11. 64,0. 21,0 33,0 12,2. 8,0% 16,0% 9,0% 64,0% 3,0% 10,0% 6,0% 23,0% 31,0% 15,0% 4,0% 11,0%. 20 20,0% 28 1 51 2 14 30 41 13 66 34. 28,0% 1,0% 51,0% 2,0% 14,0% 30,0% 41,0% 13,0% 66,0% 34,0%. The questionnaire was structured as follows: an introduction to the survey, including an explanation of the research purpose, followed by a definition of VR concept and the length of the survey. We have also provided a video, which shows an idea about the VR performance. The questionnaire consists of 14 sections and each section tries to explain. 12.
(13) A model of acceptance of virtual reality by tourists in the selection of destinations (Forteza-Grimalt, I., 2017). the variables that we are studying. The questionnaire includes a total of 62 items (see ANNEX), for this reason, the average time of the questionnaire was around 15 minutes. Regarding the literature, we have designed the following scales of measurements used in the questionnaire (see table 7). In order to validate the mentioned questionnaire, a pretest was made to 30 participants with the aim of assessing the nomological validity and comprehension of the proposed scales. All the items used were Likert scales from 1 to 7 (1 - strongly disagree to 7 - Strongly agree). Furthermore, in some items, we have reversed the scale in order to avoid convenience patterns of response by the respondents like EOU or ENJOY. For this project, we have used partial least squares structural equations path modelling (PLS-SEM) regarding the (Hair, Ringle, & Sarstedt, 2013) which remarks the importance to have adequate variables and items representative of the construct model. We have also selected the software SmartPLS which has lower restrictions on the measurement scales, sample size or the residual distributions (Ram, Corkindale, & Wu, 2013).. 5 5.1. Results Exploratory factorial analysis and evaluation of the measurement model. In this section, we are going to show the results of the exploratory factorial analysis realized about the application of VR applied to the tourism sector. In our model, we have realized some adjustments and some items have been removed from the model in order to provide a more accurate explanation of the customers’ behavioural intention. The criteria that we have followed to delete these items from our model is to suppress the factor loadings with a value lower than 0,4. Due to this, we have deleted from our model the items EOI1, EOI3, EOI5, EOI6 and ENJOY2 (see table 7). Aditionally, in our analysis we have found a strong relationship between the responses to the factors: Individual adoption of innovation and Attitude toward innovation (VR), both factors are considered the same thing by the respondents, but in reality, they are not the same thing. Due to this fact, we have decided to delete the factor Individual adoption of innovation to avoid statistical problems. Regarding the reflective measurement model to obtain correct reliability, the indicators of the factor loading has to be equal or higher than 0,7 and they also have to be significant (lower t-values than 1.96) (see table 4). We decided to delete the variable Training in order to obtain a better convergence between the other variables. We have to remark that some items from the Attitude toward VR show values slightly lower than 0,7, however, their t-values are correct and we have decided to maintain it because as Hair said, the rule of 0,7 is flexible, especially when the items are contributing to validate the factor (Hair et al., 2013).. 13.
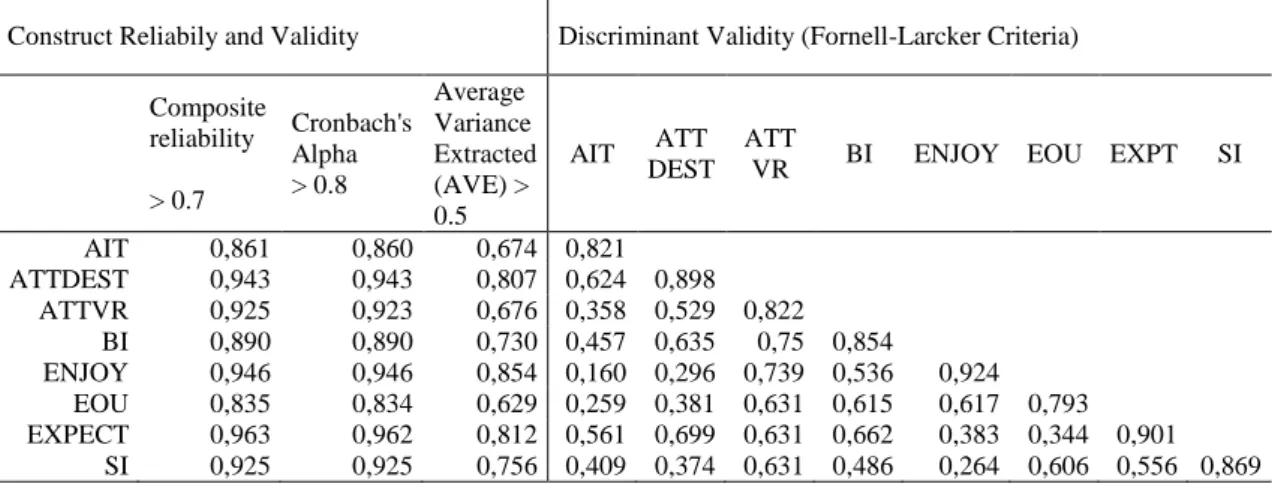
(14) A model of acceptance of virtual reality by tourists in the selection of destinations (Forteza-Grimalt, I., 2017). Table 4. Model factor loadings Items Factor loadings EOU2 0,767 EOU4 0,754 EOU7 0,855 ENJ1 0,934 ENJ3 0,922 ENJ4 0,918 SI1 0,844 SI2 0,920 SI3 0,899 SI4 0,811 EXPECT1 0,734 EXPECT2 0,931 EXPECT3 0,953 EXPECT4 0,941 EXPECT5 0,843 EXPECT6 0,982. Items Factor loadings AIT1 0,778 AIT2 0,815 AIT3 0,868 ATTDEST1 0,993 ATTDEST2 0,950 ATTDEST3 0,896 ATTDEST4 0,732 ATTVR1 0,753 ATTVR2 0,894 ATTVR3 0,892 ATTVR4 0,895 ATTVR5 0,686 ATTVR6 0,788 BI1 0,842 BI2 0,882 BI3 0,838. Alpha de Cronbach analyses the reliability of the different scales, for values higher than 0,8 there are considered as reliable. As we can see in table 5 in the preliminary analysis, all the variables are the accepted parameters of the Alpha de Cronbach scale, then we can conclude that all the items are reliable. In addition, the parameters of composed reliability and Average Variance Extracted (AVE) shows us that our indicators are well measured and the items are well-adjusted to measure the different factors. In the composed reliability case the factor values have to be higher than 0,7 and to analyse the parameter AVE the values have to be higher than 0,5 (Hair et al., 2013; Roldán & Sánchez-Franco, 2012). As we can see in the table 5, all the factors show an Alpha of Cronbach and a composite reliability greater than 7 points, reason why the reliability is adequate. Regarding the criteria of convergent validity, all the constructs had an average variance extracted (AVE) greater than 0.5 therefore, it is also correct. Furthermore, in the discriminant validity test, the square root of the AVE was greater than the correlations between constructs. Then, we can also prove that constructs that do not have any relation, do not have it (Roldán & Sánchez-Franco, 2012).. 14.
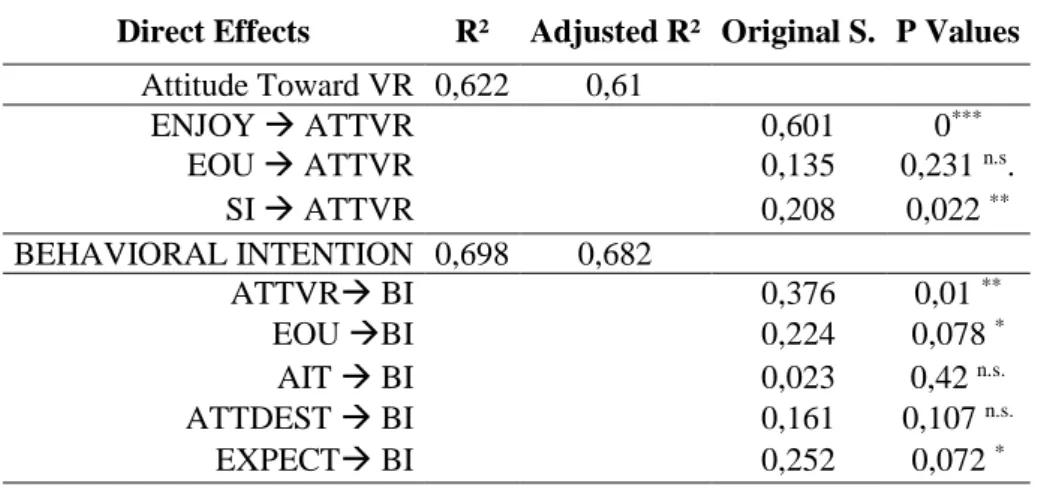
(15) A model of acceptance of virtual reality by tourists in the selection of destinations (Forteza-Grimalt, I., 2017). Table 5. Construct reliability and discriminant validity Construct Reliabily and Validity. Discriminant Validity (Fornell-Larcker Criteria). Average Composite Cronbach's Variance reliability ATT ATT Alpha Extracted AIT BI ENJOY EOU EXPT SI DEST VR > 0.8 (AVE) > > 0.7 0.5 AIT 0,861 0,860 0,674 0,821 ATTDEST 0,943 0,943 0,807 0,624 0,898 ATTVR 0,925 0,923 0,676 0,358 0,529 0,822 BI 0,890 0,890 0,730 0,457 0,635 0,75 0,854 ENJOY 0,946 0,946 0,854 0,160 0,296 0,739 0,536 0,924 EOU 0,835 0,834 0,629 0,259 0,381 0,631 0,615 0,617 0,793 EXPECT 0,963 0,962 0,812 0,561 0,699 0,631 0,662 0,383 0,344 0,901 SI 0,925 0,925 0,756 0,409 0,374 0,631 0,486 0,264 0,606 0,556 0,869 NOTE: The elements of the diagonal are the square root of the AVE. The off-diagonal elements are the correlations between the different factors.. 5.2. Evaluation of the structural model and multigroup analysis. In order to proceed with the study of the different factors, we have done an analysis to know their significance inside the model. As we can see in table 6, we have obtained a R² of 0,622 in the variable Attitude toward VR and a R² of 0,698 in the variable Behavioural intention, in other words, we were able to explain more than 60% of the variance in both factors of study (Attitude toward VR and Behavioural intention), with the 8 proposed factors of study. Then, we can conclude that the explained variance in these two factors is really good and we can confirm the predictive relevance of this model. Furthermore, table 6 shows the quantity of variance explained by each variable antecedent to the variance explained by Attitude toward VR and Behavioural intention, and p-values based on the t-student distribution which shows us the level of significance of the variables. Due to this results we can affirm that there is a significant and positive association between the factors SI (significant level of 95%) and Enjoy (significant level of 99%) toward the factor ATT VR, and the association between the factors EOU and ATT VR is not significant. Additionally, regarding the behavioural intention factor, this factor has a positive and significate association with the factors ATT VR (significant level of 95%), EOU (significant level of 90%) and EXPECT (significant level of 90%). However, there is no significant relationship between BI and the factors AIT and ATT DEST.. 15.
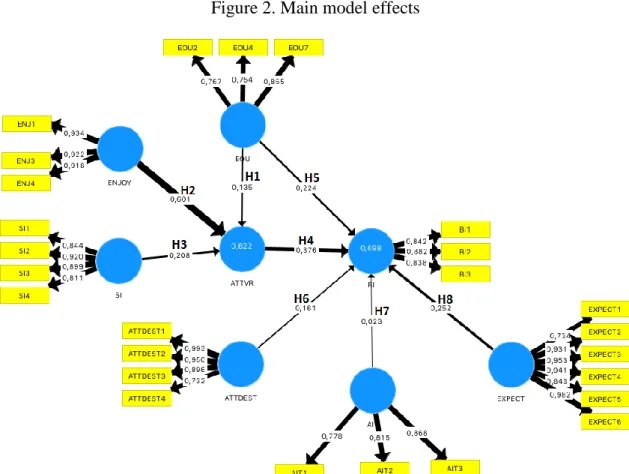
(16) A model of acceptance of virtual reality by tourists in the selection of destinations (Forteza-Grimalt, I., 2017). Table 6. Effects of endogenous variables Direct Effects. R². Adjusted R² Original S. P Values. Attitude Toward VR 0,622 0,61 ENJOY ATTVR 0,601 0*** EOU ATTVR 0,135 0,231 n.s. SI ATTVR 0,208 0,022 ** BEHAVIORAL INTENTION 0,698 0,682 ATTVR BI 0,376 0,01 ** EOU BI 0,224 0,078 * AIT BI 0,023 0,42 n.s. ATTDEST BI 0,161 0,107 n.s. EXPECT BI 0,252 0,072 * NOTE: * p<0.1; **p<0.05; ***p<0.01; n.s. = No significant. A multigroup analysis was carried out, with the intention of testing the moderating effect of certain socio-demographic variables. The following conclusions were reached: The gender variable doesn’t affect the proposed model and there is no difference between travellers, in other words, the frequency of travel of the surveyed doesn’t affect significantly to our model. However, with the multigroup analysis, we have also found that the previous experience with virtual reality devices affects positively to final Behavioural intention, with a level of significance of 90%. Hence, the sociodemographic variables gender and frequency of travel don’t cause differences in the global model, except in the multigroup analysis realized between people who have previous experience with VR devices and people who not. Specifically, in the relationship between Attitude toward VR and the Behavioural intention, which is positive for both groups (previous experience and non-previous experience with VR) but the association is higher for these ones who have previous experience with this technology. · Coefficients Path and association between the factors. We clarify the relationships in our proposed model, thanks to the study of Paths coefficients which are versions of the standardized regressions and it analyses the association between two connected variables exploring their casual linkage in the SEM approach (CTI Reviews, 2016). As we can appreciate in figure 2, all the factors are well explained by their own items because all the coefficients paths are higher than 0.7. This means that the items included in the model they accomplish their mission to catch the essence of their factors. As indicated in figure 2, the major impact on the factor ATTVR is focused on the relationship with the factor Enjoy, which has a significant impact (Path coefficient .601). Furthermore, the factors EOU and SI has a minor effect on the factor ATTVR, with the paths coefficients of .135 and .208 respectively.. 16.
(17) A model of acceptance of virtual reality by tourists in the selection of destinations (Forteza-Grimalt, I., 2017). On the other hand, the factor BI is mostly influenced by the factor ATTVR with a Path Coefficient of .376, which include indirect effects of the factors mentioned before. Other factors that affect to the BI are the Perceived Usefulness group (ATTDEST, AIT & EXPECT). Inside this group. the factor with a major effect on BI is EXPECT with a Path Coefficient .252 followed by ATTDEST with a Coefficient Path of .161 and, lately the variable AIT has a residual effect of .023 on BI. Moreover, the factor EOU has a direct and indirect effect on the factor BI, the direct effect is higher than the indirect with a Coefficient Path of .224 and EOU acts also indirectly through the variable ATTVR with a minor final effect on BI. Figure 2. Main model effects. 6. Conclusions and evaluation of PLS Path model results. In this project, we have proposed a model in order to see the uses of VR to potentiate touristic destinations and discover the capacity of VR applied to touristic business. As we can see in the results the principal antecedent of the Attitude toward VR has been the variable Enjoyment β2= .601, followed by the Social influence pressures and the Ease of use, with lower rates. These results corroborate the importance of the enjoyment to promote VR devices, this goes in relation with Marchiori, Niforatos & Preto (2017) affirmations which says that the experience of VR is enjoyable, informative and amused. Furthermore, the first time that the user uses VR has a major impact on them, and users also remember their immersions into the VR experiences and try to extend their impressions to other people, 17.
(18) A model of acceptance of virtual reality by tourists in the selection of destinations (Forteza-Grimalt, I., 2017). this supposes a really good quality in order to promote destinations. For this reason, is important to show the enjoyment of this technology to the customers (Marchiori et al., 2017). The social environment could have a critical influence on the customers’ attitude and, the analysis shows that this impact doesn’t have a critical influence but it can also affect the final customer attitude (Rejón & Palma, 2017). On the other hand, in our model, the EOU (H1) has a minor impact as expected to the customer’s attitude β1= .135 (not significant). However, this rate increases when it affects directly to the Behavioural intention β5= .224. A sum of both impacts, direct (H5) and indirect (H1), confirms the hypothesis proposed by Venkatesh et al. (2003) & Lim & Ting (2012). However, this impact has a lower rate compared to the importance of the Enjoyment in our model. To sum up, on the factor ATTVR the major impact is the enjoyment, this means that the clients prefer to have fun with VR devices instead of potentiating other variables, like the facility of use. Regarding the factor Behavioural intention, it goes preceded by the factor ATTVR β4= .376 which has the major importance to determine the variance of the Behavioural intention. This goes in relation with the H4 proposed by Lam, Cho, & Qu (2007) which relate the strong linkage between these two factors. In addition, the three factors included in the Perceived usefulness has a minor impact on the behavioural intention. In this group, the only significant factor is the variable expectations β8= .252. Which confirms the Lisnevska (2017) hypothesis which says that the VR devices could be very useful in order to adjust the customer expectations to the reality, helping the customer to decide between different destinations (H8). However, the variables AIT and ATTDEST are not significant. These go on the opposite side of the affirmations of O. Lee & Oh (2007) and Guttentag (2010), which says that user can consider the VR instead of the physical travel, for instance for people who have anxiety problems or to discover ancient places. However, this results confirms the hypothesis of Lisnevska (2017) which says that the final consumer does not consider VR as an option instead of traveling yet. To sum up, one of the most important difficulties that we can find is that clients do not consider VR a substitutive of travelling. Instead of this they consider VR as a tool to experience further travel destinations and have a more accurate idea about the reality of the travel destination and adjust their expectation to the reality (Lisnevska, 2017). Regarding this idea Paquet & Viktor (2005) said ‘‘Most people want to see reality and not only virtuality’’. Finally, I would like to mention that with these results we have achieved to validate a model to predict the intention of use of the VR technology. Specifically, we are able to explain a 70% of the total variance approximately.. 18.
(19) A model of acceptance of virtual reality by tourists in the selection of destinations (Forteza-Grimalt, I., 2017). 6.1. Managerial implications. In order to promote the Virtual Reality technology, businesses have to take in conscience the importance of presenting an enjoyable product. For instance, to improve attitude of the potential customers, businesses have to design a marketing campaign which shows people having fun with your product instead of showing the use facility or the devices features. Finally, after catching the customers’ attention, businesses have to show the Ease of use of the device and present them as a tool that is able to adjust the expectations of the travellers. A set of these previous qualities of VR mentioned before can generate some leads for the client increasing their curiosity toward the travel destination. Due to this we can generate a higher willingness to experience this different way of tourism. This could help to increase the destinations sales, thanks to this curiosity produced by VR. These different qualities of VR could represent a new form to develop marketing or promote tourism destinations, thanks to the enjoyment of this new technology (Marchiori et al., 2017). 6.2. Limitations of our proposed model. Regarding the model limitations, we have to remark the importance of having a bigger sample to analyse. In our case, the sample size is 100 responses which are a smaller size than desired. This created a difficulty in this study in order to obtain significant results because it is easier to analyse the effects of a model with a bigger sample size. Furthermore, some items that we have analysed have had to leave the model because they have not been understood by the respondents and must be corrected for future lines of the research. This is the case of variables like Training in which the respondent did not understand clearly the different items proposed. The need of deleting this item, could be due to the lower rate of use of the VR devices, as only 34 respondents had used this technology before. Moreover, another difficulty that we have found is the poor geographical representation. As we can see, our sample is fully represented by Majorcan people. This could be the reason of the non-significance between the frequent travellers and non-frequent travellers because people in Majorca have to take an airplane or a ship in order to travel and this increases the travel frequency significantly. Finally, in our model we have only measured the intention of use and not the final use. There is still one step left: calculate the final adoption of the technology that can still change the final customer decision in order to purchase the final product/service.. 19.
(20) A model of acceptance of virtual reality by tourists in the selection of destinations (Forteza-Grimalt, I., 2017). 6.3. Future lines of research. In order to follow the proposed study, the future researchers have to apply a bigger size sample and increase their sample representatively to have a better approach of our society representation. Researcher has to improve the items included in the questionnaire and their distribution. Moreover, it could be interesting to include other external variables into the model like, Price perception or Final technology adoption / Final use of the technology in order to have a wider vision of the global level of adoption. To sum up, for future researches, as we have mentioned before, we have to measure the final use of the technology and measure the Behavioural intention as a linkage. With this factor (Behavioural Intention) we can only have a clue of the customer’s intention. In addition, using a more sophisticated sample (bigger size and randomly selected) we can validate all the findings of this project.. 7. Acknowledgements. This work was done at the University of the Balearic Islands under the direction of Francisco Rejón Guardia, who I want to express my deep gratitude for the invested time and support given. Additionally I want to thank everybody who contributed by any means to this project.. 20.
(21) A model of acceptance of virtual reality by tourists in the selection of destinations (Forteza-Grimalt, I., 2017). 8. References. Ahmad, M. I. (2014). Unified Theory of Acceptance and Use of Technology (UTAUT). In proceedings of Fourth International Conference on ICT in our lives 2014 ―Information Systems Supporting Decision Making” (ISSN 2314-8942), Information Systems and Computer Science Department, Faculty of Commerce, Alexandria University, Alexandria, Egypt, December 20-22. Al-Gahtani, S. S., & King, M. (1999). Attitudes, satisfaction and usage: Factors contributing to each in the acceptance of information technology. Behaviour & Information Technology, 18(4), 277– 297. https://doi.org/10.1080/014492999119020 Barnes, S. J. (2017, January). Understanding Virtual Reality in Marketing: Nature, Implications and Potential (PDF Download Available). Retrieved July 19, 2017, from https://www.researchgate.net/publication/313135906_Understanding_Virtual_Reality_in_Marke ting_Nature_Implications_and_Potential Cenfetelli, R. T., Benbasat, I., & Al-Natour, S. (2008). Addressing the What and How of Online Services: Positioning Supporting-Services Functionality and Service Quality for Business-to-Consumer Success. Information Systems Research, 19(2), 161–181. https://doi.org/10.2307/23015431 Cheong, R. (1995). The virtual threat to travel and tourism. Tourism Management, 16(6), 417–422. https://doi.org/10.1016/0261-5177(95)00049-T Davis, F. D. (1989). Perceived Usefulness, Perceived Ease of Use, and User Acceptance of Information Technology. MIS Quarterly, 13(3), 319–340. https://doi.org/10.2307/249008 Delone, W. H., & McLean, E. R. (2003). The DeLone and McLean Model of Information Systems Success: A Ten-Year Update. Journal of Management Information Systems, 19(4), 9-30. Doyle, P., Gelman, M., & Gill, S. (2016). Viewing the Future? Virtual Reality in Journalism. Knight Foundation. Retrieved from https://www.knightfoundation.org/reports/vrjournalism Fishbein, M. (1979). A theory of reasoned action: Some applications and implications. Nebraska Symposium on Motivation. Frambach, R. T., & Schillewaert, N. (2002). Organizational innovation adoption: a multi-level framework of determinants and opportunities for future research. Journal of Business Research, 55(2), 163– 176. https://doi.org/10.1016/S0148-2963(00)00152-1 Guttentag, D. (2010). Virtual reality: Applications and implications for tourism (PDF Download Available). ResearchGate. https://doi.org/http://dx.doi.org/10.1016/j.tourman.2009.07.003 Juniper Research. (2015). VIRTUAL REALITY: VIRTUALLY HERE. Juniper Research. Lam, T., Cho, V., & Qu, H. (2007). A study of hotel employee behavioral intentions towards adoption of information technology. International Journal of Hospitality Management, 26(1), 49–65. https://doi.org/10.1016/j.ijhm.2005.09.002 Lee, D., Park, J., & Ahn, J. (2001). On the Explanation of Factors Affecting E-Commerce Adoption. Retrieved September 4, 2017, from https://www.researchgate.net/publication/221599387_On_the_Explanation_of_Factors_Affectin g_E-Commerce_Adoption Lee, O., & Oh, J.-E. (2007). The Impact of Virtual Reality Functions of a Hotel Website on Travel Anxiety. CyberPsychology & Behavior, 10(4), 584–586. https://doi.org/10.1089/cpb.2007.9987 Lewis, W., Agarwal, R., & Sambamurthy, V. (2003). Sources of Influence on Beliefs about Information Technology Use: An Empirical Study of Knowledge Workers. Management Information Systems Quarterly, 27(4). Retrieved from http://aisel.aisnet.org/misq/vol27/iss4/6 Liao, C.-H., Tsou, C.-W., & Shu, Y.-C. (2008). The roles of perceived enjoyment and price perception in determining acceptance of multimedia-on-demand. Retrieved from https://www.researchgate.net/publication/285866441_The_roles_of_perceived_enjoyment_and_ price_perception_in_determining_acceptance_of_multimedia-on-demand Lim, W. M., & Ting, D. H. (2012). E-shopping: an Analysis of the Technology Acceptance Model. Modern Applied Science, 6(4), 49. https://doi.org/10.5539/mas.v6n4p49. 21.
(22) A model of acceptance of virtual reality by tourists in the selection of destinations (Forteza-Grimalt, I., 2017). Lisnevska, A. (2017, February 8). VR as a Marketing Tool for Destinations. Retrieved March 1, 2017, from http://www.virtual-reality-in-tourism.com/vr-as-a-marketing-tool-destinations/ Marchiori, E., Niforatos, E., & Preto, L. (2017). Measuring the Media Effects of a Tourism-Related Virtual Reality Experience Using Biophysical Data. In Information and Communication Technologies in Tourism 2017 (pp. 203–215). Springer, Cham. https://doi.org/10.1007/978-3319-51168-9_15 Polimeris, S., & Calfoglou, C. (2016). Cultural Tourism Destinations and the Power of Virtual Reality. In Tourism and Culture in the Age of Innovation (pp. 577–587). Springer, Cham. https://doi.org/10.1007/978-3-319-27528-4_39 Rejón, F., & Palma, A. (2017). A Model of Literature Adoption in Higher Education: An Approach Using Historical Novels. Roldán, J. L., & Sánchez-Franco, M. J. (2012). Variance-Based Structural Equation Modeling: Guidelines for Using Partial Least Squares in Information Systems Research. Retrieved September 9, 2017, from https://www.researchgate.net/publication/249323258_VarianceBased_Structural_Equation_Modeling_Guidelines_for_Using_Partial_Least_Squares_in_Inform ation_Systems_Research Talukder, D. M. (2014). Managing innovation adoption : from innovation to implementation / Majharul Talukder. Tussyadiah, I. P., Wang, D., & Jia, C. (Helen). (2017). Virtual Reality and Attitudes Toward Tourism Destinations. In Information and Communication Technologies in Tourism 2017 (pp. 229–239). Springer, Cham. https://doi.org/10.1007/978-3-319-51168-9_17 Venkatesh, V., Morris, M., Davis, G., & Davis, F. (2003). User Acceptance of Information Technology: Toward a Unified View. Management Information Systems Quarterly, 27(3). Retrieved from http://aisel.aisnet.org/misq/vol27/iss3/5 Vince, J. (2004). Introduction to Virtual Reality. Retrieved July 19, 2017, from https://www.researchgate.net/publication/233781870_Introduction_to_Virtual_Reality Williams, P., & Hobson, J. P. (1995). Virtual reality and tourism: fact or fantasy? Tourism Management, 16(6), 423–427. https://doi.org/10.1016/0261-5177(95)00050-X Zhang, Y., & Khare, A. (2009). The impact of accessible identities on the evaluation of global versus local products. Journal of Consumer Research, 36(3), 524–537. https://doi.org/10.1086/598794. 22.
(23) A model of acceptance of virtual reality by tourists in the selection of destinations (Forteza-Grimalt, I., 2017). 9. Annex Table 7. Description of items included in the model. EASE OF USE Likert scale 7 points. Items. Description. Scales (Authors). EOU1 EOU2 EOU3 EOU4. I believe that VR are cumbersome to use Learning to use VR was easy for me. Using VR was often frustrating. I believe that it was easy to get VR to do what I want it to do while I use it. Using VR system required a lot of mental effort. My interactions with VR was clear and understandable. Overall, I believe that VR was easy to use. Enjoyable Boring Interesting Fun If I hear of a new learning tool, I like to experiment with it. Amongst my friends, I am the first to use innovations which improve my learning. I like to experiment with information technology and software. I am always keen to learn about new learning tools and systems. I have learnt more about the use of short stories/historical novels as a learning tool on my own initiative. The friends who influence my behavior think I should use VR. The different social pressures and new trends have influenced to me in order to use VR. Social Media or other social sources have been a great influence to use VR. In general, people have influenced in the use of VR. It is necessary to have a previous training to use VR, for instance other new technologies. The different given information to use of VR have been clear and have helped you increase your ability to use them. A specific person has given you individual support in case of difficulties with the tool. A guide to the use of the VR has been made available to you. If I use VR devices I will increase my satisfaction on the travel. If I use VR I will spend less time on some travel routines like information research tasks. I will increase the quality of output of my travel. Using VR for travelling research I will increase the quantity of output for the same amount of effort. My friends will perceive me as competent to organize the travel. I will increase my chances of getting a higher satisfaction for my travel. The tools and satisfaction provided by VR help me replace the physical travel. The satisfaction provided by VR help me to replace my travel in case of impossibility to travel. The tools and information provided in the VR travels help me to acquire the same knowledge as in a physical travel. The VR devices help me to change my attitude toward a touristic destination.. Al-Gahtani & King (1999). EOU5 EOU6. ENJOYMENT OF INNOVATION Likert scale 7 points PERSONAL INNOVATIVENESS Likert scale 7 points. EOU7 ENJOY1 ENJOY2 ENJOY3 ENJOY4 INN1 INN2 INN3 INN4 INN5. SOCIAL INFLUENCE Likert scale 7 points. SI1 SI2 SI3. TRAINING Likert scale 7 points. SI4 TRAI1 TRAI2. TRAI3 TRAI4 EXPECTATIONS ADJUSTMENT Likert scale 7 points. EXPECT1 EXPECT2 EXPECT3 EXPECT4 EXPECT5 EXPECT6. CONSIDER VR AS A SUBSTITUTIVE OF PHYSICAL TRAVEL Likert scale 7 points. AIT1 AIT2 AIT3. CHANGE THE ATTITUDE. ATTDEST1. 23. Al-Gahtani & King (1999). Lewis, Agarwal, & Sambamurthy (2003). Lewis, Agarwal, & Sambamurthy (2003). Al-Gahtani & King (1999). Venkatesh, Morris, Davis, & Davis (2003). Cenfetelli, Benbasat, Al-Natour (2008). &.
(24) A model of acceptance of virtual reality by tourists in the selection of destinations (Forteza-Grimalt, I., 2017). REGARDING A TOURISTIC DESTINATION Likert scale 7 points. ATTDEST2 ATTDEST3 ATTDEST4. ACTITUDE TOWARD VR TECHNOLOGY Likert scale 7 points. BEHAVIOURAL INTENTION Likert scale 7 points. ATTVR1 ATTVR2 ATTVR3 ATTVR4 ATTVR5 ATTVR6 BI1 BI2 BI3. 10. Tools provided by VR devices allow me to consider another travelling plan. The VR devices help me to replace a concrete touristic destination for another. Depending on the VR experience I will chose one or another destination. I say positive things about VR devices to other people. I believe this is a good technology. The VR technology is attractive to me. I like the VR technology. I prefer VR devices over others technologies. I would buy the VR technology. I intend to use VR increasingly in the future for instance to see films or other daily uses. I would like to use VR in other fields like tourism, rent a car or in real states. I will probably use more VR technology in the future.. Tussyadiah, Wang, & Jia (2017). Zhang & Khare (2009). Lam, Cho, & Qu (2007). Questionnaire. Welcome my name is Ignasi Forteza, I am doing my final master work, directed by the University of the Balearic Islands. Please take a moment to fill out this survey telling us about your attitude toward the VR technology and the furthers applications to the touristic sector. In order to have an overview, VR is defined as the use of a computer-generated 3D environment – called a ‘virtual environment’ (VE) – that one can navigate and possibly interact with, resulting in real-time simulation of one or more of the user’s five senses. ‘Navigate’ refers to the ability to move around and explore the VE, and ‘interact’ refers to the ability to select and move objects within the VE (Gutiérrez et al., 2008; Vince, 2004 & Guttentag, 2010). If you have never used VR, please take a look to the video below in order about have an idea of how it works. Answer this questionnaire will only take around 15 minutes and all the information will be confidential and only used as an aggregated data. Thanks for your attention. Constructs and measures of the variables Individual factors Strongly disagree 1 Disagree 2 Disagree somewhat 3 Undecided 4 Agree somewhat 5 Agree 6 Strongly agree 7 Use of technology 1) DID YOU EVER USED VR? a) Yes b) No c) I don’t remember or only once MAIN REASON TO DON’T USE VR 1) Which is the main reason for you to don’t use this technology? a) Lack of information about it b) Lack of needed knowledge to use it c) Price d) I don’t like this technology e) Other reasons. 24.
(25) A model of acceptance of virtual reality by tourists in the selection of destinations (Forteza-Grimalt, I., 2017). Attitudes ATTITUDE TOWARD INNOVATION (Lam, Cho, & Qu, 2007) 1) I apply innovations in my life. 2) I like to try new technologies when I have free time. 3) I find innovation easy. ACTITUDE TOWARD VR TECHNOLOGY (Mathwick, Charla, and Edward Rigdon; 2004), (Zhang, Yinlong, and Adwait Khare, 2009) & (Allen, Michael W., Richa Gupta, and Arnaud Monnier, 2008) 1) I say positive things about VR devices to other people. 2) I believe this is a good technology. 3) The VR technology is attractive to me. 4) I like the VR technology. 5) I prefer VR devices over others technologies. 6) I would buy the VR technology. Individual adoption of innovation INDIVIDUAL ADOPTION OF INNOVATION (Batanero & María, 2010) In relation to the total time spent using VR: 1) How long have you spent using VR (a) less than half an hour, to (e) more than three hours per week. 2) Frequency of use: on average, how long have you spent per week using VR? a) at least once a month or less, to e) various times a day. 3) Please indicate the level of use VR in your daily activities ENJOYMENT OF INNOVATION (Al-Gahtani & King, 1999) I found the use of VR: 1) Enjoyable 2) Boring 3) Interesting 4) Fun PERSONAL INNOVATIVENESS (Lewis, Agarwal, & Sambamurthy, 2003) 1) If I hear of a new learning tool, I like to experiment with it. 2) Amongst my friends, I am the first to use innovations which improve my learning. 3) I like to experiment with information technology and software. 4) I am always keen to learn about new learning tools and systems. 5) I have learnt more about the use of short stories/historical novels as a learning tool on my own initiative. EASE OF USE (Al-Gahtani & King, 1999) 1) I believe that VR are cumbersome to use. 2) Learning to use VR was easy for me. 3) Using VR was often frustrating. 4) I believe that it was easy to get VR to do what I want it to do while I use it. 5) Using VR system required a lot of mental effort. 6) My interactions with VR was clear and understandable. 7) Overall, I believe that VR was easy to use. Price perceptions RANGE OF PRICES 1) Which is the interval of prices that you think that VR is around? 2) Do you think that VR is expensive? 3) There is VR devices for less than 10€ are you abler to use if you know this information? Social influence SOCIAL INFLUENCE (Lewis, Agarwal, & Sambamurthy, 2003) 1) The friends who influence my behavior think I should use VR. 2) The different social pressures and new trends have influenced to me in order to use VR. 3) Social Media or other social sources have been a great influence to use VR. 4) In general, people have influenced in the use of VR. Organizational Factors TRAINING (Al-Gahtani & King, 1999) 1) It is necessary to have a previous training to use VR, for instance other new technologies. 2) The different given information to use of VR have been clear and have helped you increase your ability to use them. 3) A specific person has given you individual support in case of difficulties with the tool.. 25.
(26) A model of acceptance of virtual reality by tourists in the selection of destinations (Forteza-Grimalt, I., 2017). 4) A guide to the use of the VR has been made available to you.. Behavioural intention BEHAVIOURAL INTENTION (Lam, Cho, & Qu, 2007) 1) I intend to use VR increasingly in the future for instance to see films or other daily uses. 2) I would like to use VR in other fields like tourism, rent a car or in real states. 3) I will probably use more VR technology in the future. Actitude torward a destination CHANGE THE ATTITUDE REGARDING A TOURISTIC DESTINATION (Tussyadiah et al., 2017) 1) The VR devices help me to change my attitude toward a touristic destination. 2) Tools provided by VR devices allow me to consider another travelling plan. 3) The VR devices help me to replace a concrete touristic destination for another. 4) Depending on the VR experience I will chose one or another destination. Facility to adjust expectations EXPECTATIONS ADJUSTMENT (Venkatesh, Viswanath, Davis, and Davis, (2003) 1) If I use VR devices I will increase my satisfaction on the travel. 2) If I use VR I will spend less time on some travel routines like information research tasks. 3) I will increase the quality of output of my travel. 4) Using VR for travelling research I will increase the quantity of output for the same amount of effort. 5) My friends will perceive me as competent to organize the travel. 6) I will increase my chances of getting a higher satisfaction for my travel. VR as a substitutive CONSIDER VR AS A SUBSTITUTIVE OF PHYSICAL TRAVEL (Cenfetelli, Ronald T., Izak Benbasat, and Sameh Al-Natour, 2008) 1) The tools and satisfaction provided by VR help me replace the physical travel. 2) The satisfaction provided by VR help me to replace my travel in case of impossibility to trravel. 3) The tools and information provided in the VR travels help me to acquire the same knowledge as in a physical travel. SOCIO-DEMOGRAPHIC INFORMATION (Ramayah et al., 2009) (Kim and Forsythe, 2010). (Kraut et al., 1998) 1) Age 2) Gender 3) Marital Status 4) Income 5) Occupation 6) Highest academic qualification 7) Traveling Frequency. 26.
(27)
Figure
+2
Documento similar
A catchment model for river basins and a hydrodynamic model were combined in order to simulate the spreading of the turbidity plume produced by sediment discharges from the
No obstante, como esta enfermedad afecta a cada persona de manera diferente, no todas las opciones de cuidado y tratamiento pueden ser apropiadas para cada individuo.. La forma
The expansionary monetary policy measures have had a negative impact on net interest margins both via the reduction in interest rates and –less powerfully- the flattening of the
In the light of these reflections, and in order to fulfil the initial premises, our proposal presents a knowledge-model for object identification that: 1) describes an object
Simulations showed that (a) our model is consistent with behavioral IOR data [1], (b) the activation of visuomotor neurons in our model is qualitatively similar to the activity
Our doctorate thesis offers a novel sales forecasting model in order to predict the sales of products in different market segments, cultures, stages of the
In terms of moderation, gender affects three relationships: (1) ease of use –› perceived usefulness; (2) perceived usefulness –› attitude, and (3) intention –› actual
Even though the 1920s offered new employment opportunities in industries previously closed to women, often the women who took these jobs found themselves exploited.. No matter
